Category Archives: MODIS

Dense Fog Advisories over Missouri

CentralMissouri_14July2014loop

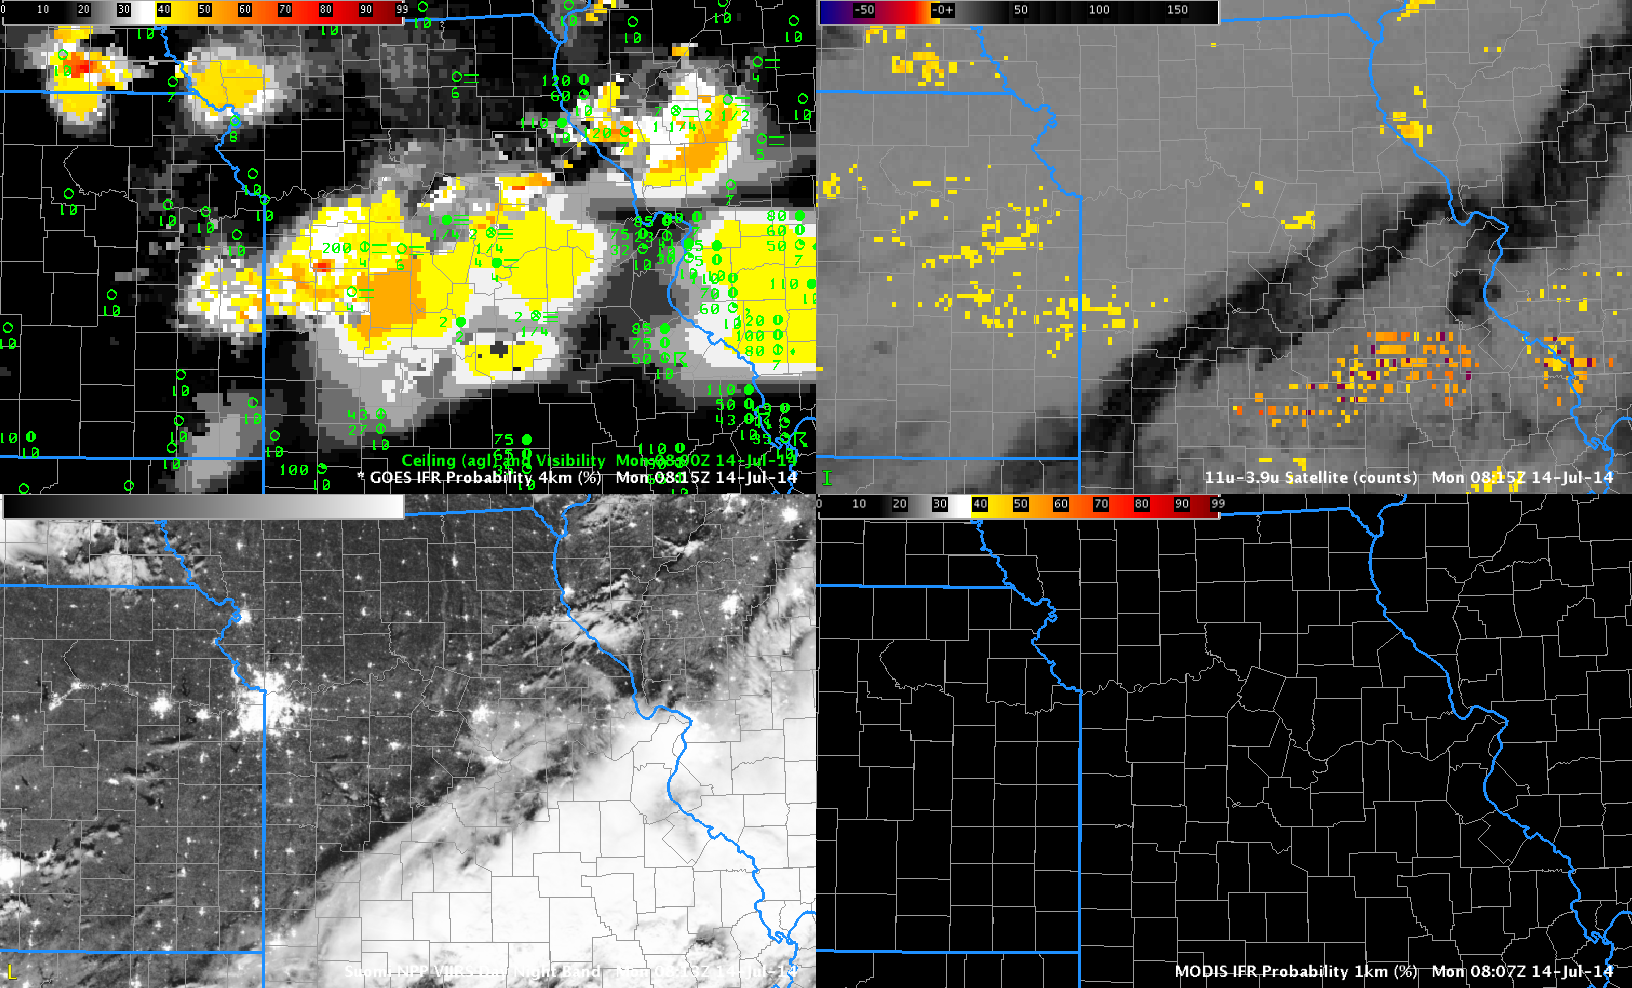
GOES-R IFR Probabilities (Upper Left), GOES-East Brightness Temperature Difference (10.7 µm – 3.9 µm) (Upper Right), Suomi/NPP Day/Night Band imagery (Lower Right), MODIS-based IFR Probabilitiy (Lower Left), times as indicated (Click to animate)

Moisture from departing late-day thunderstorms allowed for the development of dense fog over central Missouri overnight. The GOES-based IFR Probabilities, above, capture the low ceilings and reduced visibilities that developed. The traditional method of fog detection, the brightness temperature difference (BTD) between the 10.7 µm and 3.9 µm fields, was hampered by mid- and high-level clouds associated with the departing convection.

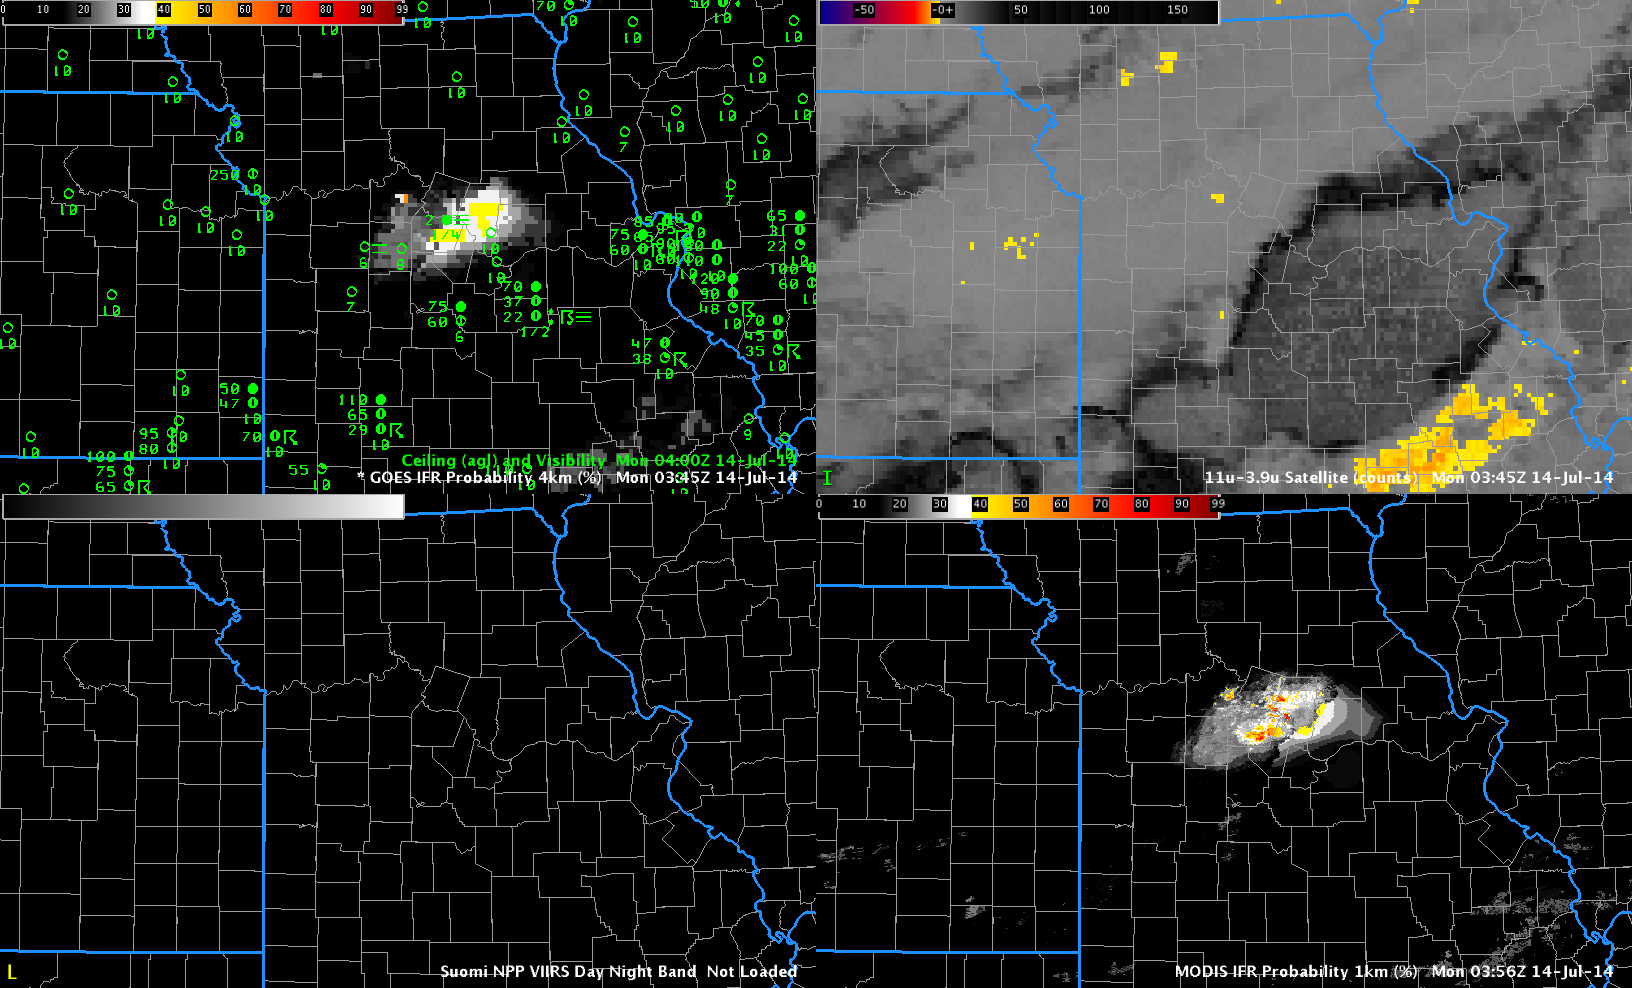
Polar-orbiting satellites such as Terra, Aqua and Suomi NPP can give high-resolution views of developing fog. In the present case, Terra overflew the region near 0400 UTC. The image below shows enhanced MODIS-based IFR Probabilities confined to central Missouri. An Aqua overpass at ~0800 UTC similarly gave a high spatial resolution view of the area. Of course, Terra and Aqua and Suomi NPP only give occasionaly snapshots. To see the ongoing development, temporal resolution as from GOES is key. But the polar orbiters can give an early alert if developing fog starts out at small scales that might be sub-pixel scale in GOES.

CentralMissouri_14July2014-18

As above, but at 0400 UTC 14 July 2014 (Click to enlarge)

From the National Weather Service in St. Louis:

URGENT – WEATHER MESSAGE
NATIONAL WEATHER SERVICE ST LOUIS MO
527 AM CDT MON JUL 14 2014

MOZ041-047>051-059-141400-
/O.NEW.KLSX.FG.Y.0002.140714T1027Z-140714T1400Z/
BOONE MO-CALLAWAY MO-COLE MO-GASCONADE MO-MONITEAU MO-
MONTGOMERY MO-OSAGE MO-
INCLUDING THE CITIES OF…COLUMBIA…JEFFERSON CITY
527 AM CDT MON JUL 14 2014

…DENSE FOG ADVISORY IN EFFECT UNTIL 9 AM CDT THIS MORNING…

THE NATIONAL WEATHER SERVICE IN ST LOUIS HAS ISSUED A DENSE FOG
ADVISORY…WHICH IS IN EFFECT UNTIL 9 AM CDT THIS MORNING.

* TIMING…DENSE FOG HAS DEVELOPED AND WILL CONTINUE THROUGH 900
AM.

* VISIBILITIES…ONE QUARTER MILE OR LESS AT TIMES.

* IMPACTS…SIGNIFICANTLY REDUCED VISIBILITIES WILL LEAD TO
HAZARDOUS DRIVING CONDITIONS.

PRECAUTIONARY/PREPAREDNESS ACTIONS…

A DENSE FOG ADVISORY IS ISSUED WHEN DENSE FOG WILL SUBSTANTIALLY
REDUCE VISIBILITIES…TO ONE-QUARTER MILE OR LESS…RESULTING IN
HAZARDOUS DRIVING CONDITIONS IN SOME AREAS. MOTORISTS ARE ADVISED
TO USE CAUTION AND SLOW DOWN…AS OBJECTS ON AND NEAR ROADWAYS
WILL BE SEEN ONLY AT CLOSE RANGE.

&&

$$

The aviation portion of the AFD from St. Louis mentioned the probability of fog at 0800 UTC; the 1129 UTC update discussed the fog that was present over central Missouri:

&&

.AVIATION: (For the 12z TAFs through 12z Tuesday Morning)
Issued at 609 AM CDT Mon Jul 14 2014

The first concern for this TAF package is that for low ceilings
and fog that have developed in the wake of precipitation that
exited the area overnight. In central MO and including KCOU, fairly
widespread dense fog has reduced visibilities to under 1/4SM for
much of the night. Further east and including metro area TAF sites,
trends indicate the potential for IFR cigs and MVFR visibility for
the first couple hours of the period. However, all sites affected
by fog should see an improvement through the morning hours as
ceilings lift and fog burns off. The second concern is that of a
second cold front, poised to move through the area today.
Currently, the cold front extends from roughly KDBQ southwestward
along the Missouri/Illinois border and just south of KAFK. While
showers may develop along the front as it moves through KUIN
during the late morning/early afternoon, greater instability
exists further south and east. Have currently continued VCSH
mention at KUIN and KCOU, and VCTS for metro TAF sites this
afternoon as the cold front moves through. Uncertainties regarding
coverage and exact timing preclude any TEMPO groups at this time.
The front should be south of all area TAF sites by 21Z, at which
time winds will have veered to the northwest and increased to
around 10-14KT. Winds will remain northwesterly through the end of
the period in the wake of the front, and while a mostly VFR
forecast is expected, reductions in ceilings/visibility may occur
with any storms that move over the terminals.

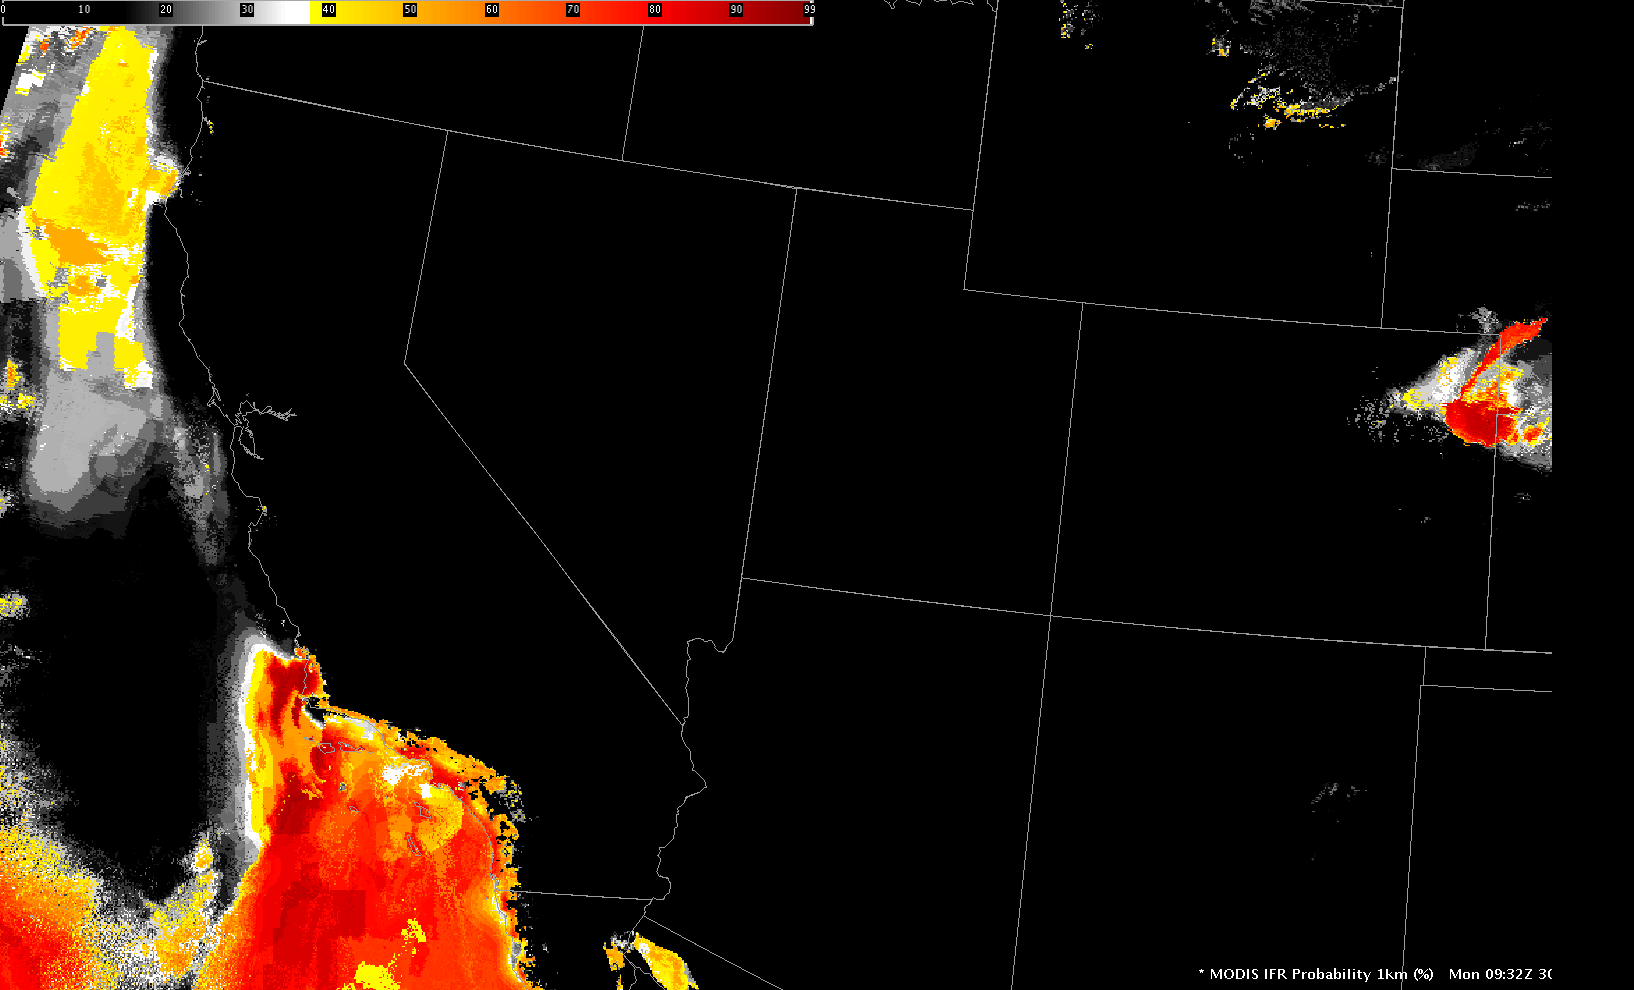
MODIS-based IFR Probability over California

CA_MODISIFR_0932_30June2014

MODIS-based IFR Probabilities over the western US, 0932 UTC on 30 June 2014 (Click to enlarge)

MODIS data, although infrequent, can give a high-resolution estimate of whether of not fog/low clouds are forming in a region. This is particularly useful for cases with highly variable terrain (such as deep river valleys). In the image above, IFR Probabilities are very low over both the Central Valley of California and over the Salinas Valley closer to the coast. Fog/low Stratus are unlikely to be occurring.

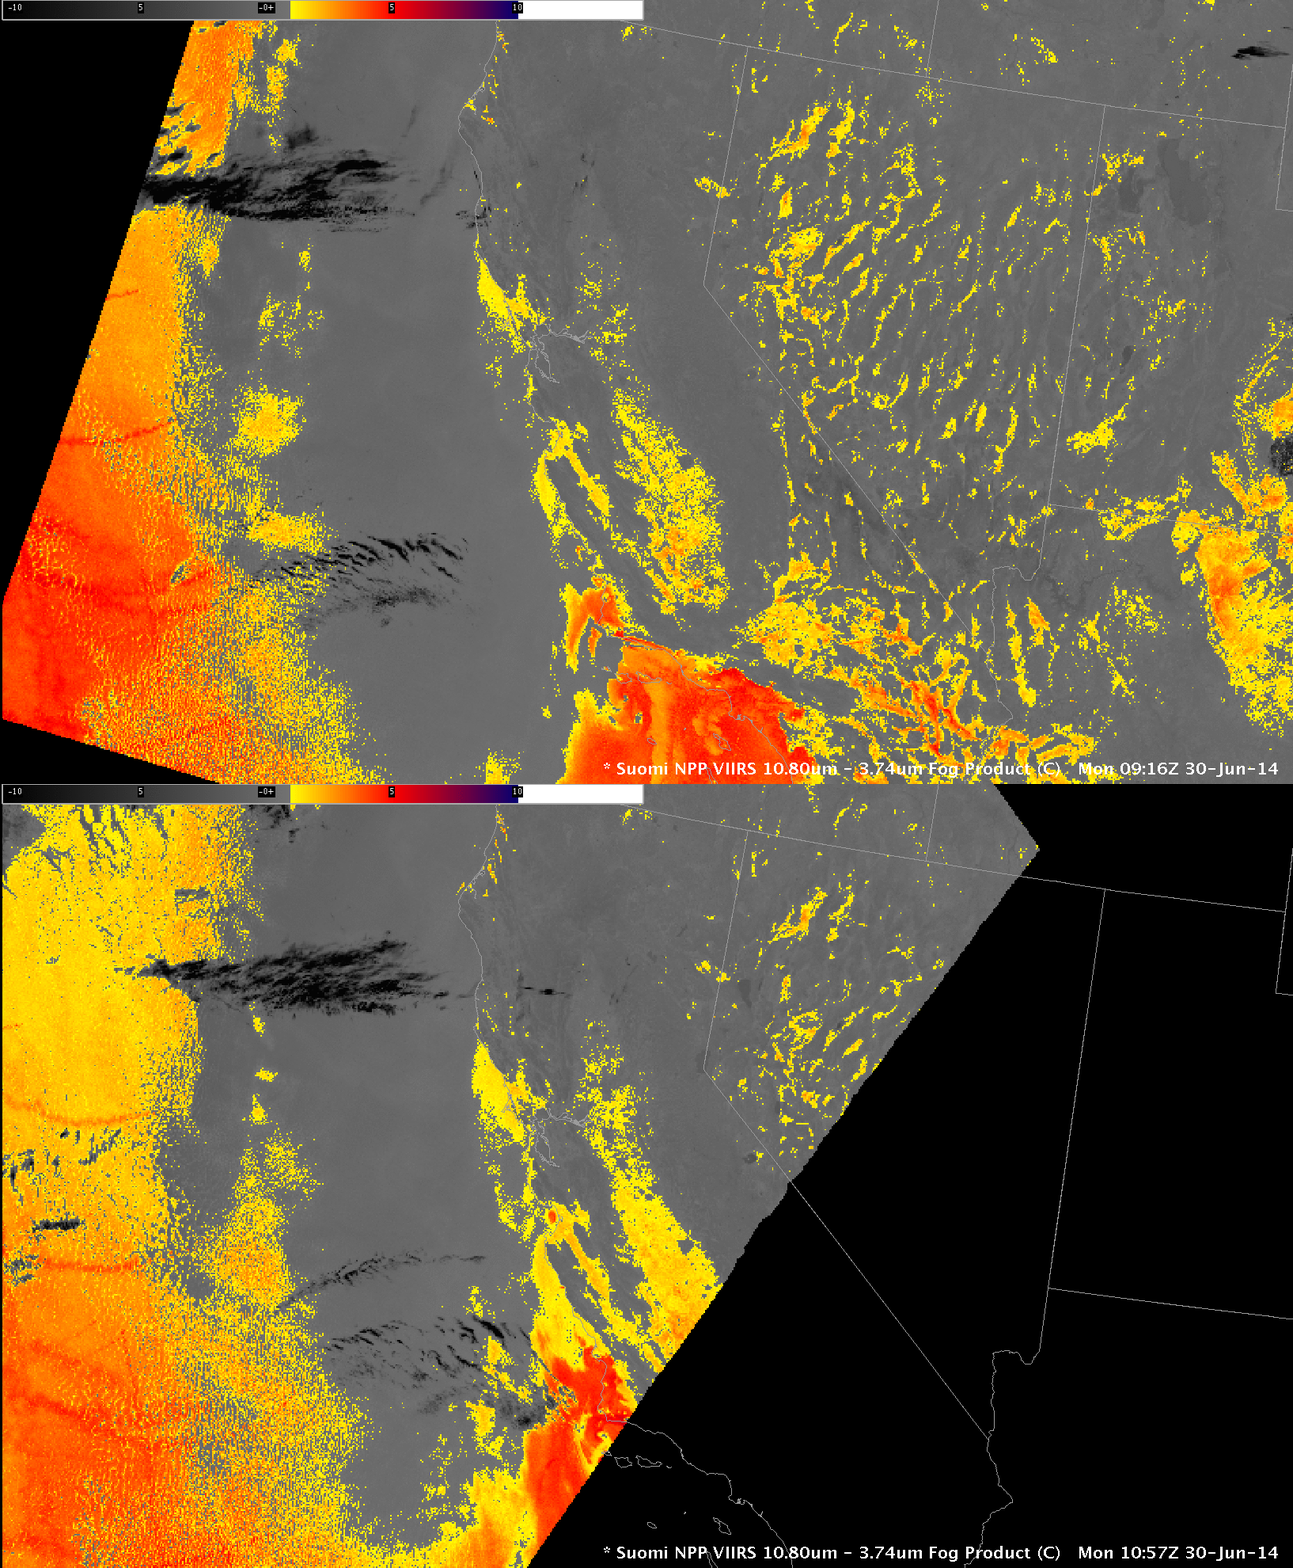
CA_SNPPBTD_30June2014_0916_1057

Suomi/NPP Brightness Temperature Difference Fields (11.35µm – 3.74µm) at 0916 and 1057 UTC on 30 June 2014 (Click to enlarge)

The orbital geometry of Suomi/NPP on June 30th was such that it provided two close-up views of these two valleys around/after the time of the MODIS pass shown above. The animation above toggles between those two times. The brightness temperature difference field shows a general increase in return signal strength. But the MODIS IFR Probability field, top, and GOES-West IFR Probability fields (not shown) support the view that any clouds present are not having an impact on ceilings and visibility. A toggle that includes ceilings and visibilities is here.

Note that returns that suggest low clouds over Nevada are more likely due to emissivity differences in different soils, an effect that is more obvious in very dry conditions.

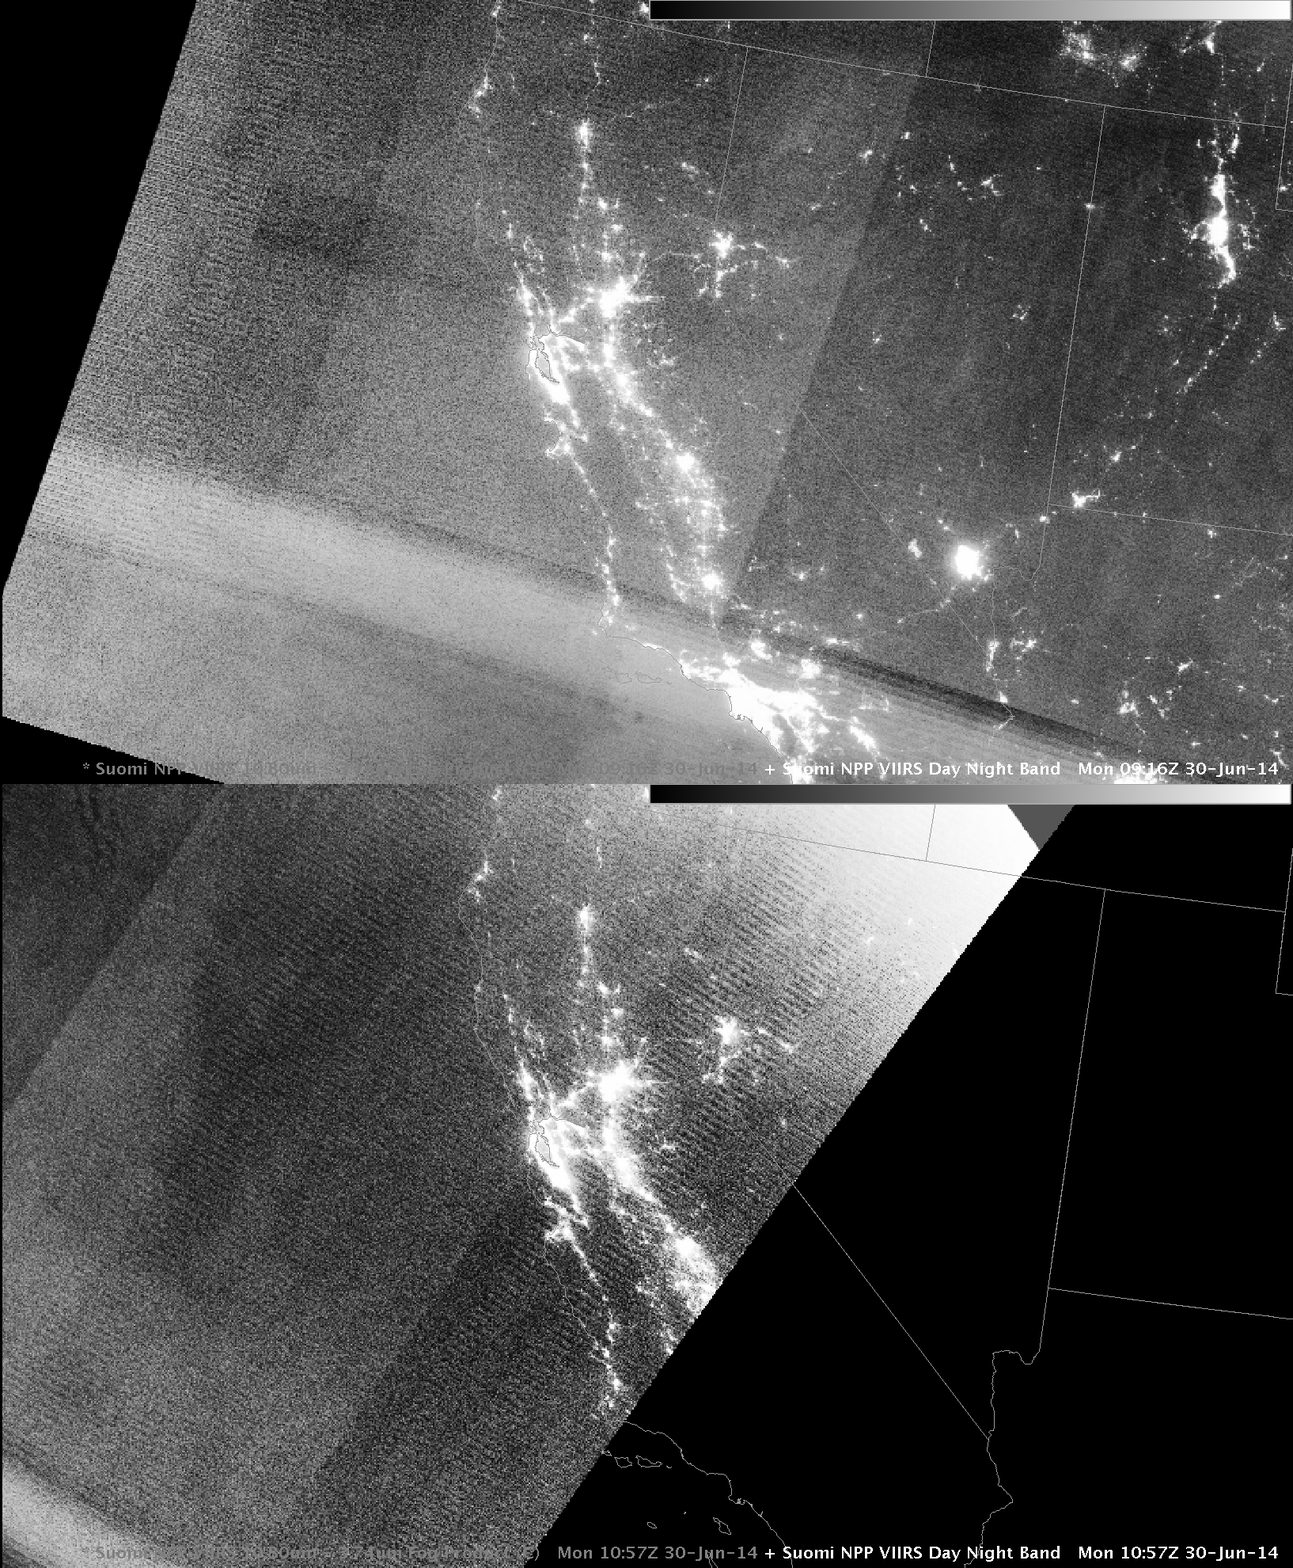
The Suomi/NPP Day/Night band can also provide imagery to help identify the tops of clouds. However, Day/Night Band imagery uses reflected moonlight. There was a new moon on June 27th, and that almost-new moon had set by the time of the images below. Thus, only Earthglow is illuminating any clouds that are present, and that feeble light is mostly overwhelmed by emitted city lights. It is therefore very difficult to identify any changes in cloudcover from the Day/Night band on this date.

CA_30June2014_DNB_0916_1057

Suomi/NPP Day/Night Band imagery at 0916 and 1057 UTC on 30 June 2014 (Click to enlarge)

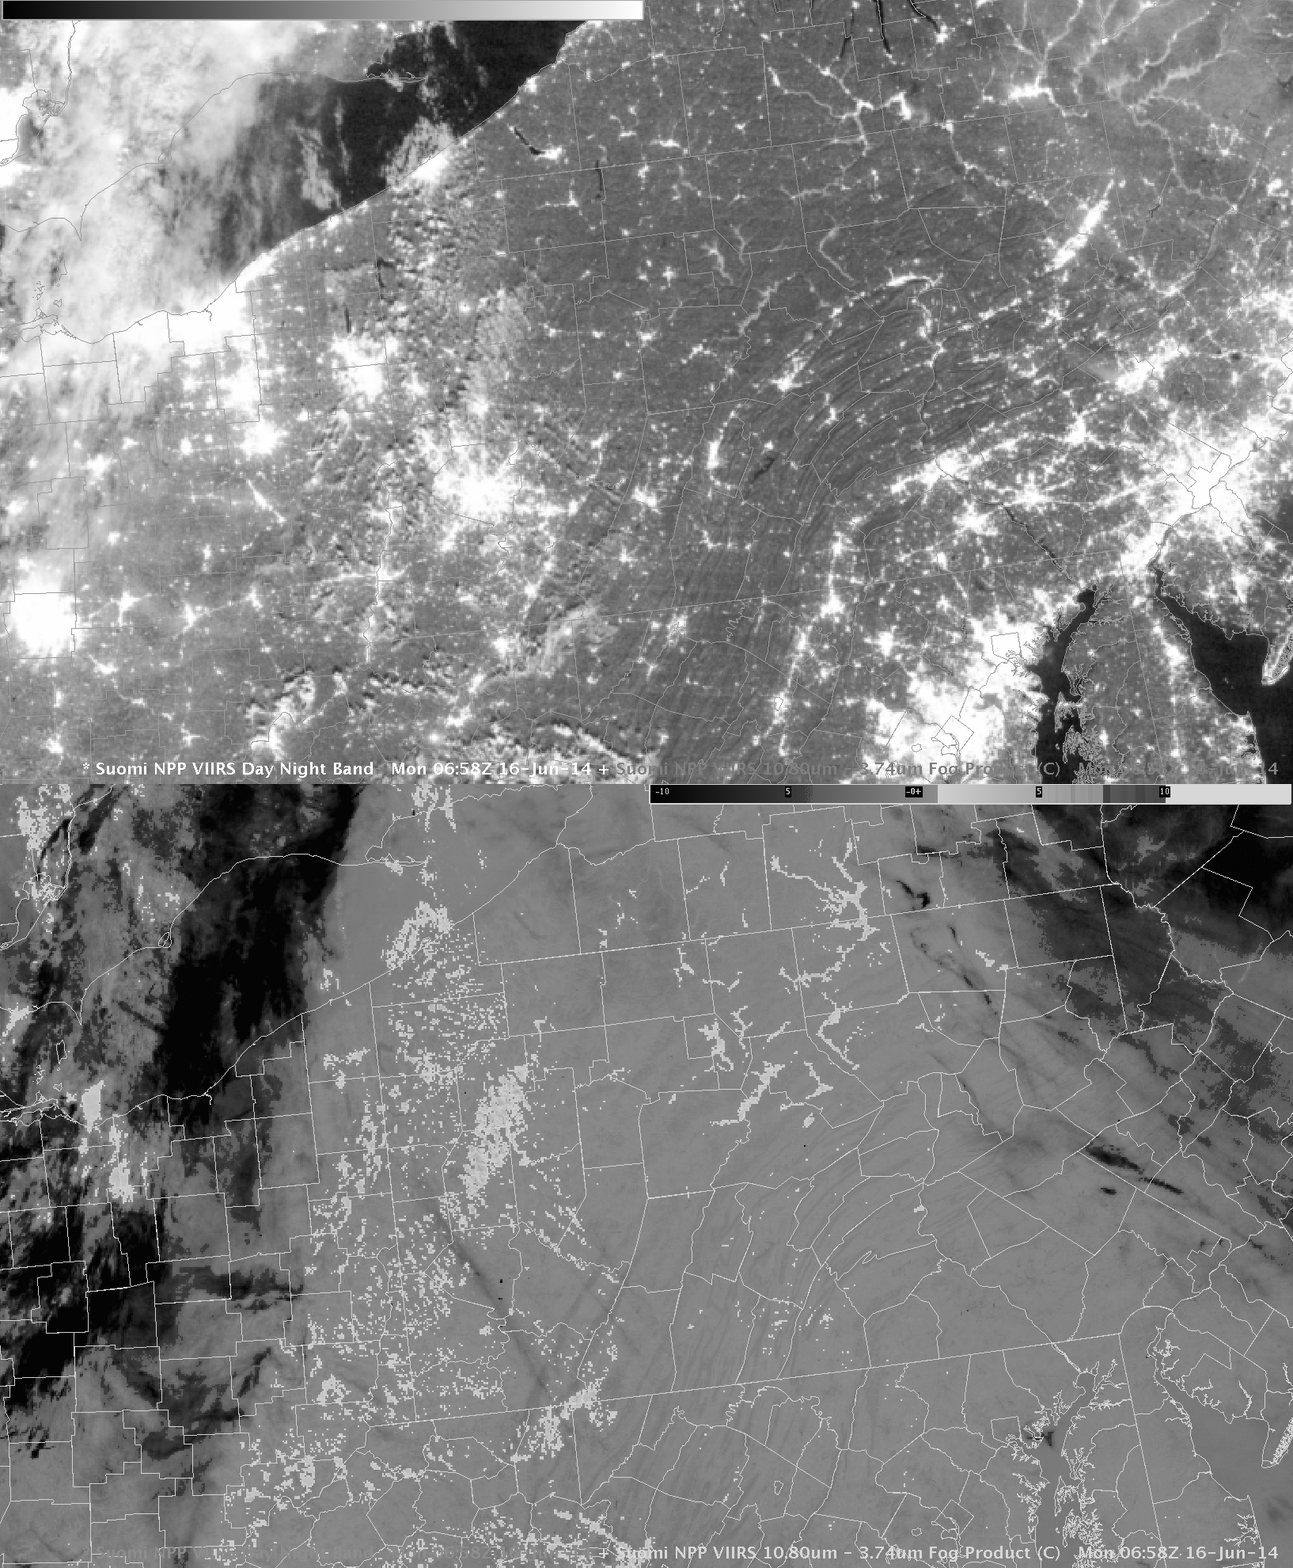
Fog in the Valleys of Pennsylvania and New York

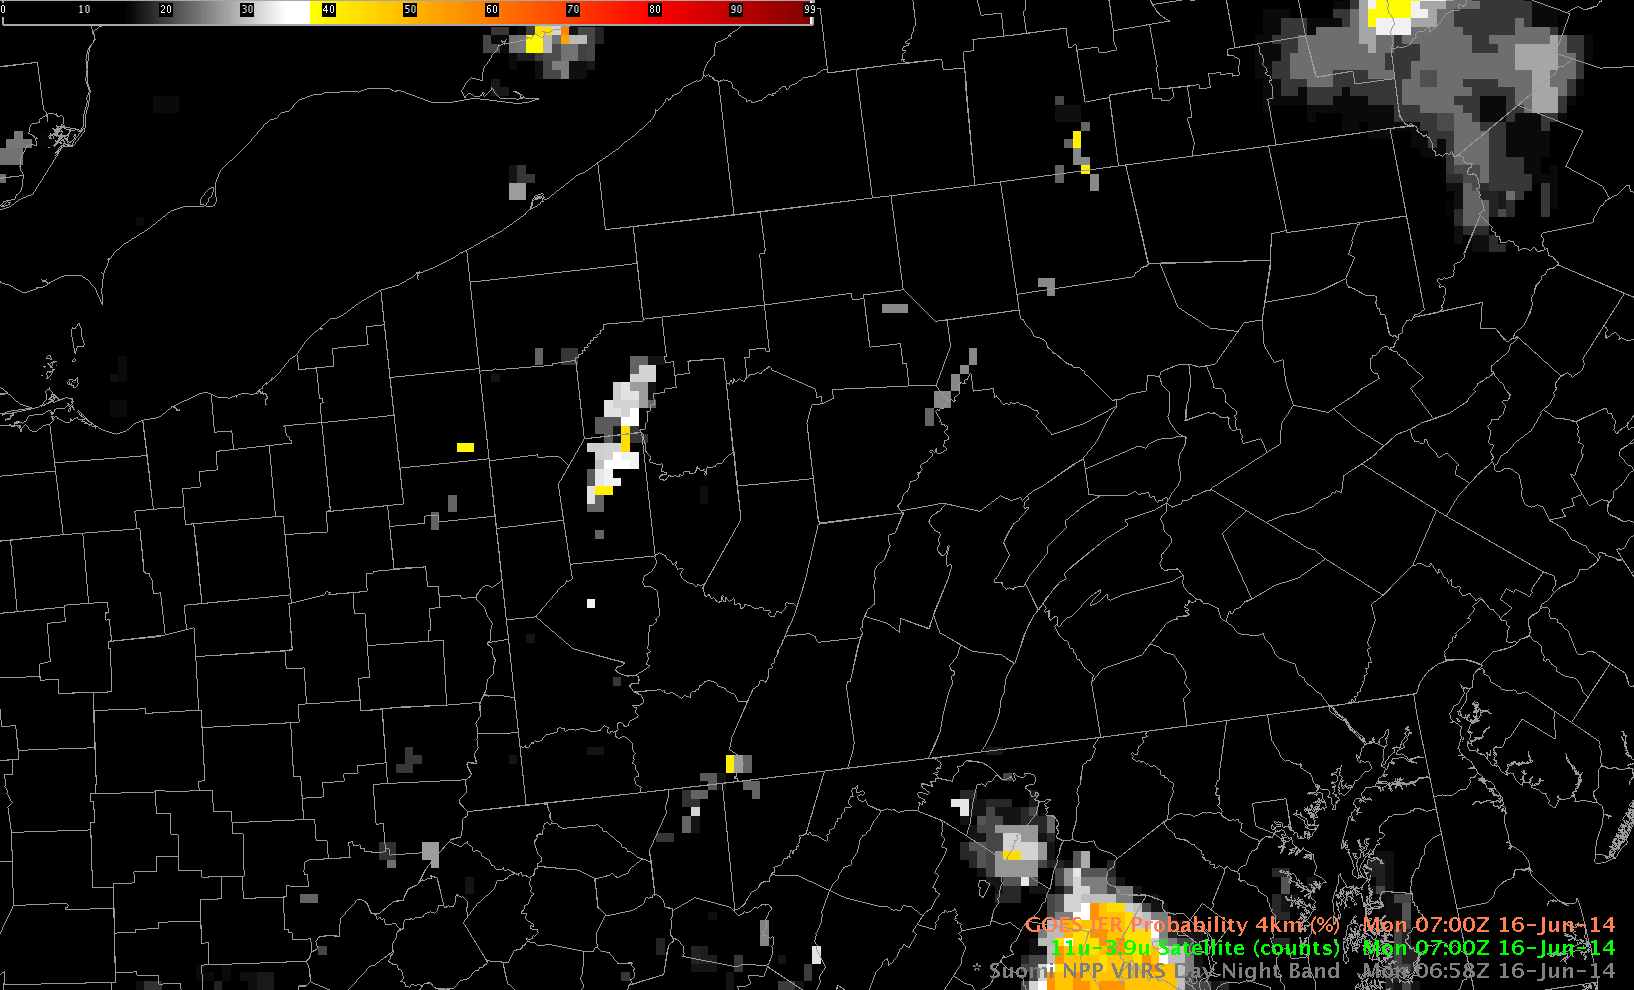
PA_SNPP_DNB_BTD_0658UTC_16June2014

Suomi/NPP Day/Night Band and Brightness Temperature Difference (11.35 – 3.74) at 0658 UTC on 16 June 2014 (Click to enlarge)

Suomi/NPP Day/Night band “Visible Imagery at Night” from last night at 3 AM EDT over Pennsylvania and surrounding states shows cloud formation in the river valleys of Pennsylvania and New York. The brightness temperature difference also shows these cloud formations, but note over eastern New York how high cirrus prevents the detection of low clouds in river valleys using the brightness temperature difference field, but the cirrus is thin enough that the Day/Night band does show the low clouds. The brightness temperature difference field can show where clouds are present in regions where city lights in the day/night band might appear similar to clouds on a night when lunar illumination is strong (as was the case on 16 June 2014) — for example, along US Highway 220 from Lock Haven to Jersey Shore and Williamsport in southern Clinton and Lycoming Counties.

Of course, the Suomi/NPP satellite is seeing the top of the cloud, so it can be difficult to infer ceiling and visibility obstructions from these data. The GOES-based IFR Probability field from about the same time, below, shows hints of visibility restrictions, but the coarser resolution of GOES-13 (compared to Suomi/NPP) limits the ability of GOES to herald the development of fog. In addition, the 13-km resolution of the Rapid Refresh model data that are also used in the GOES-R IFR Probability fields is insufficient to resolve the small river valleys (such as Pine Creek that shows up very well in the S/NPP imagery in western Lycoming County). Portions of the Susquehanna River basins do show marginally enhanced probabilities, certainly something that would alert a forecaster to the possibilities of fog.

PA_IFRProbGOES_0700UTC_16June2014

GOES-based IFR Probabilities, 0700 UTC on 16 June 2014 (Click to enlarge)

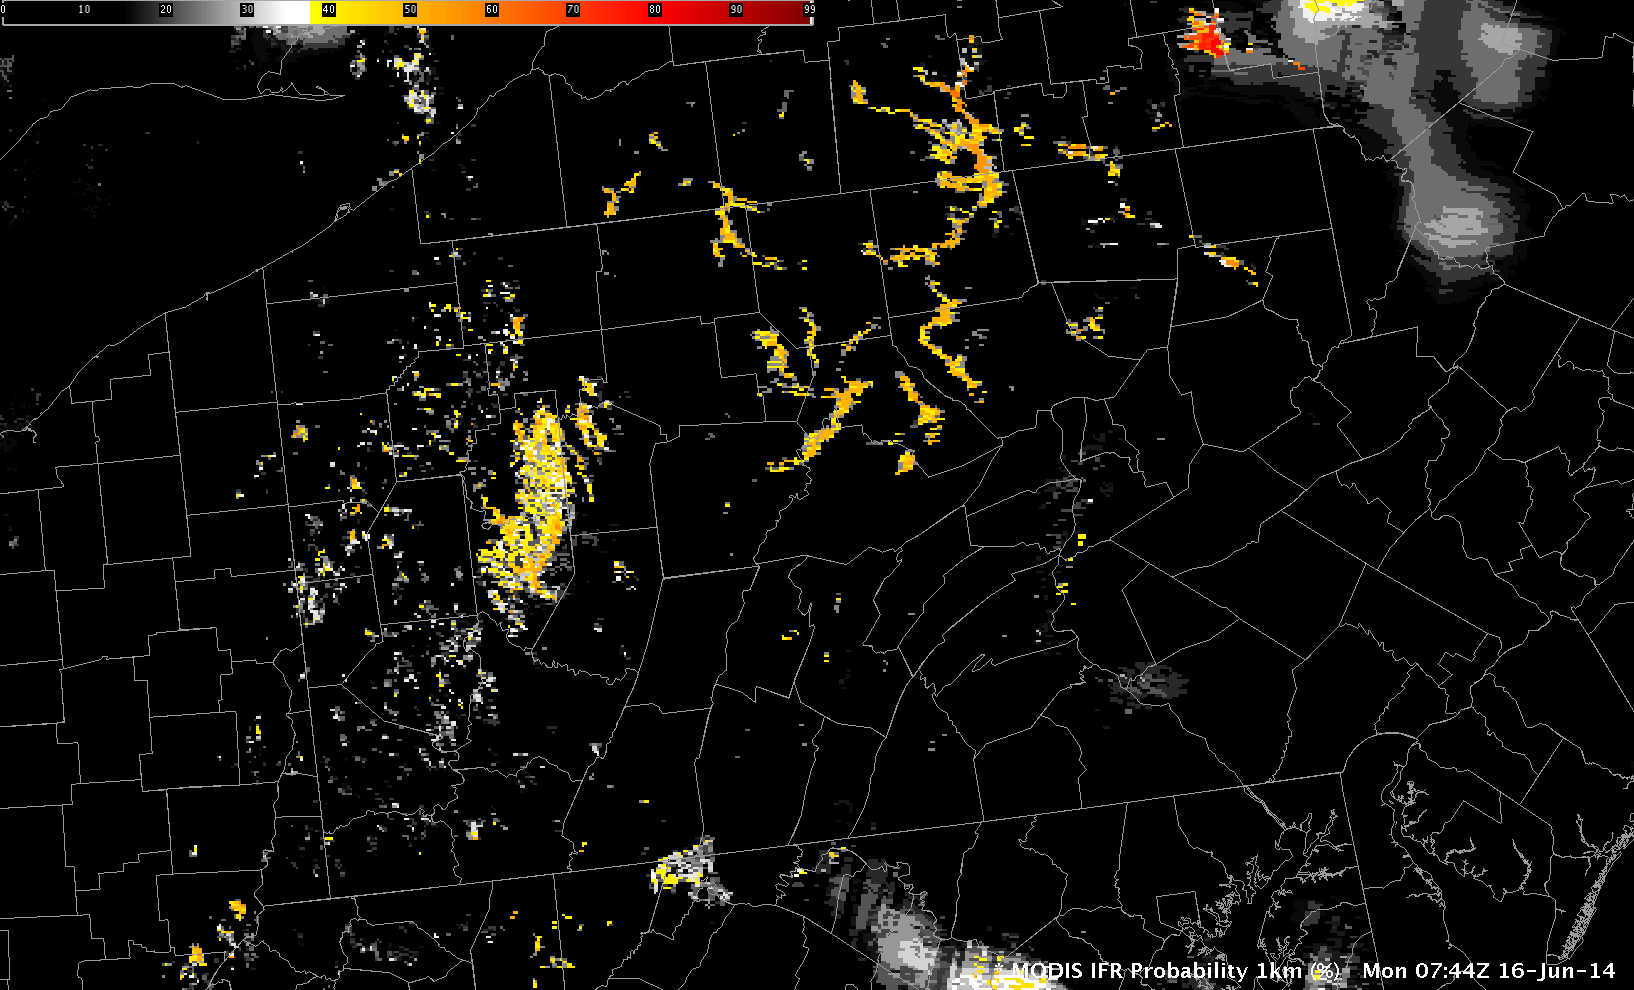
MODIS data can also be used to produce IFR Probabilities at infrequent intervals, but a timely overpass at 0744 UTC shows high probabilities in most of the river valleys of central Pennsylvania and upstate New York, with the highest probabilities near Elmira, NY.

MODIS_IFR_0744UTC_16June2014

MODIS-based IFR Probabilities, 0744 UTC on 16 June 2014 (Click to enlarge)

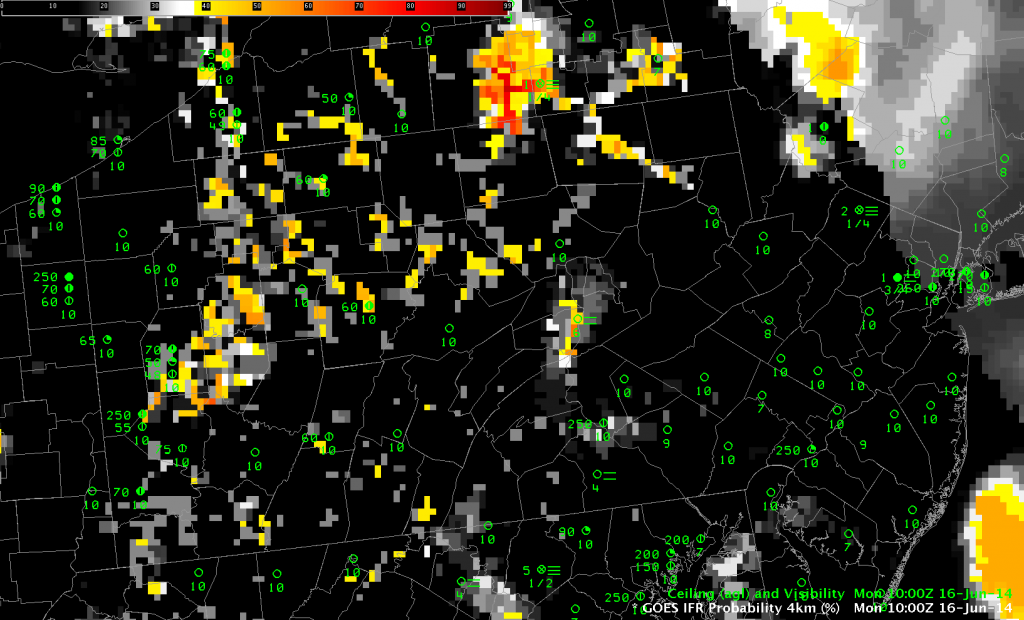
The GOES-R IFR Probabilities at 1000 UTC, below, show evidence that the fog/low stratus have become widespread enough in river valleys to be detected even by GOES. Elmira, NY, is reporting IFR conditions, and such conditions are also likely elsewhere in the valleys (although no observations are available to confirm that).

PA_IFRPROB_1000UTC_16June2014

GOES-based IFR Probabilities, 1000 UTC on 16 June 2014 (Click to enlarge)

Use timely polar-orbiting satellite data — with high resolution — to confirm suspicions of developing fog in river valleys. Then monitor the situation with the good temporal resolution of GOES. During the GOES-R era, geostationary satellite spatial resolution will be increased and fog detection from GOES-R should occur with better lead time.

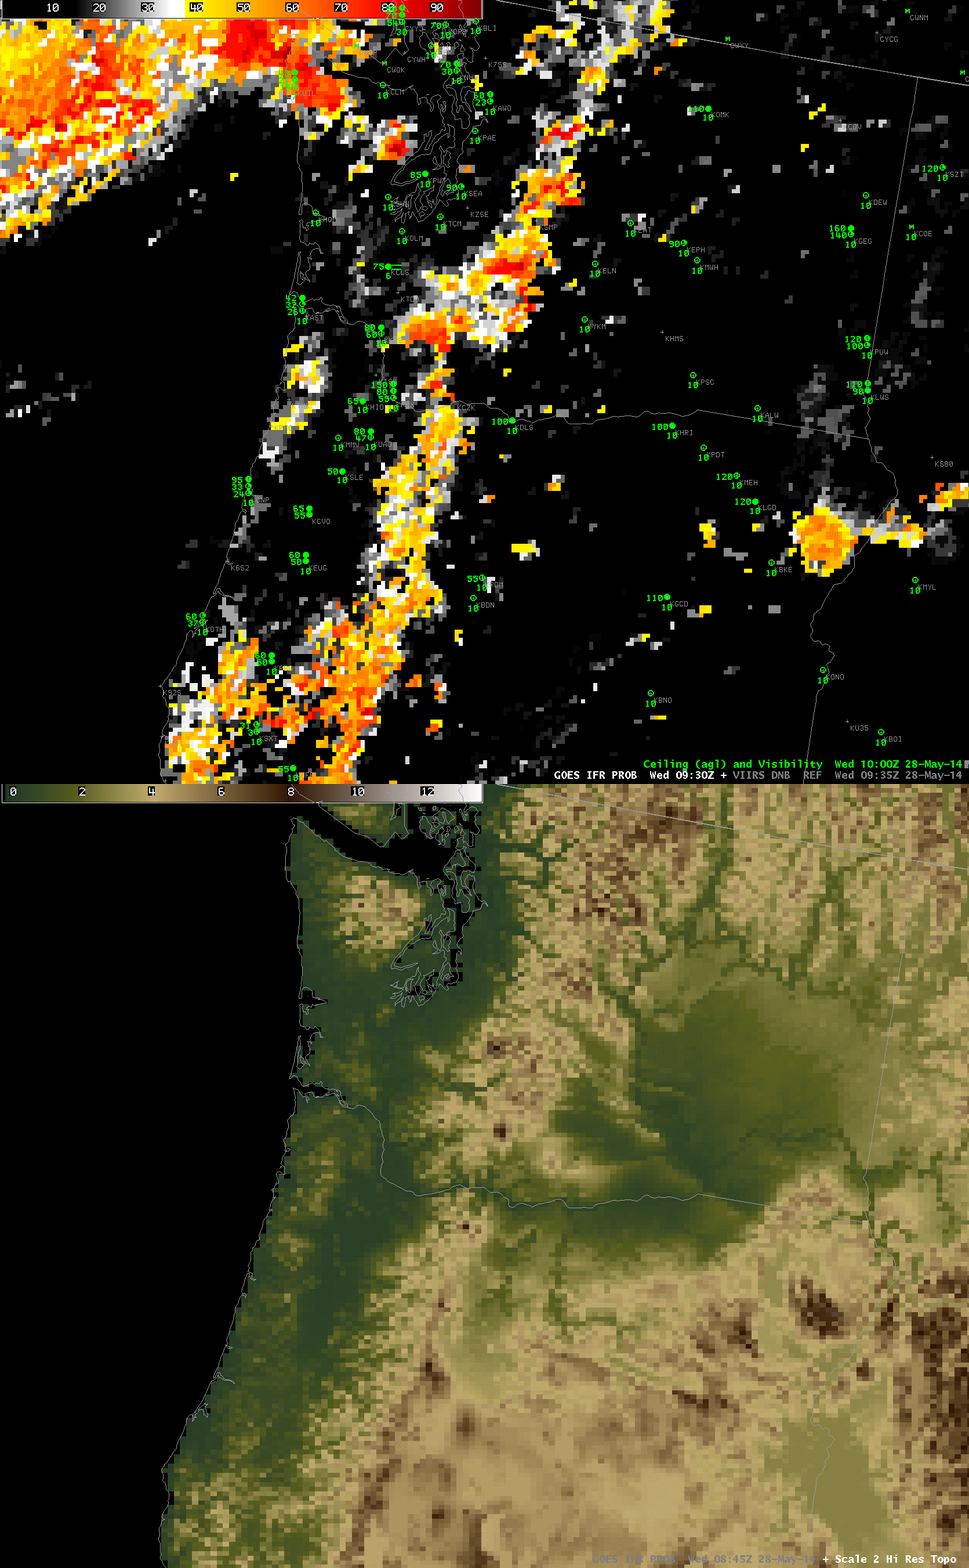
Terrain and IFR Probabilities

GOES_IFR_PROB_20140528_0930_terrain

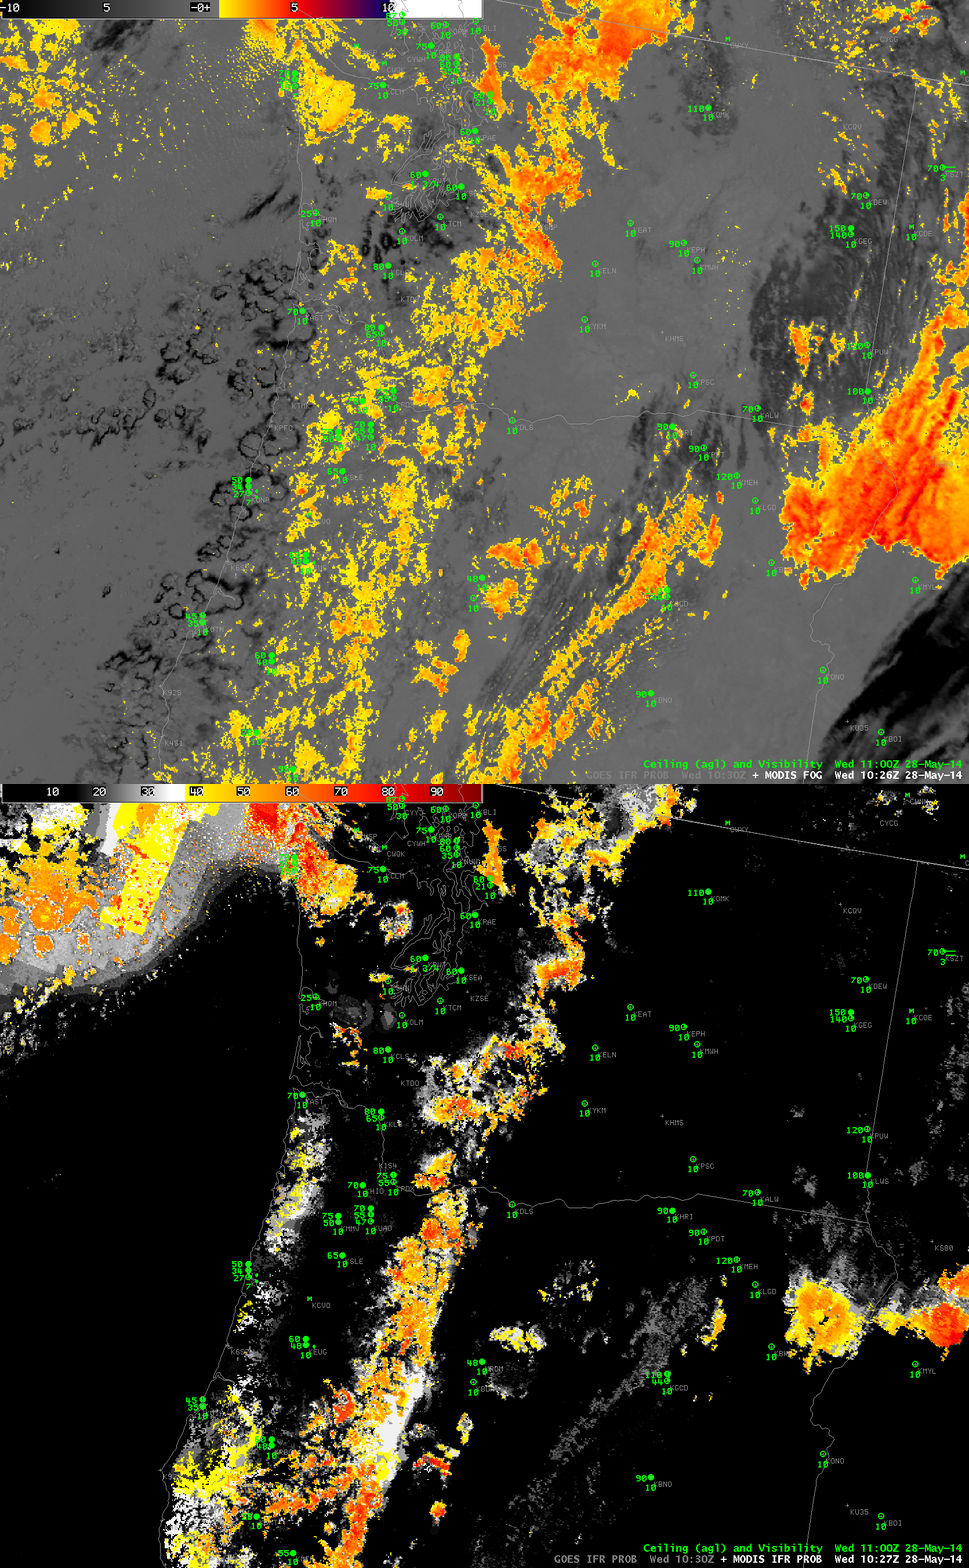
GOES-R IFR Probabilities computed from GOES-West at 0930 UTC on 28 May, and Color-enhanced terrain (Click image to enlarge)

When IFR Probabilities are enhanced over high terrain, how confident can you be that IFR conditions are occurring? Surface observations are rare on mountain tops. It’s possible that clouds occurring are at one level as the terrain rises up into the clouds, and ceilings at adjacent stations can give an indication of the cloud base (in the present case, ceilings are about 9000 feet above sea level at Seattle, for example).

Suomi/NPP Day/Night band imagery can verify that clouds exist in the region where IFR Probabilities are elevated. The toggle below, of Day/Night band and Brightness Temperature Differences, shows compelling evidence (even in low light conditions) of clouds along the spine of the mountains in central Washington and Oregon.

VIIRS_DNB_FOG_20140528_0935

Suomi/NPP VIIRS Day/Night Band and Brightness Temperature Difference (11.45 µm – 3.74 µm), 0935 UTC on 28 May (Click to enlarge)

High-resolution MODIS data are also used to produce IFR Probabilities, and they can be used to deduce the presence of low ceilings/reduced visibilities as well. The toggle below, from 1027 UTC, shows the brightness temperature difference field (11.0 – 3.9) from MODIS and the IFR Probability field. It is likely in this case that high clouds were shrouding the higher peaks of the Cascade Mountains.

MODIS_FOR_IFR_PROB_20140528_1027

Advection fog over Lake Michigan

GOES_IFR_PROB_20140429loop

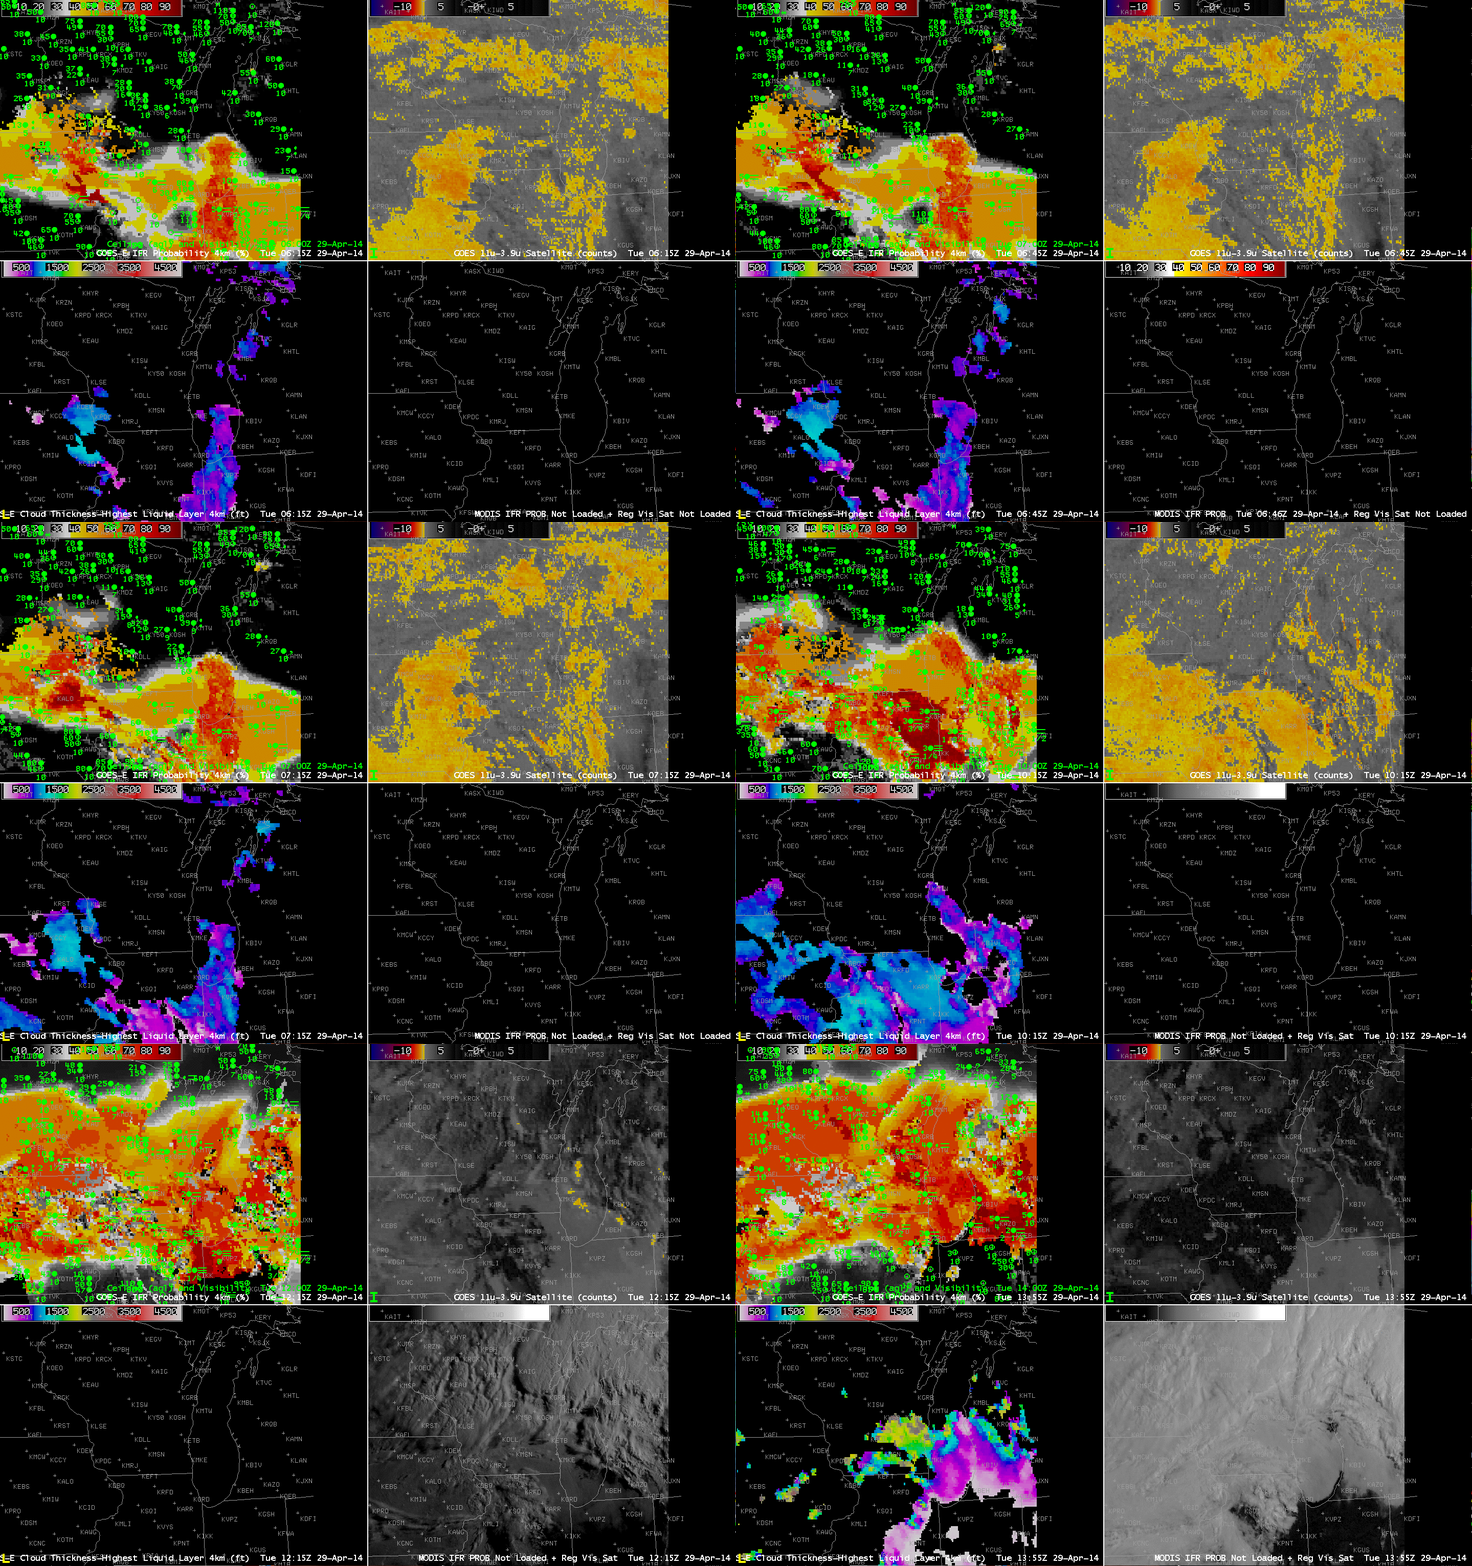
GOES-R IFR Probabilities computed from GOES-East (Upper Left), GOES-East Brightness Temperature Differences (10.7 µm – 3.9 µm) (Upper Right), GOES-R Cloud Thickness (Lower Left), GOES-R IFR Probabilities computed from MODIS, or GOES-East Visible Imagery, times as indicated on 29 April 2014 (click to enlarge)

The GOES-R IFR Probability fields computed from GOES-East captured the onset of Lake fog that moved onshore over eastern Wisconsin on April 29th. Multiple cloud layers associated with a strong extratropical cyclone precluded the use of the brightness temperature difference product (the heritage method of detecting fog/low stratus). However, the IFR Probability field aligns well with the reductions in visibility associated with the Lake fog. The character of the IFR Probability field can be used to infer whether of not satellite data predictors are being used. For example, the relatively flat field over southeast Wisconsin at the start of the animation is a region where satellite predictors are not used. The use of satellite predictors generally leads to a pixelated field. A flatter field as over southeast Wisconsin reflects the smoother model fields that are driving the probability field computation.

Cloud thickness is computed in regions where the highest cloud, as seen by the satellite, is a water-based cloud. And that is also usually the region where satellite predictors are used in the computation of IFR Probabilities. Note in the animation above how cloud thickness generally overlays regions of IFR Probability that are pixelated. Cloud thickness is not computed where only model data are used to compute IFR Probabilities. (Cloud thickness is also not computed in the hour or so around sunrise and sunset, during twilight conditions).

The slow northward movement of the fog bank is apparent in the first part of the animation above, from 0615 through 0745 UTC. Note also how the MODIS IFR Probability fields give a very similar solution to the GOES-13-based fields at 0745 UTC. Differences in resolution are apparent over southwest Wisconsin, however, where river valleys are more accurately captured by the MODIS fields.

In the visible imagery at the end of the animation (1355 UTC), the rapid saturation of moisture-laden air moving northward from Indiana over the cold waters of southern Lake Michigan is very apparent.

Fog/Low Stratus and Stratus behind a late-season Snow Storm

A late-season snowstorm moved through the upper midwest on the 16th/17th of April, dropping up to 18″ of snow over northern Minnesota and northern Wisconsin. The storm and its aftermath produced IFR conditions; how did the GOES-R IFR Probability field do?

MODIS_FOG_IFR_PROB_20140417_0442

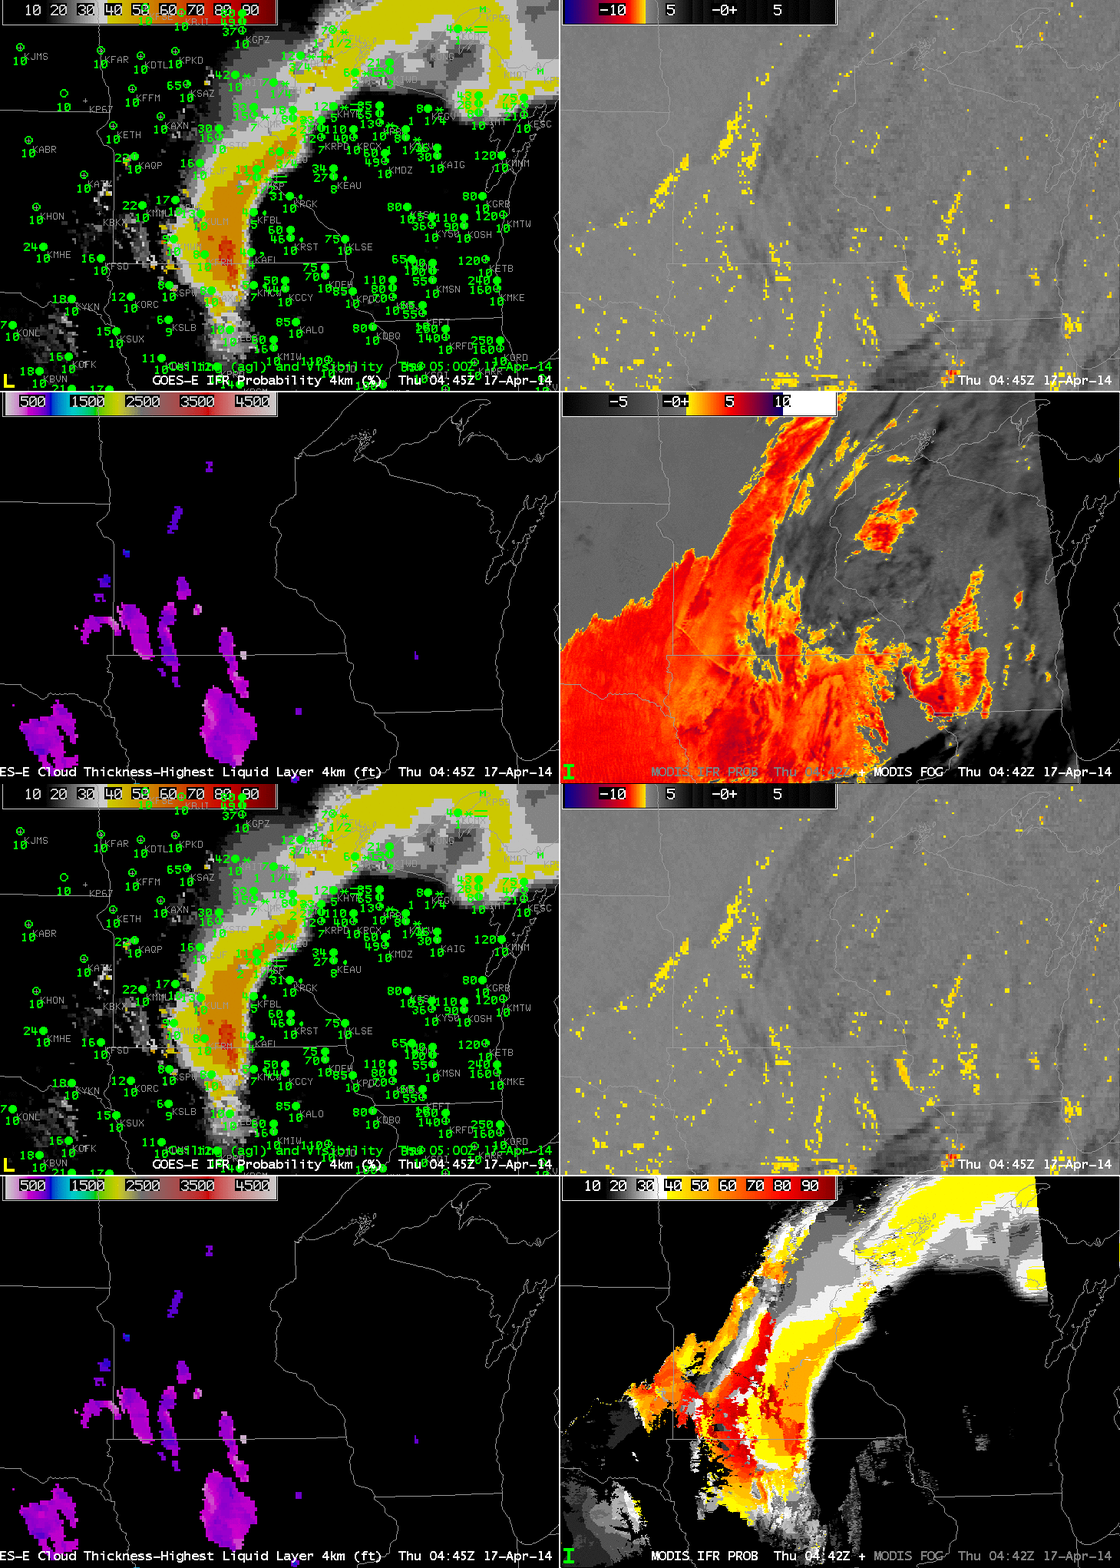
GOES-R IFR Probabilities computed from GOES-East (Upper Left), GOES-East Brightness Temperature Differences (10.7 µm – 3.9 µm) (Upper Right), GOES-R Cloud Thickness (Lower Left), Toggle between GOES-R IFR Probabilities computed from MODIS and MODIS Brightness Temperature Difference Fields (Lower Right), times as indicated (click to enlarge)

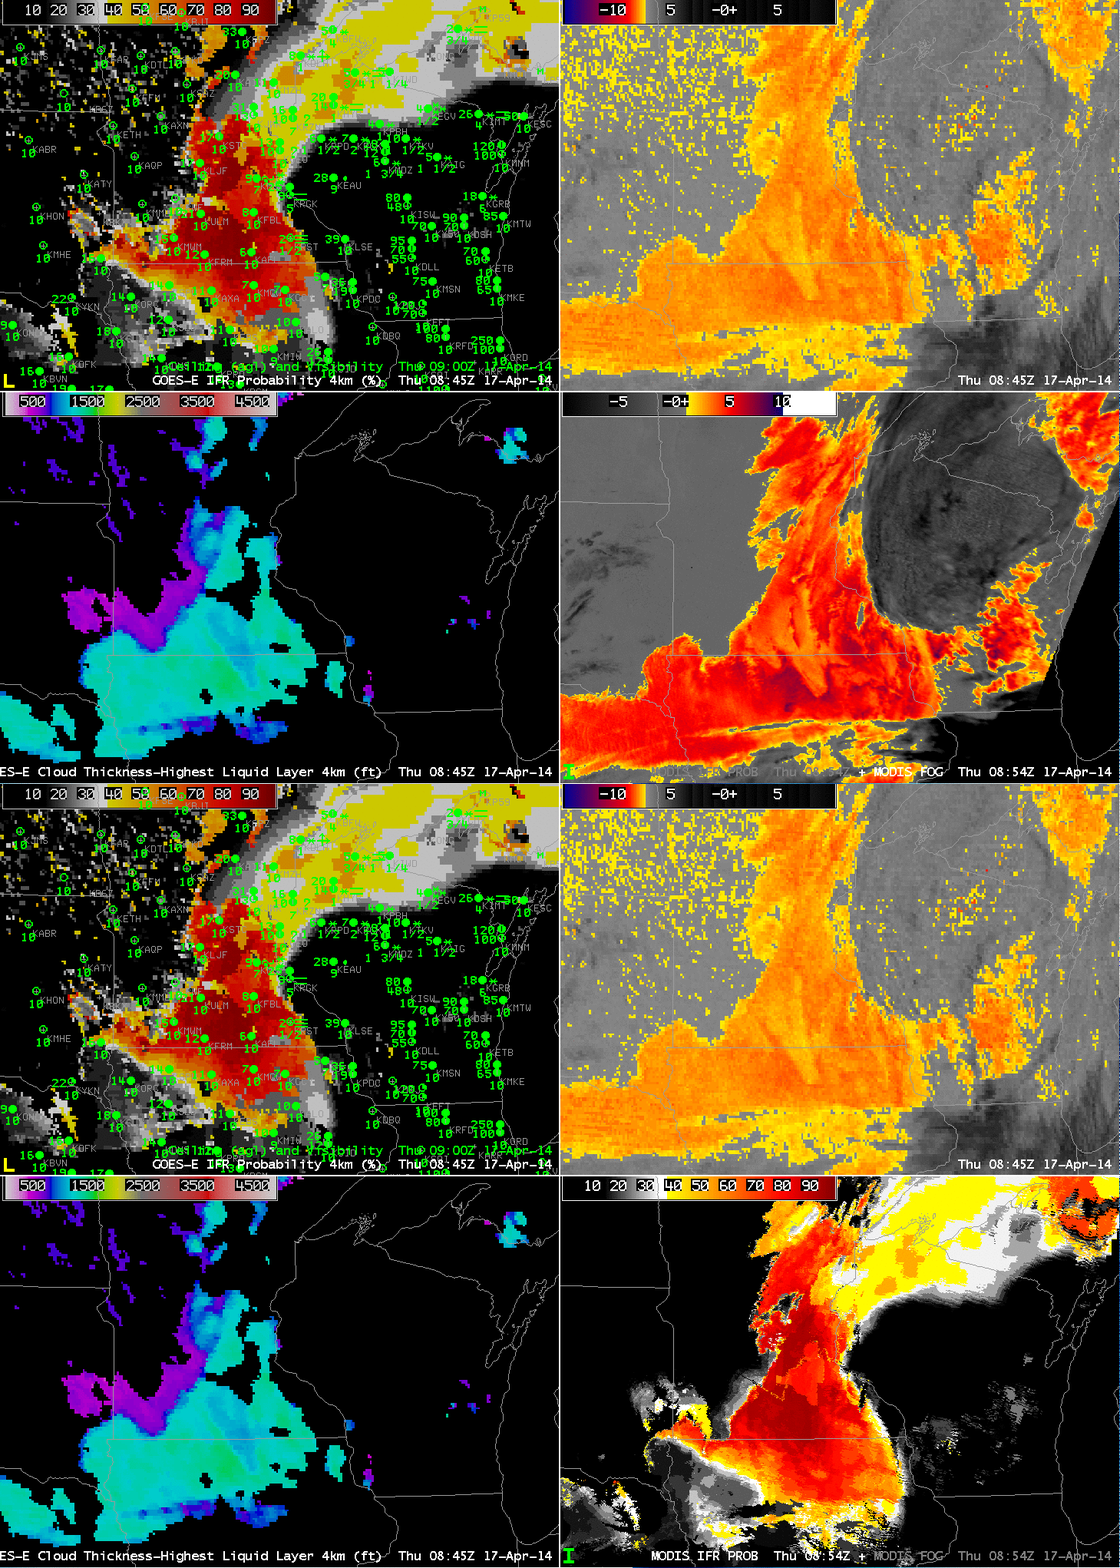
The toggle above shows data from ~0445 UTC on 17 April. The MODIS Brightness Temperature Difference field suggests stratus over a large region where IFR conditions are not observed; the IFR Probability fields better approximate the regions of low ceilings/reduced visibilities. The inclusion of Rapid Refresh model data better defines regions of low-level saturation so that the IFR Probability Fields (compared to the brightness temperature difference fields) are better aligned with low ceilings/reduced visibilities. Imagery at ~0900 UTC, below, shows an expansion of the IFR conditions over southern Minnesota as the storm moves away. Note also how IFR Probabiilties are enhanced over northern Wisconsin, where multiple cloud layers make the traditional fog/low cloud detection mechanism, the brightness temperature difference field, difficult. Probabilities are smaller there because the satellite predictors cannot be used in the algorithm that computes IFR Probabilities, and the variability of the values is less, reflecting the smoother fields present in the model (compared to the pixels of the satellite data).

MODIS_FOG_IFR_PROB_20140417_0854

GOES-R IFR Probabilities computed from GOES-East (Upper Left), GOES-East Brightness Temperature Differences (10.7 µm – 3.9 µm) (Upper Right), GOES-R Cloud Thickness (Lower Left), Toggle between GOES-R IFR Probabilities computed from MODIS and MODIS Brightness Temperature Difference Fields (Lower Right), times as indicated (click to enlarge)

Stratus vs. Fog in the upper Midwest

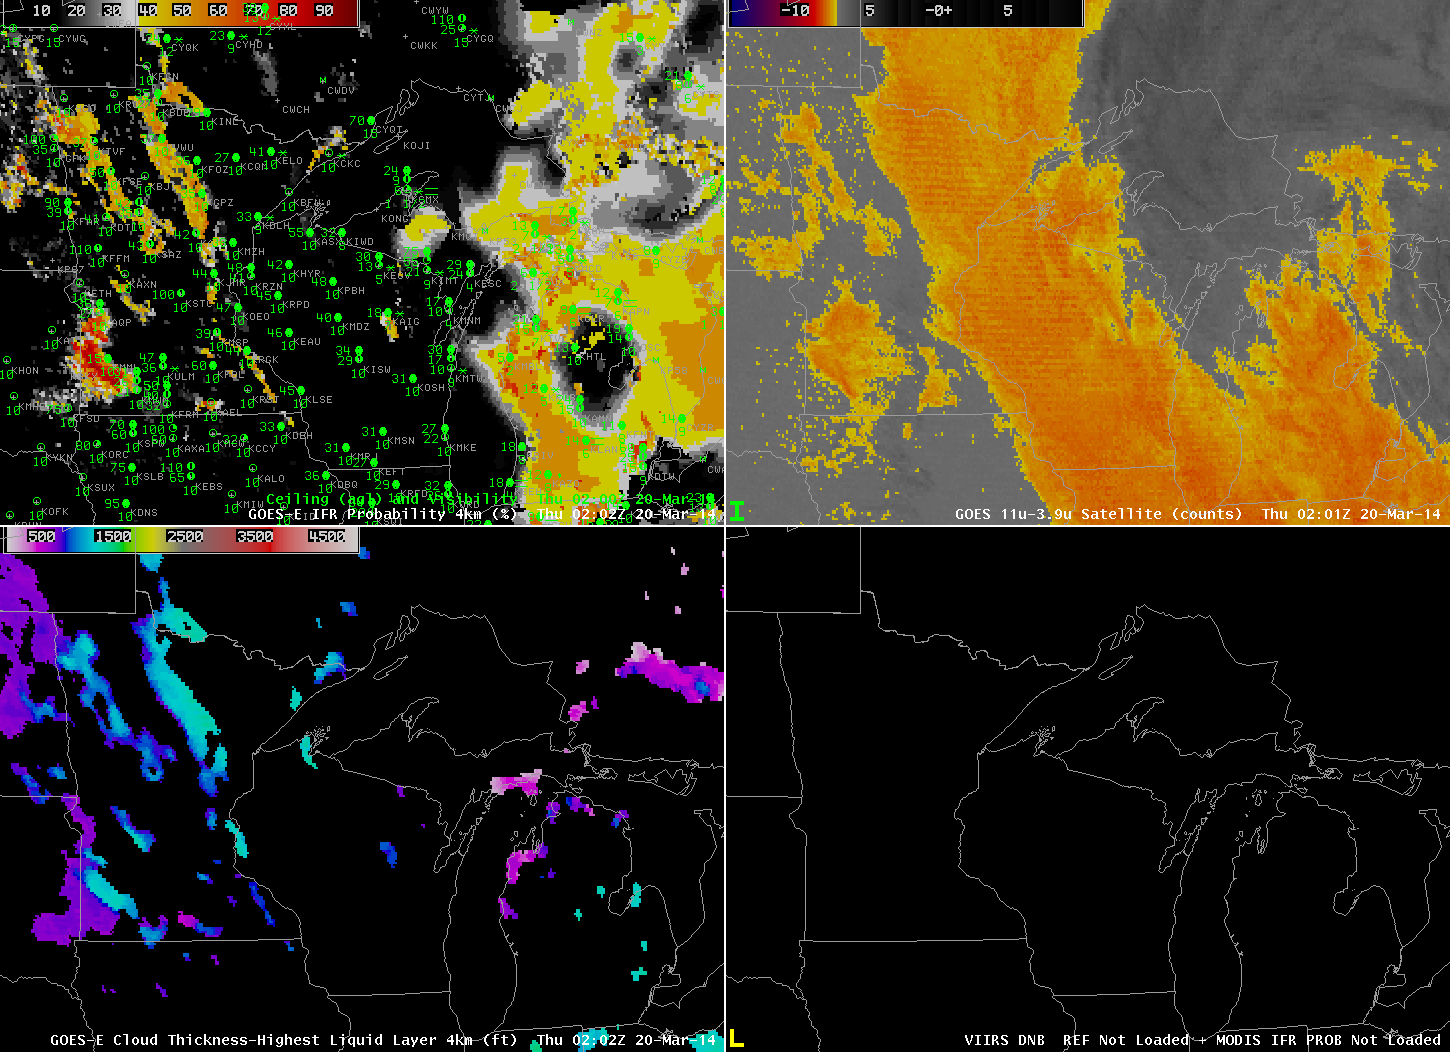
GOES_IFR_PROB_20140320_0202

GOES-R IFR Probabilities computed from GOES-13 (Upper Left), GOES-East Brightness Temperature Differences (10.7 µm – 3.9 µm) (Upper Right), GOES-R Cloud Thickness (Lower Left), Suomi-NPP Brightness Temperature (Lower Right), all near 0200 UTC on 20 March 2014 (click to enlarge)

Low clouds lingered over the upper midwest behind a departing low pressure system late on Wednesday the 19th. A strong signal was evident in the brightness temperature difference field from GOES-East, above, from 0200 UTC, extending northwest to southeast over eastern Minnesota into northern Indiana. Note, however, that ceilings in this region were indicative of mid-level stratus rather than fog. IFR Probabilities are correctly very small underneath this stratus.

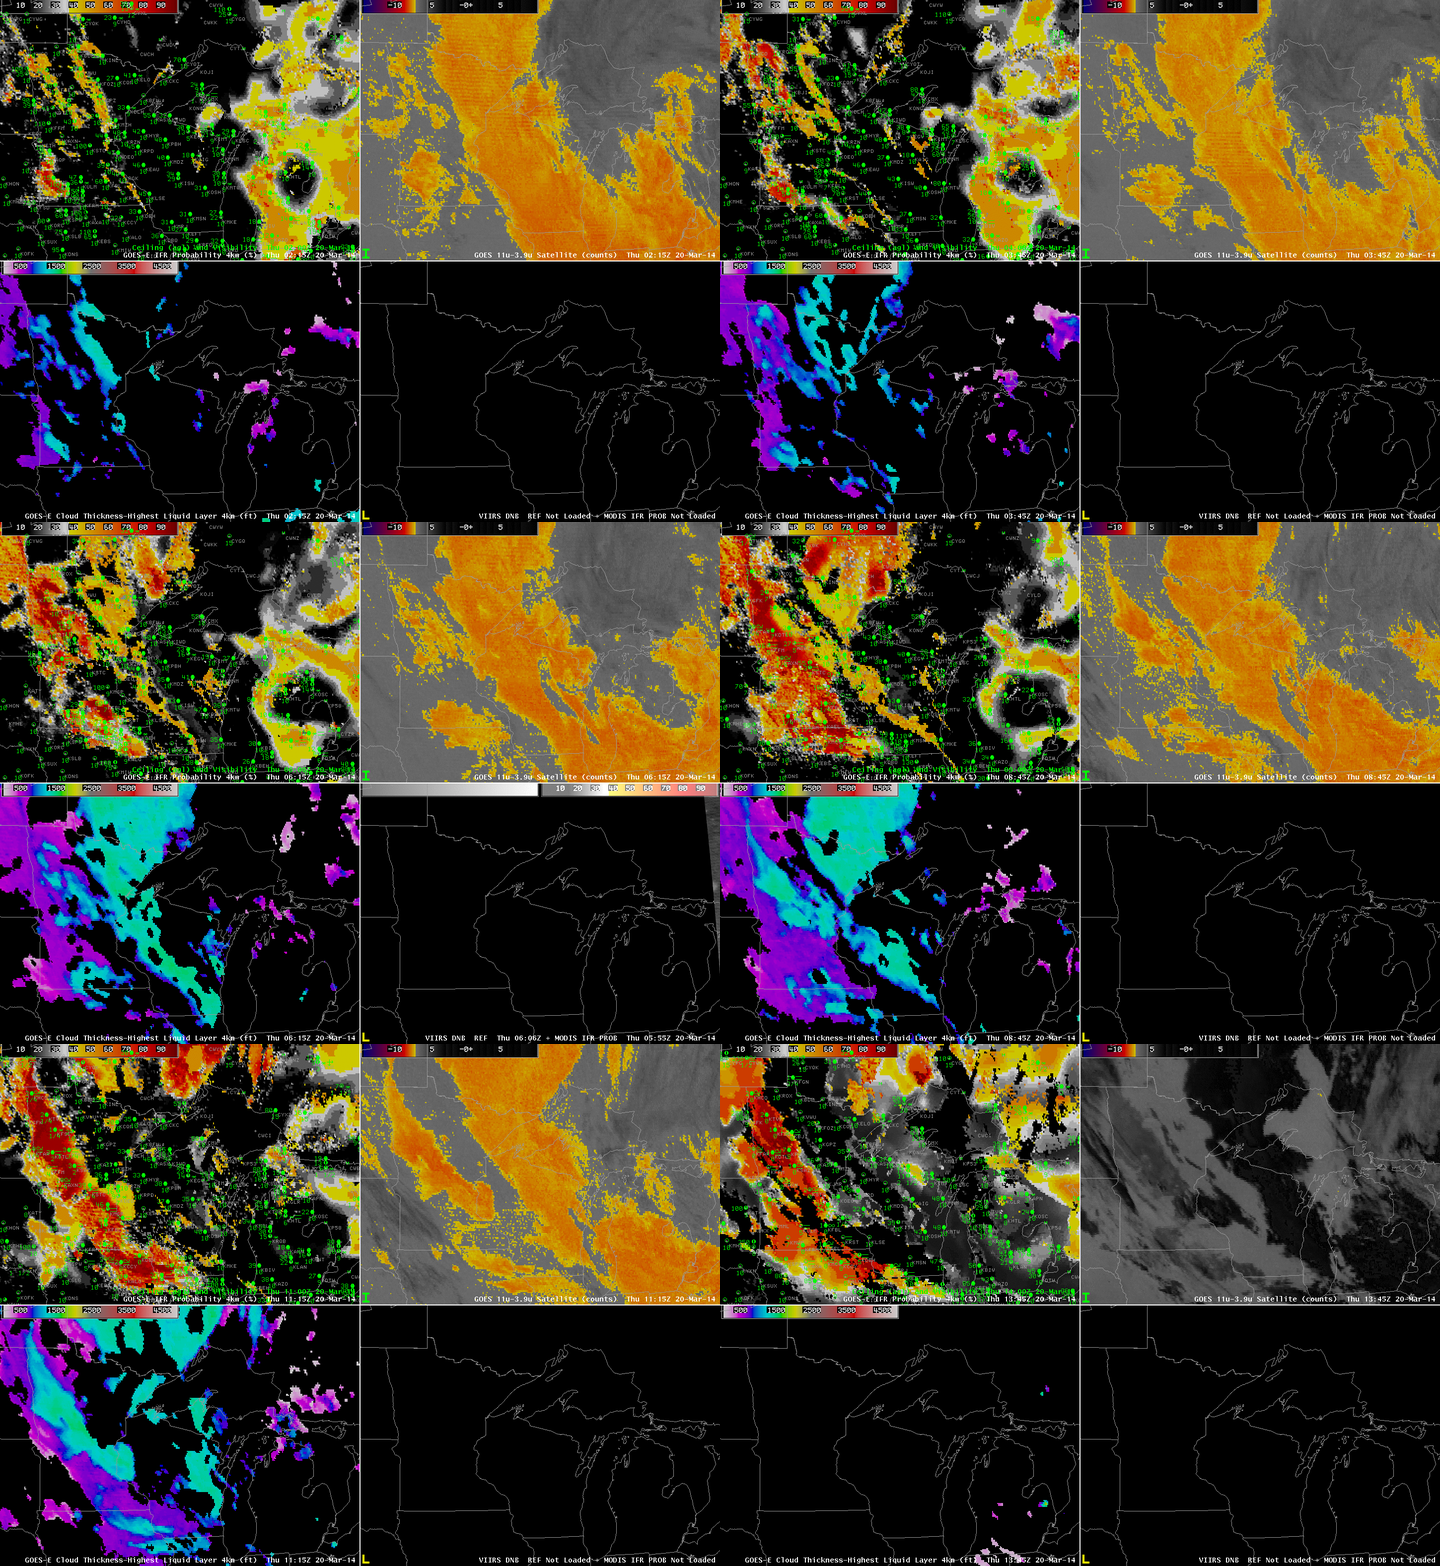
GOES_IFR_PROB_20140320loop

GOES-R IFR Probabilities computed from GOES-13 (Upper Left), GOES-East Brightness Temperature Differences (10.7 µm – 3.9 µm) (Upper Right), GOES-R Cloud Thickness (Lower Left), MODIS-based IFR Probabilities and Suomi-NPP Day/Night Band (Lower Right), times as indicated (click to enlarge)

An animation of the fields, above, shows the development of a low IFR conditions over western Minnesota. The brightness temperature difference fields also show their development, and the combination of satellite predictors and model predictors lead to very high IFR Probabilities in that region, both in the GOES-based fields, shown half-hourly, and in the MODIS-based fields, shown when available.

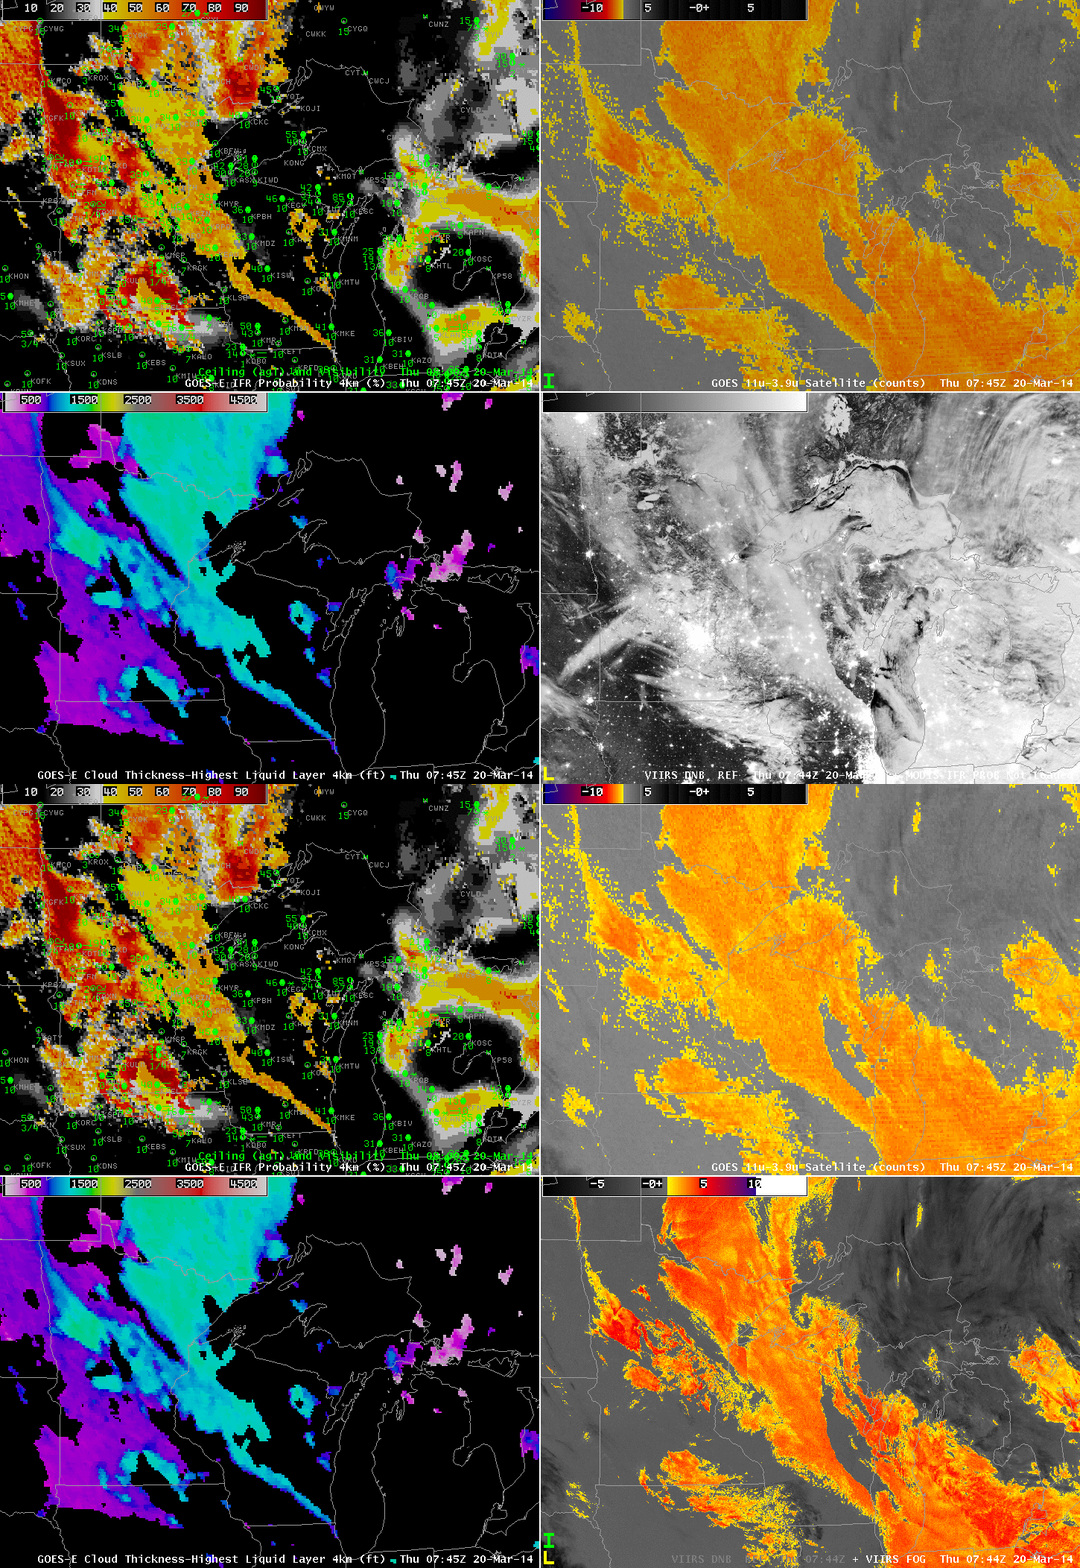
GOESVIIRS_FOG_20140320_0745

Suomi/NPP Day/Night band and brightness temperature difference field, 0744 UTC on 20 March 2014 (click to enlarge)

The near-full Moon provided ample illumination for the clouds, and the day/night band reveals the extensive cloud cover over the upper midwest, but as it only shows the top of the clouds, it is difficult to determine if visibility restrictions are also present. The Brightness temperature difference produce is also shown, which field is helpful in screening out snow cover and city lights.

Fog over northeast Florida and coastal Georgia and South Carolina

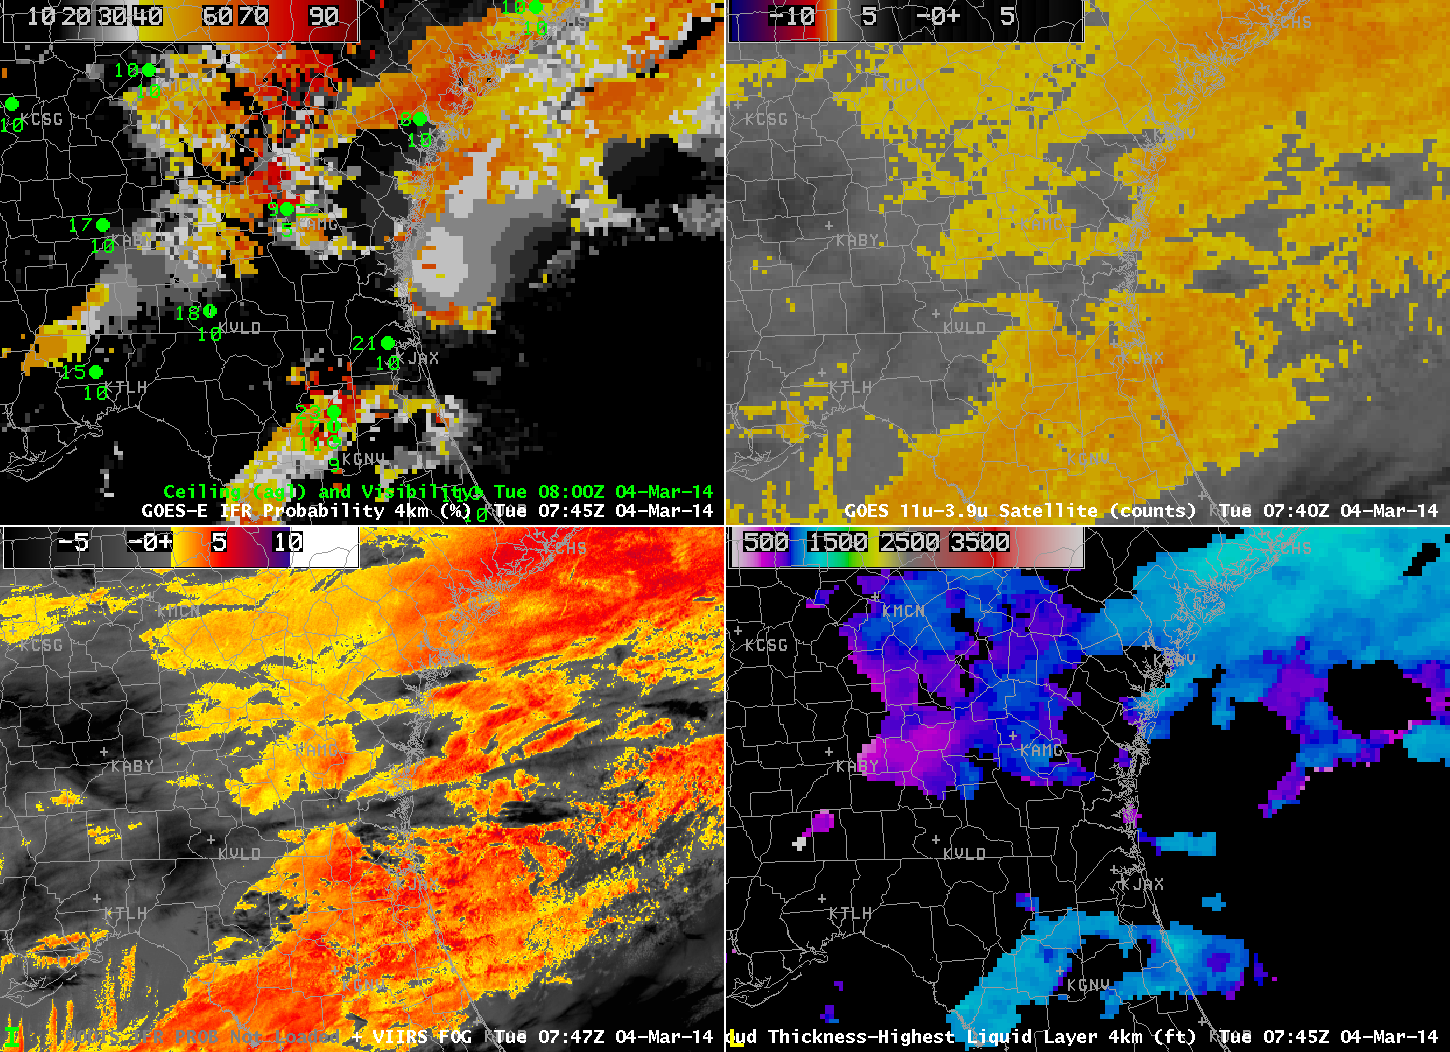
GOES_IFR_PROB_20140304loop

GOES-R IFR Probabilities computed from GOES-13 (Upper left); GOES-East Brightness Temperature Differences (10.7 µm – 3.9 µm) (Upper Right); MODIS-based IFR Probabilities or VIIRS-based Brightness Temperature Difference (11.35 µm – 3.74 µm) (Lower Left); GOES-R Cloud Thickness computed from GOES-East (Lower Right) (click to play animation)

Cold air has swept down the east coast into northern Florida, and the leading edge of that cold air, marked by a shift to northeasterly winds and low clouds, shows up well in the GOES-R IFR Probability fields, displayed above, because the airmass with the northeasterly winds also included low clouds/fog. Note in the animation how IFR conditions develop in Jacksonville as the higher IFR probabilities slide southward. Similarly, IFR conditions diminish over Savannah as IFR Probabilities drop.

This is a case for which the heritage method of detecting fog had difficulties because multiple cloud layers existed. For example, a stratus deck over central Florida shows up very well in the brightness temperature difference field from both GOES and VIIRS, but IFR conditions are not initially seen there (and GOES-R IFR Probabilities are small). The GOES-R Cloud Thickness is not computed in regions with multiple cloud layers, typically, because it shows the thickness of the highest water-based cloud layer. If any overlaying cloud layer at high levels contains ice, the field is not computed.

Sea fog over the western Gulf of Mexico

The National Weather Service in Houston/Galveston has issued Dense Fog advisories for Sea Fog in the easterly flow south of a cold front draped across the northern Gulf:

MARINE WEATHER STATEMENT
NATIONAL WEATHER SERVICE HOUSTON/GALVESTON TX
602 PM CST SUN FEB 23 2014

GMZ330-335-350-355-370-375-260000-
MATAGORDA BAY-GALVESTON BAY-
WATERS FROM FREEPORT TO THE MATAGORDA SHIP CHANNEL OUT 20 NM-
WATERS FROM HIGH ISLAND TO FREEPORT OUT 20 NM-
WATERS FROM FREEPORT TO THE MATAGORDA SHIP CHANNEL 20 NM TO 60 NM-
WATERS FROM HIGH ISLAND TO FREEPORT 20 TO 60 NM-
602 PM CST SUN FEB 23 2014

…DENSE SEA FOG POSSIBLE ACROSS THE AREA FOR THE NEXT SEVERAL DAYS…

AREAS OF SEA FOG…SOME DENSE WITH VISIBILITIES OF 1 NM OR LESS…WILL
CONTINUE TO BE POSSIBLE IN AND AROUND THE GALVESTON AND MATAGORDA BAY
AREAS ALONG WITH THE UPPER TEXAS COASTAL WATERS OUT TO APPROXIMATELY
20 NM. DENSE FOG ADVISORIES MIGHT BE NEEDED.

LITTLE CHANGE IN THIS PATTERN IS EXPECTED UNTIL THE PASSAGE OF THE NEXT
COLD FRONT SOME TIME AROUND LATE TUESDAY NIGHT OR EARLY WEDNESDAY
MORNING.

MARINERS SHOULD BE PREPARED FOR SUDDEN CHANGES IN VISIBILITY OVER SHORT
DISTANCES. REDUCE YOUR SPEED AND KEEP A LOOKOUT FOR OTHER VESSELS…BUOYS
AND BREAKWATERS. KEEP YOUR NAVIGATION LIGHTS ON. INEXPERIENCED MARINERS…
ESPECIALLY THOSE OPERATING SMALLER CRAFT OR NOT EQUIPPED WITH RADAR…SHOULD
CONSIDER SEEKING SAFE HARBOR.

$$

How does the GOES-R IFR Probability field handle this event?

GOES_IFR_PROB_20140224loop

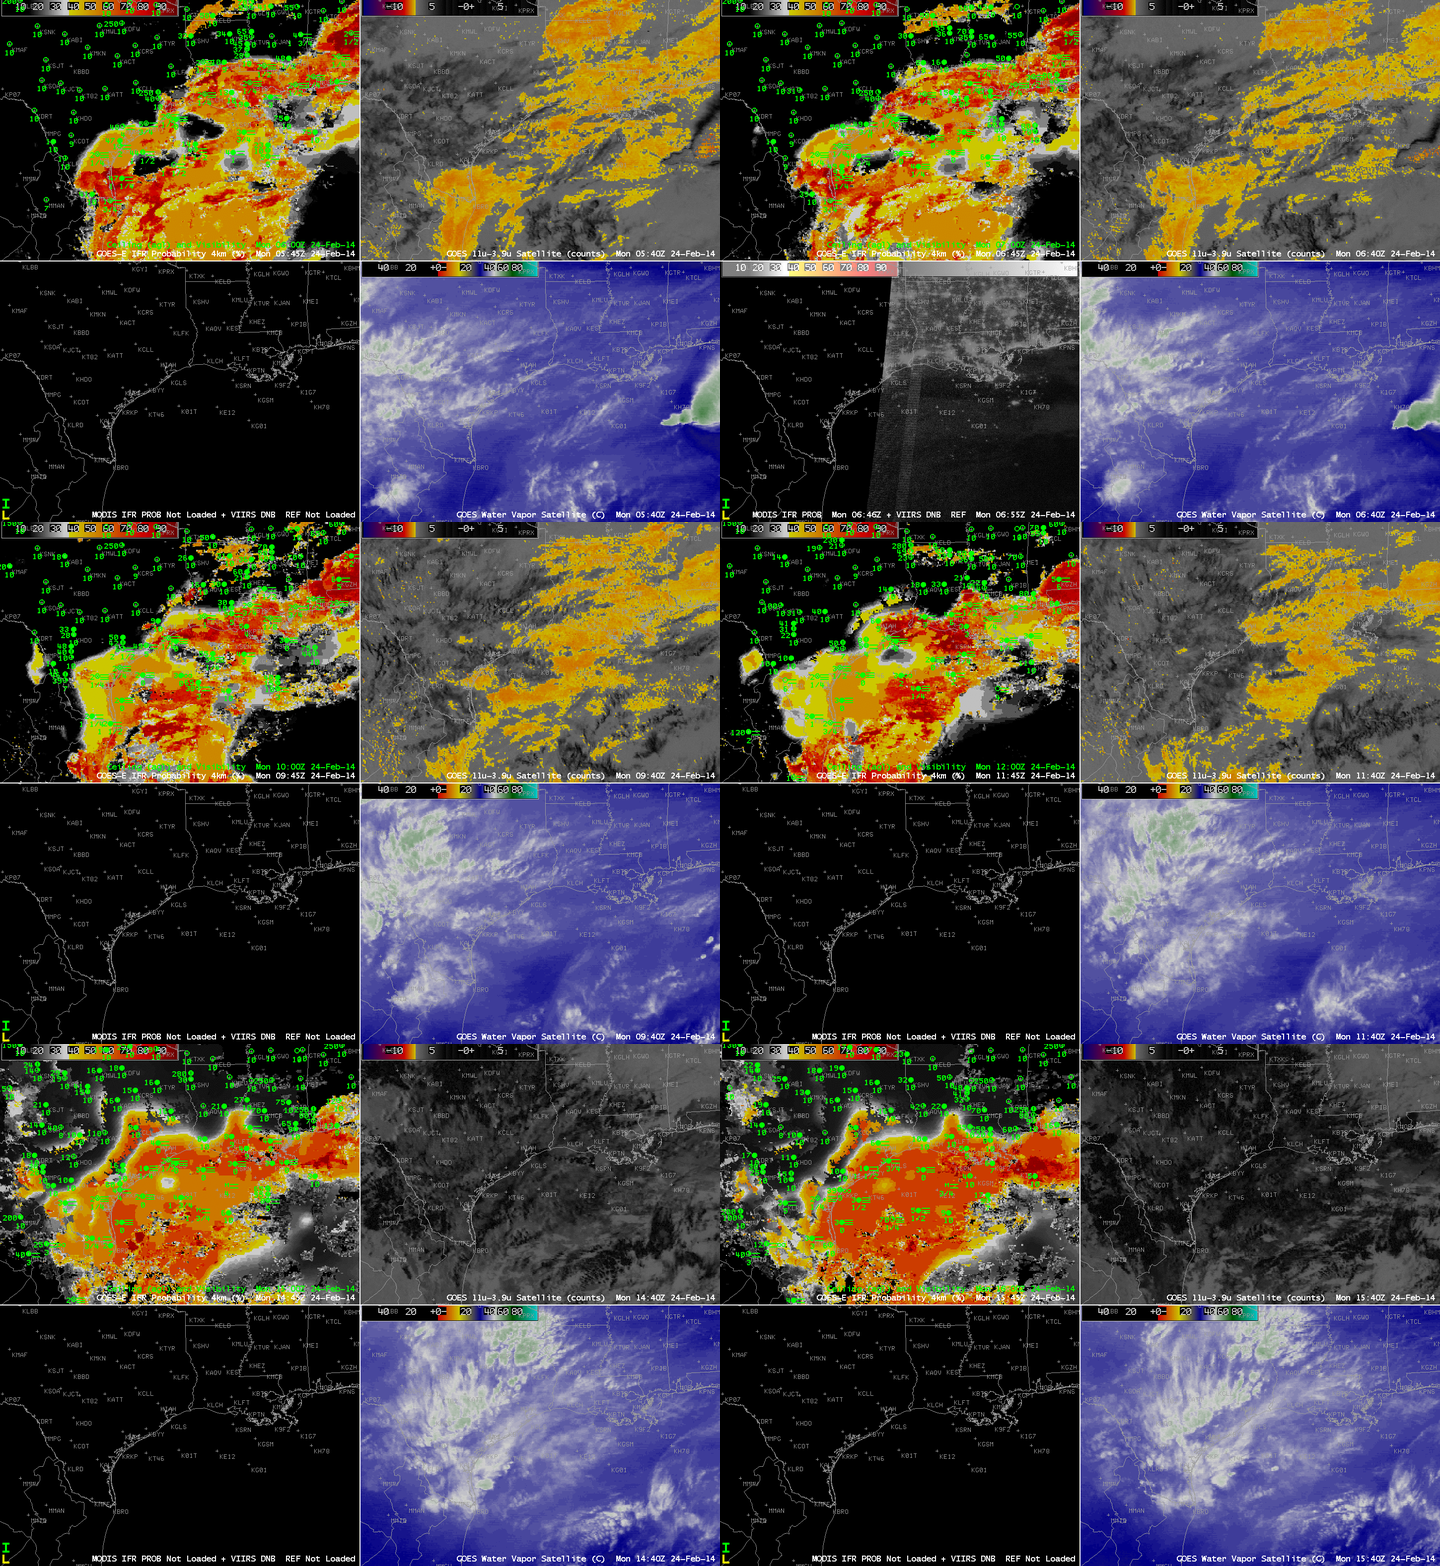
GOES-Based GOES-R IFR Probabilities (Upper Left), GOES-East Brightness Temperature Difference Fields (10.7 µm – 3.9 µm) (Upper Right), Suomi/NPP Day/Night band and MODIS-based IFR Probability fields (Lower Left), GOES-East Water Vapor Imagery (6.7 µm)(Lower Right), hourly from 0400 UTC through 1600 UTC 14 February 2014 (click image to enlarge)

IFR Probabilities are correctly limited to coastal regions of east Texas, with high values off shore. The brightness temperature difference field has difficulty identifying regions of low clouds over the Gulf of Mexico because of southwesterly flow aloft that contains mid- and high-level cloudiness. The relatively flat field over the Gulf — large values, but little variability — correspond to regions where high clouds exist. These high clouds prevent satellite predictors from being used in the IFR Probability algorithm because the brightness temperature difference does not observe low clouds, so only the Rapid Refresh model output is used to compute the IFR Probability. Therefore the IFR Probability fields are a bit flatter. Where there are breaks in the high clouds, the brightness temperature difference field can be used in the IFR Probability algorithm, and the computed IFR Probability is larger. In addition, the character of the probability field is more pixelated like a satellite image.

The bottom left image in the 4-panel composite above includes both the Day/Night band from Suomi/NPP (an image that — because of scant lunar illumination — gives little distinct information about the clouds present) and a MODIS-based IFR Probability field. For selected still imagery of ~0830 UTC Suomi/NPP click here; click here for ~0730 UTC MODIS-based IFR probability.

IFR Probability Fields are an early-alert for Developing Fog

GOES_IFR_PROB_20140214loop

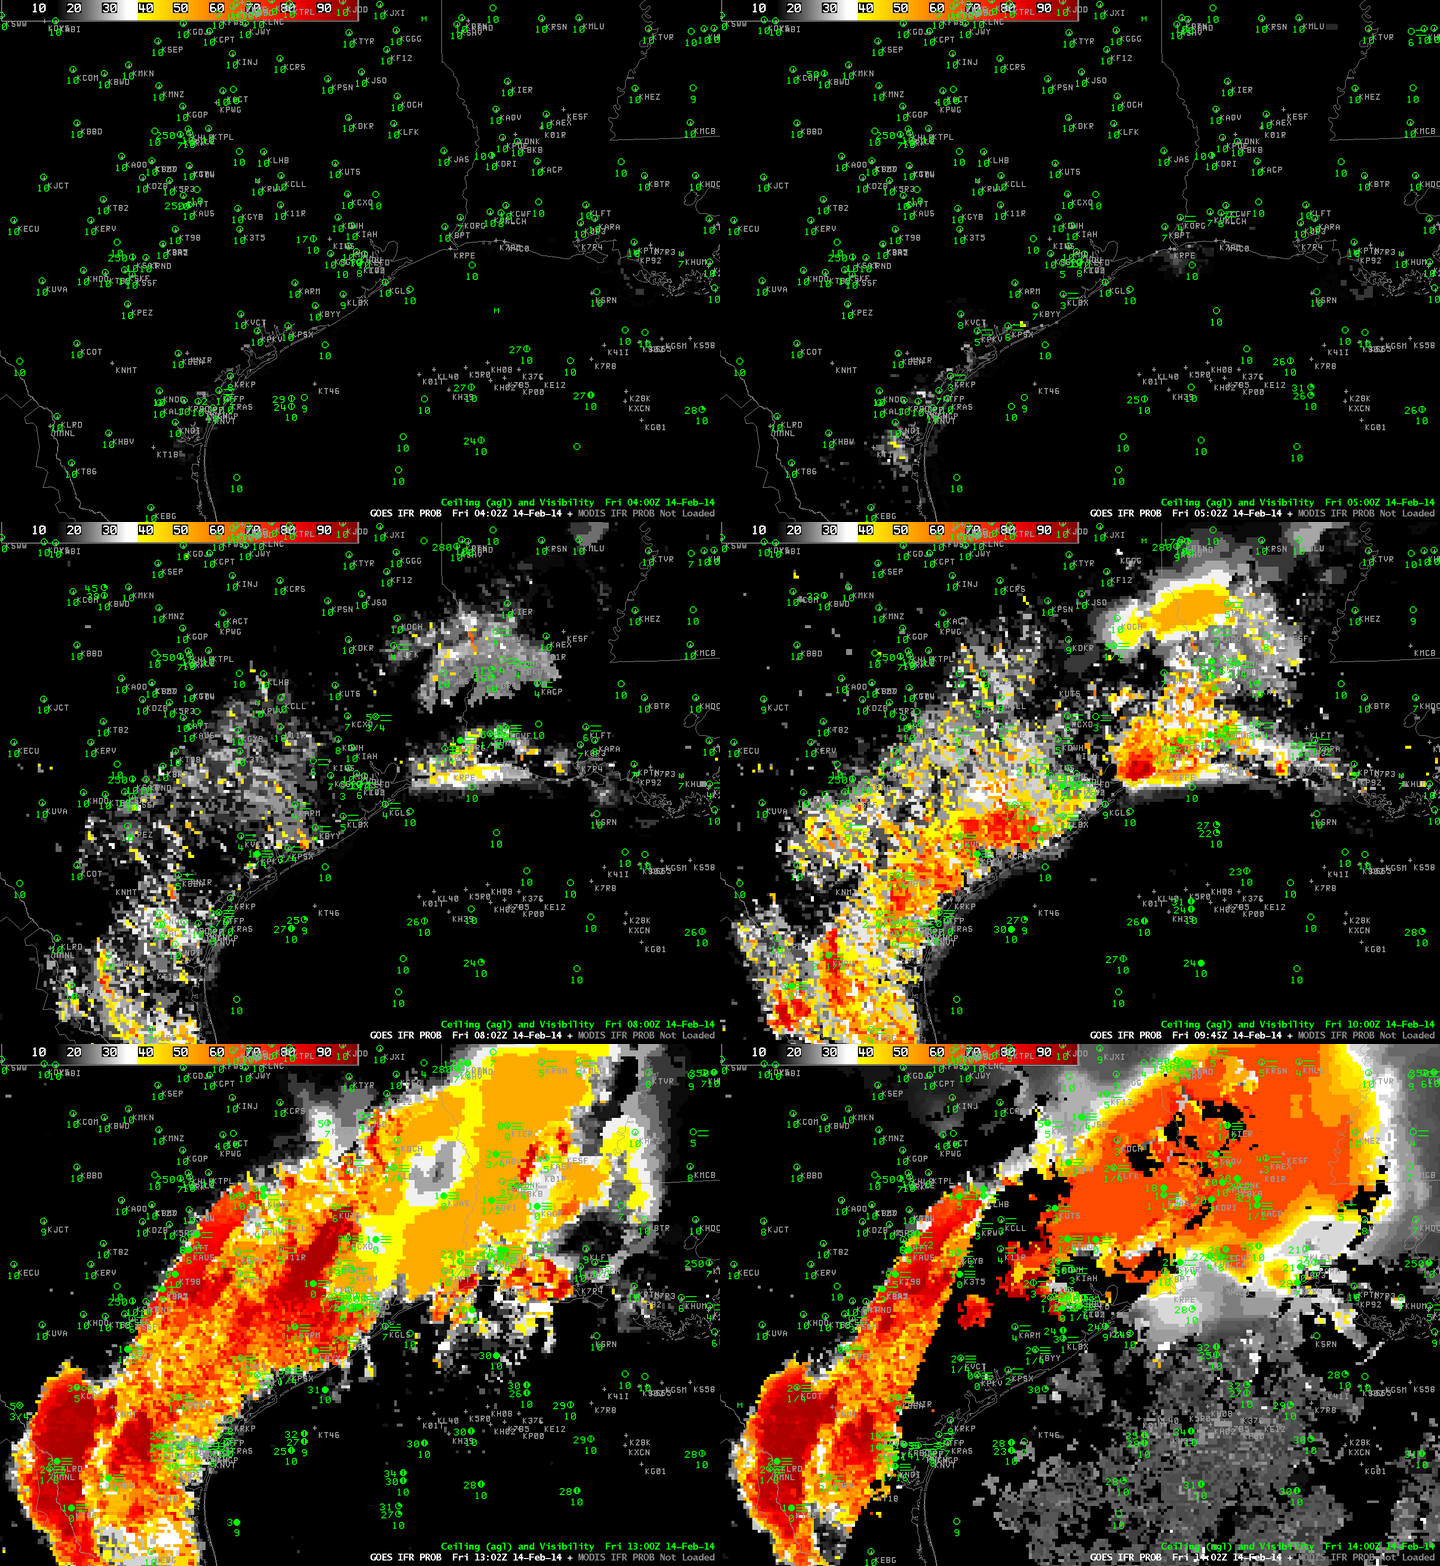
GOES-R IFR Probabilities from 0400 through 1400 UTC on 14 February 2014 (click image to enlarge)

Fog and Low clouds resulted in IFR conditions along a long swath of the western Gulf Coast today. IFR Probability fields warned of the development of these conditions long before a strong signal appeared in the traditional brightness temperature difference fields. The animation above, of hourly GOES-R IFR Probability fields (and surface observations of ceiling and visibility). There are indications by 0615 and 0702 that fog/low stratus is developing, and those indications are matched by some observations of IFR conditions. By 0915 UTC, widespread IFR conditions are present from southwest Louisiana southwestward through coastal Texas.

GOESMODIS_IFR_20140214_0845

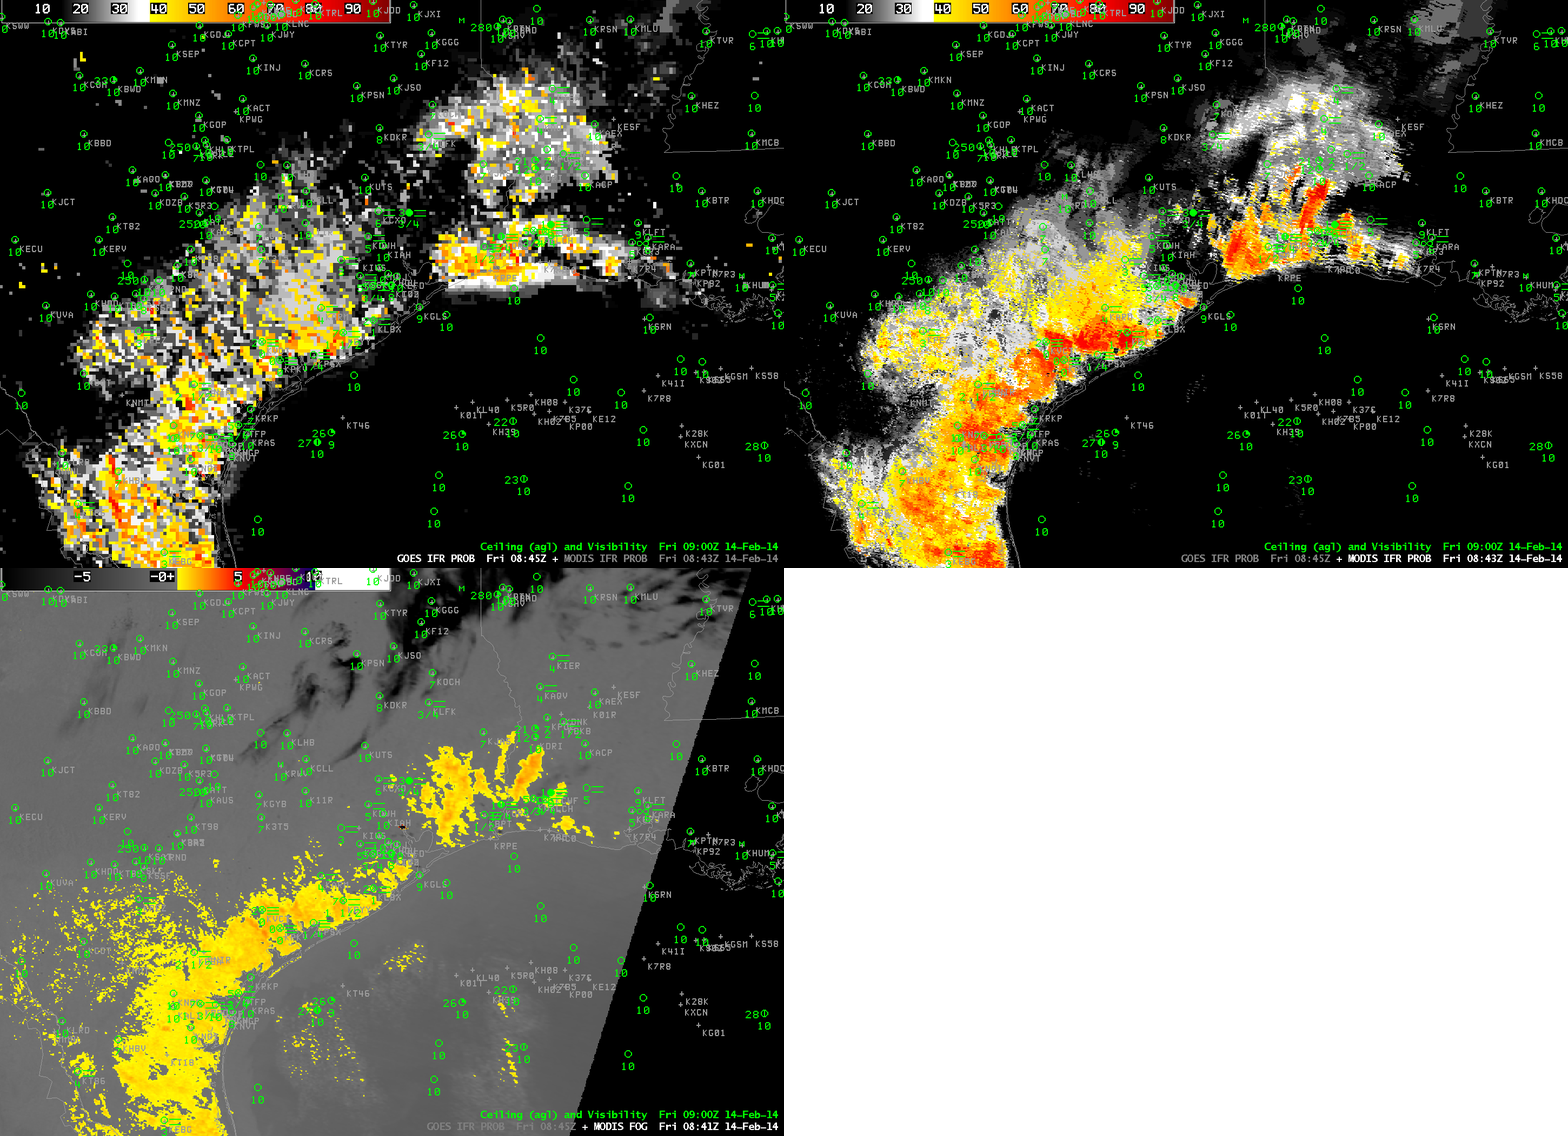
GOES-R IFR Probabilities, MODIS IFR Probabilities, and MODIS Brightness Temperature Difference fields, all from ~0845 UTC 14 February 2014 (click image to enlarge)

MODIS data can be used to generate IFR Probabilities as well, as shown above. The MODIS-based and GOES-based fields both generally overlap regions with developing IFR conditions. The MODIS-based Brightness temperature difference product (called MODIS FOG in the image annotation) shows little signal in central Louisiana/east Texas (near Lufkin, for example) or southwest of Houston, two places where near-IFR conditions are developing (and where the IFR Probability fields have a signal).

VIIRS_DNB_FOG_20140214toggle

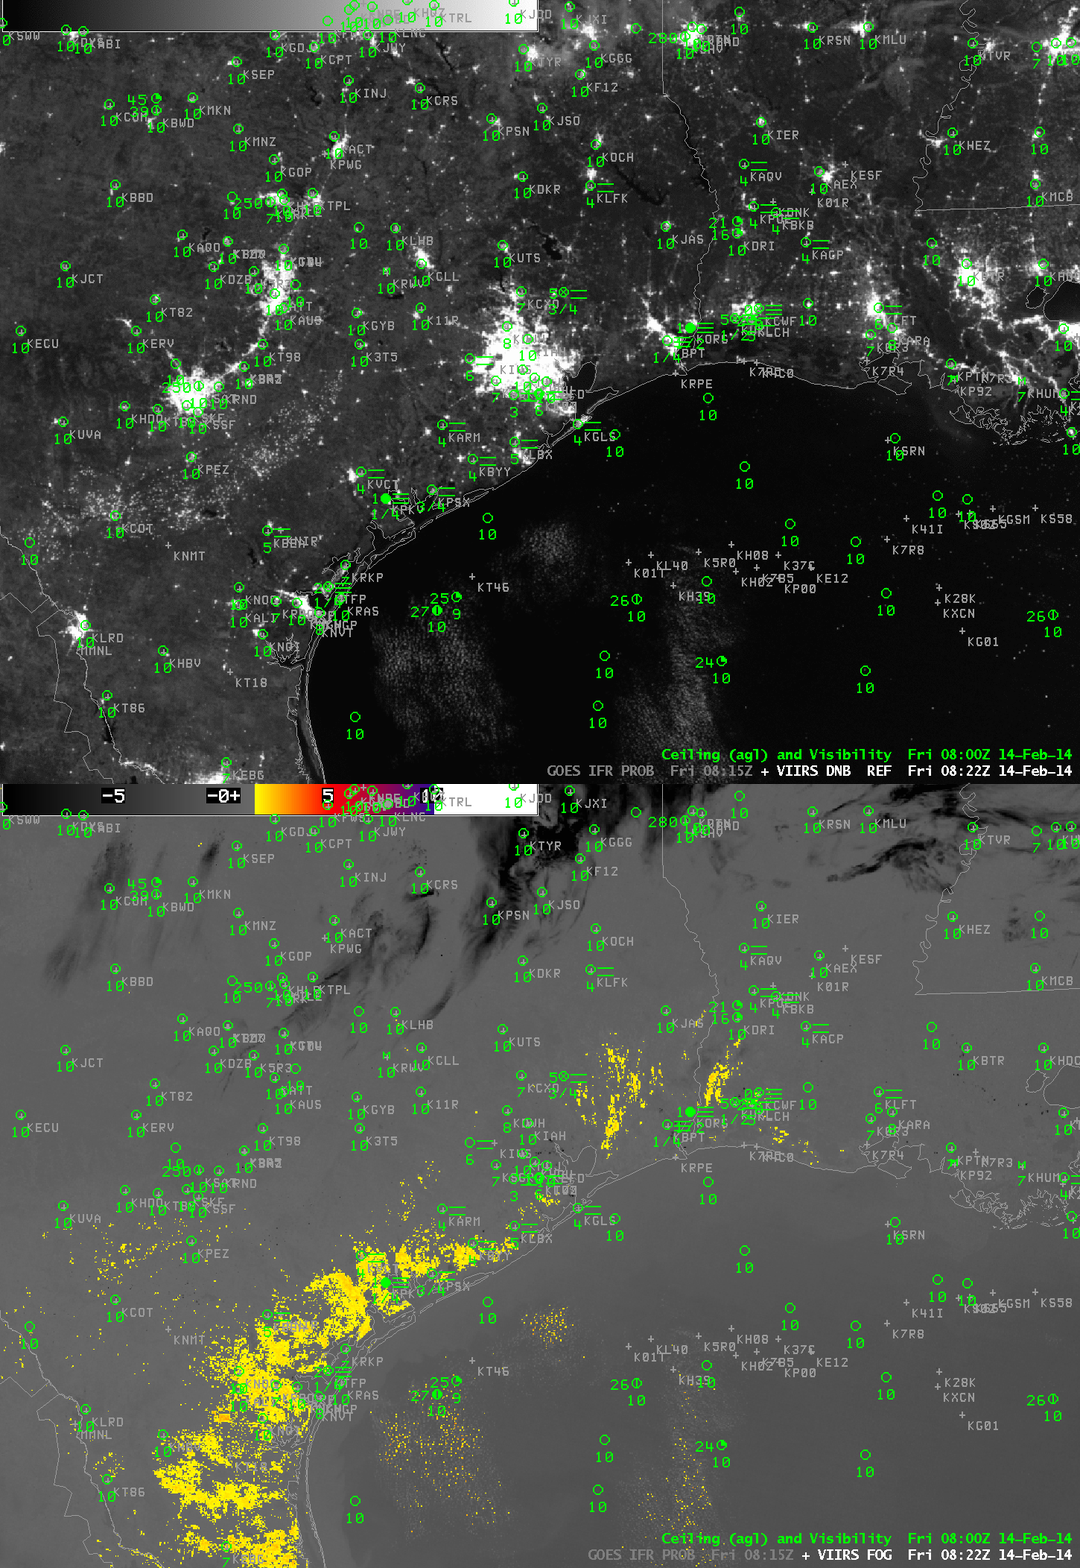
GOES-R IFR Probabilities, MODIS IFR Probabilities, and MODIS Brightness Temperature Difference fields, all from ~0845 UTC 14 February 2014 (click image to enlarge)

Suomi/NPP data (Brightness Temperature Difference fields, and the Day/Night band) from the same hour (0822 UTC) as the MODIS data similarly underpredicts the areal extend of the developing IFR conditions.

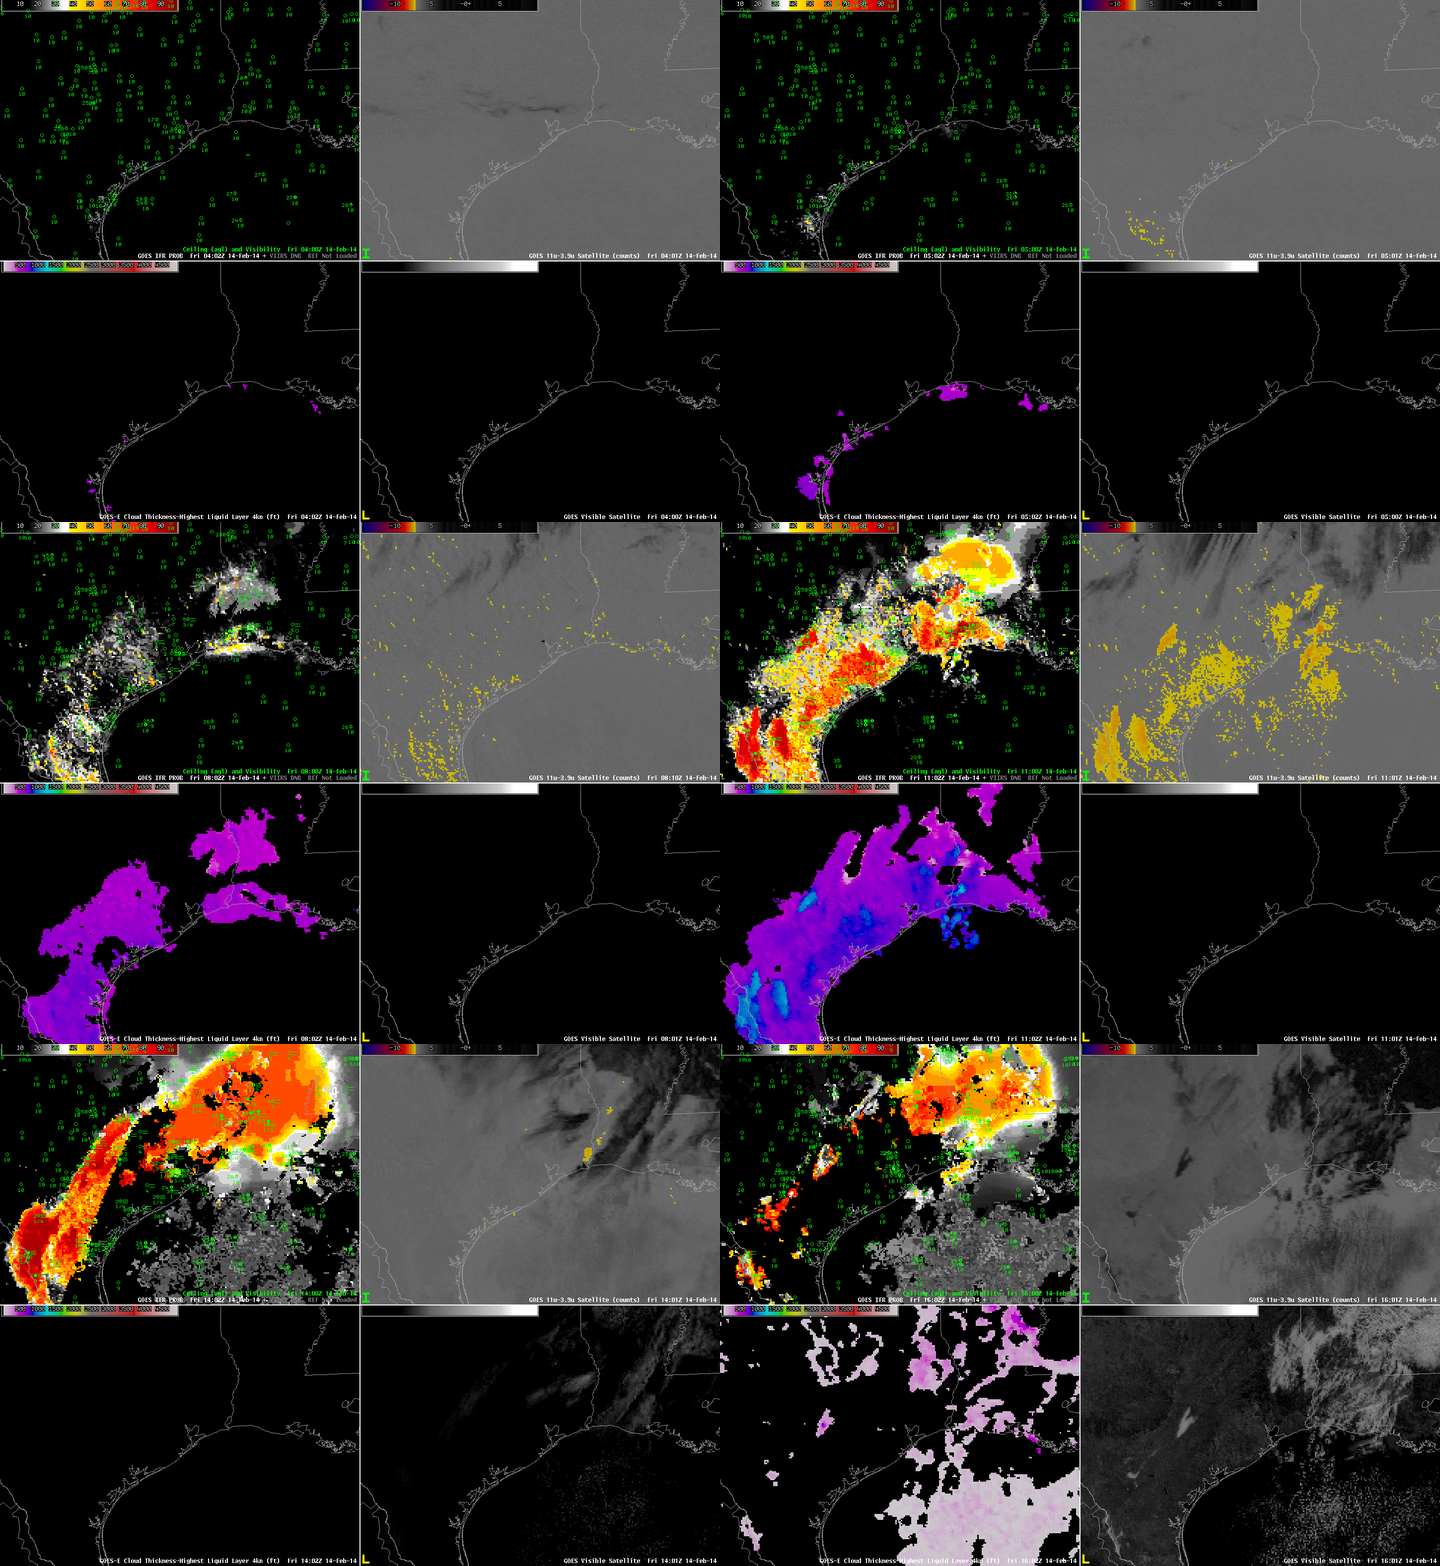
GOES_IFR_PROB_20140214_4panelloop

GOES-Based GOES-R IFR Probabilities (Upper Left), GOES-East Brightness Temperature Difference Fields (Upper Right), GOES-R Cloud Thickness (Lower Left), GOES-East Visible Imagery (Lower Right), hourly from 0400 UTC through 1600 UTC 14 February 2014 (click image to enlarge)

The animation above shows hourly views of GOES-R IFR Probability and GOES-East Brightness Temperature Difference fields. There is little discernible signal in the brightness temperature difference field until about 0915 UTC (several hours after the IFR Probability field has been suggesting fog development). Thus the GOES-R IFR Probability field is giving better lead time is diagnosing where visibility restrictions might occur/be occurring. In addition, the GOES-R Cloud Thickness product shows that the thickest fog/stratus field just before sunrise is just east of Austin/San Antonio, and that is the last region to clear out after sunrise.

The presence of high clouds has an effect on both the IFR Probability fields and the brightness temperature difference field. When high clouds are present (in the brightness temperature difference enhancement used, high clouds are dark), IFR Probabilities drop in value and the field becomes flatter because satellite data cannot be used in the computation of the IFR Probability Field.