Category Archives: Midwest

Dense Fog over the Midwest US

GOESR_IFR_6May2015_0200_1300

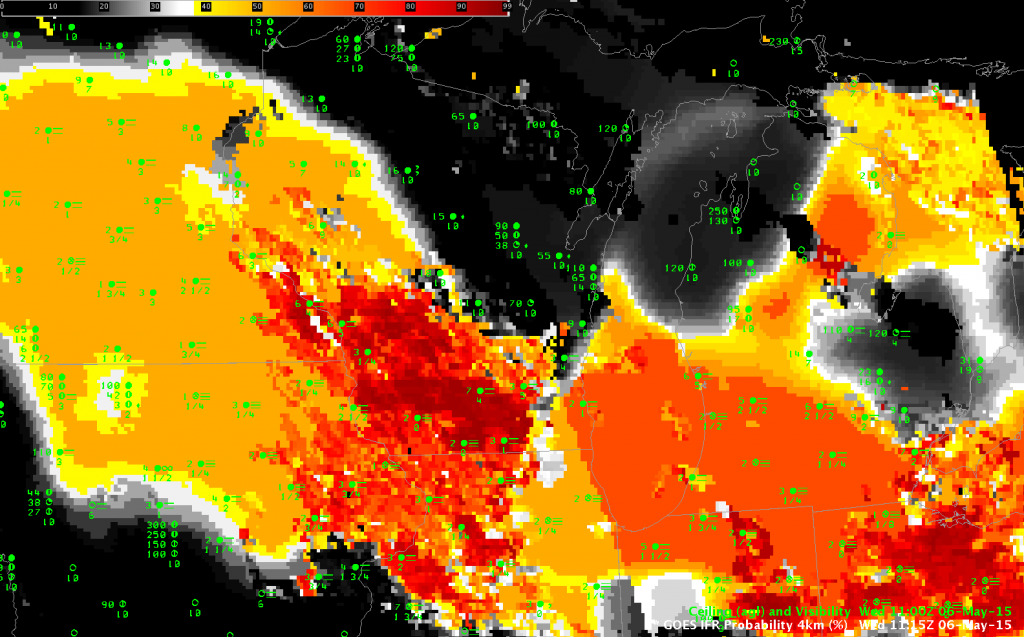
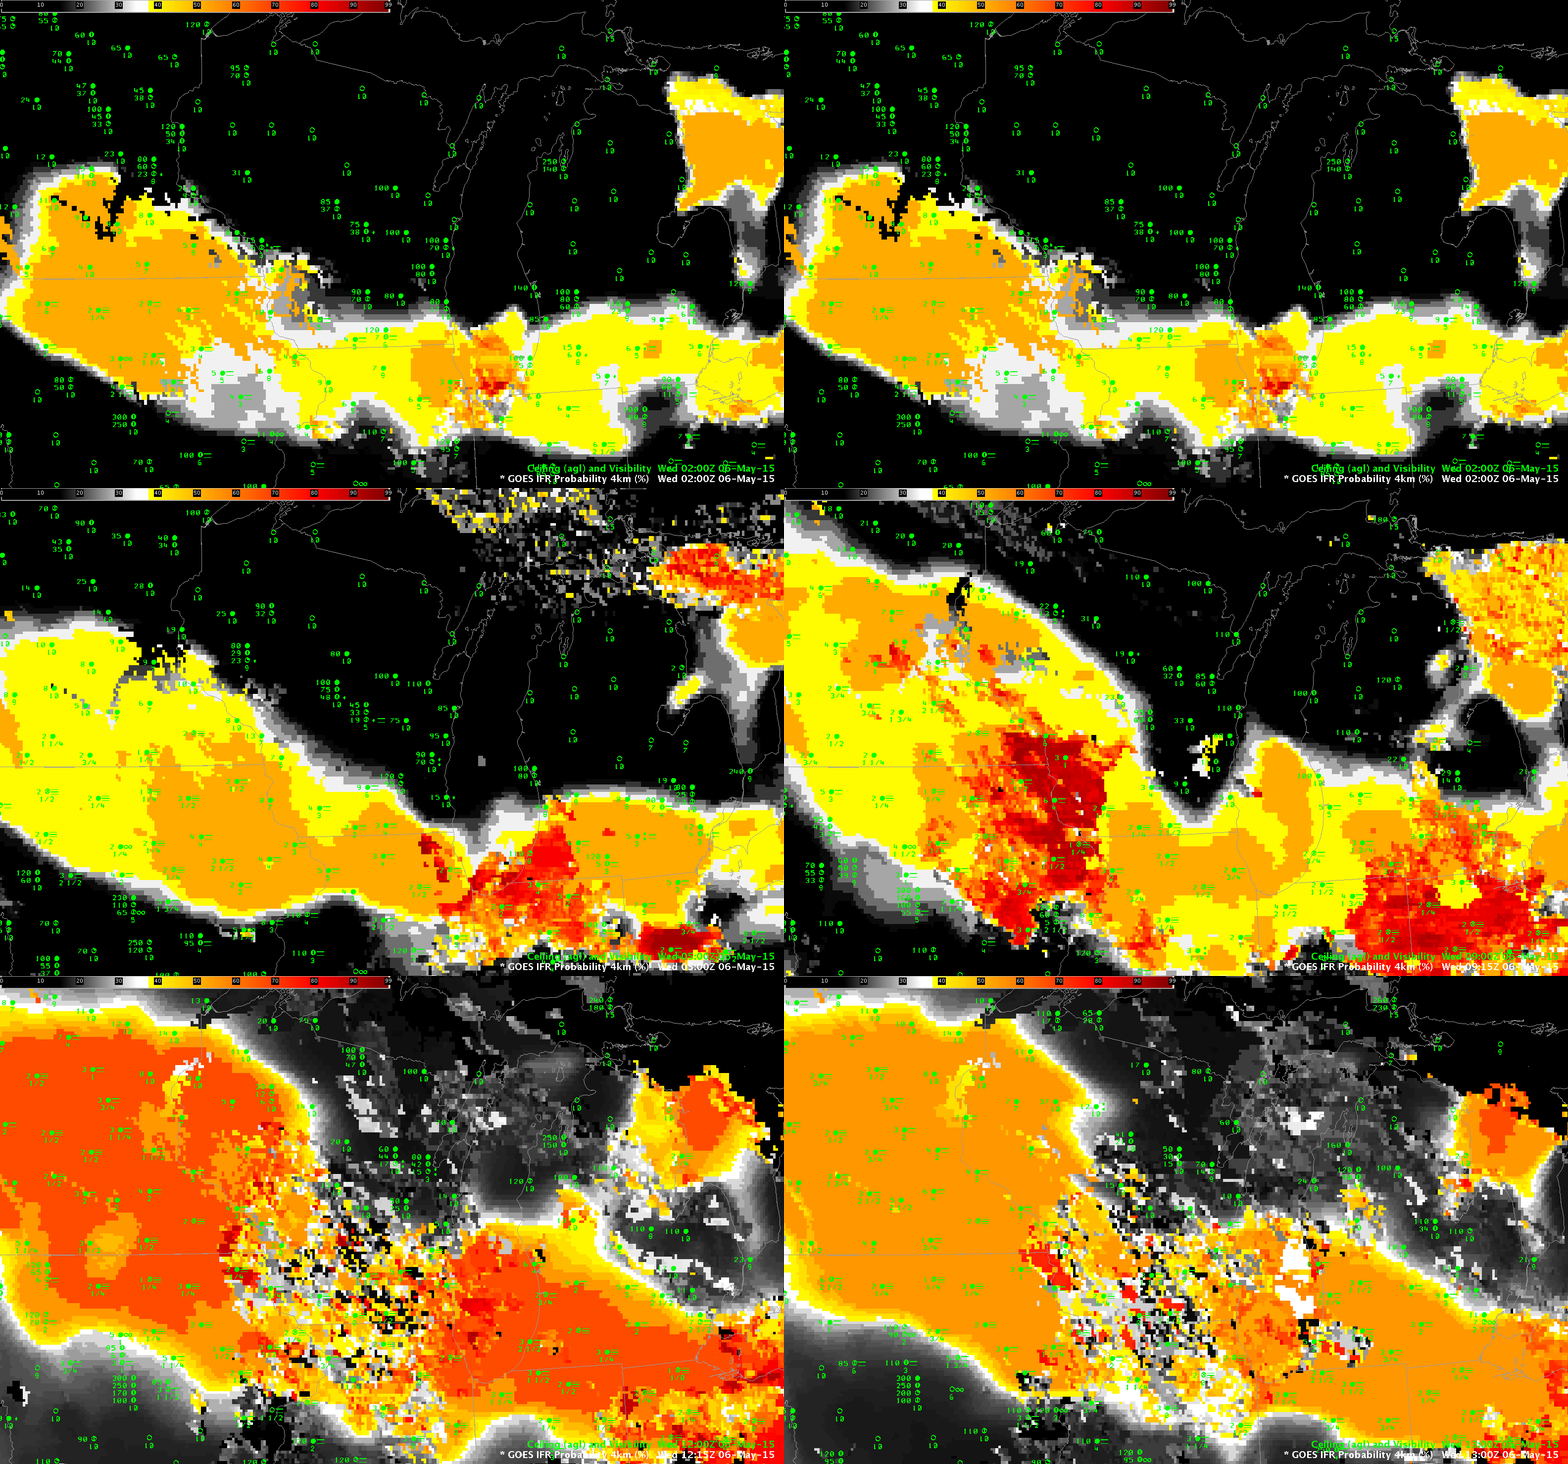
Fog and low clouds developed north of a stationary front draped across the midwest early in the morning on May 6th. Dense fog advisories were hoisted from Iowa to northwestern Ohio.

The animation above shows the increase in IFR Probabilities overnight as the dense fog developed.  Note the difference in IFR Probability that arises when satellite data can be used as a predictor (that is, when the developing fog/low stratus is not overlain by higher clouds).  Northwest Ohio until about 1200 UTC is a region where low clouds are viewed.  There, satellite predictors can be used in the computation of IFR Probability fields.  Accordingly, values are larger and there is more small-scale variability (the field looks more pixelated).  In contrast, the field over Iowa for much of the animation is relatively flat.  Here, even through values are comparatively low, interpret them knowing that satellite predictors are not being used because of the presence of middle/higher clouds that preclude the ability of satellite detection of low clouds.

An animation of the traditional brightness temperature difference field, here, from 0500-1000 UTC (after 1100 UTC, increasing reflected solar radiation makes the brightness temperature difference field less useful as a fog/stratus detection device). Compare the regions where IFR Probabilities are largest with the regions of strong Brightness Temperature Difference Signals.

IFR Probability fields above define the region of reduced visibilities very well.  This suggests the Rapid Refresh model and the satellite (where its use was possible) were both in accord with the development of fog/low stratus in this region of the country.

The 1115 UTC image in the animation above, shown below, includes the day/night boundary artifact.  This is the straight line, roughly parallel to the terminator (it will stretch directly north-south on the Equinoxes), that parallels the Lake Michigan shoreline at Chicago.  To the right, daytime predictors are used and IFR Probabilities are somewhat larger (67% vs. 51%) than they are where nighttime predictors are used to the west.

GOESR_IFR_6May2015-50

Fog over Indiana

IFRPROB_17April2015_02_12

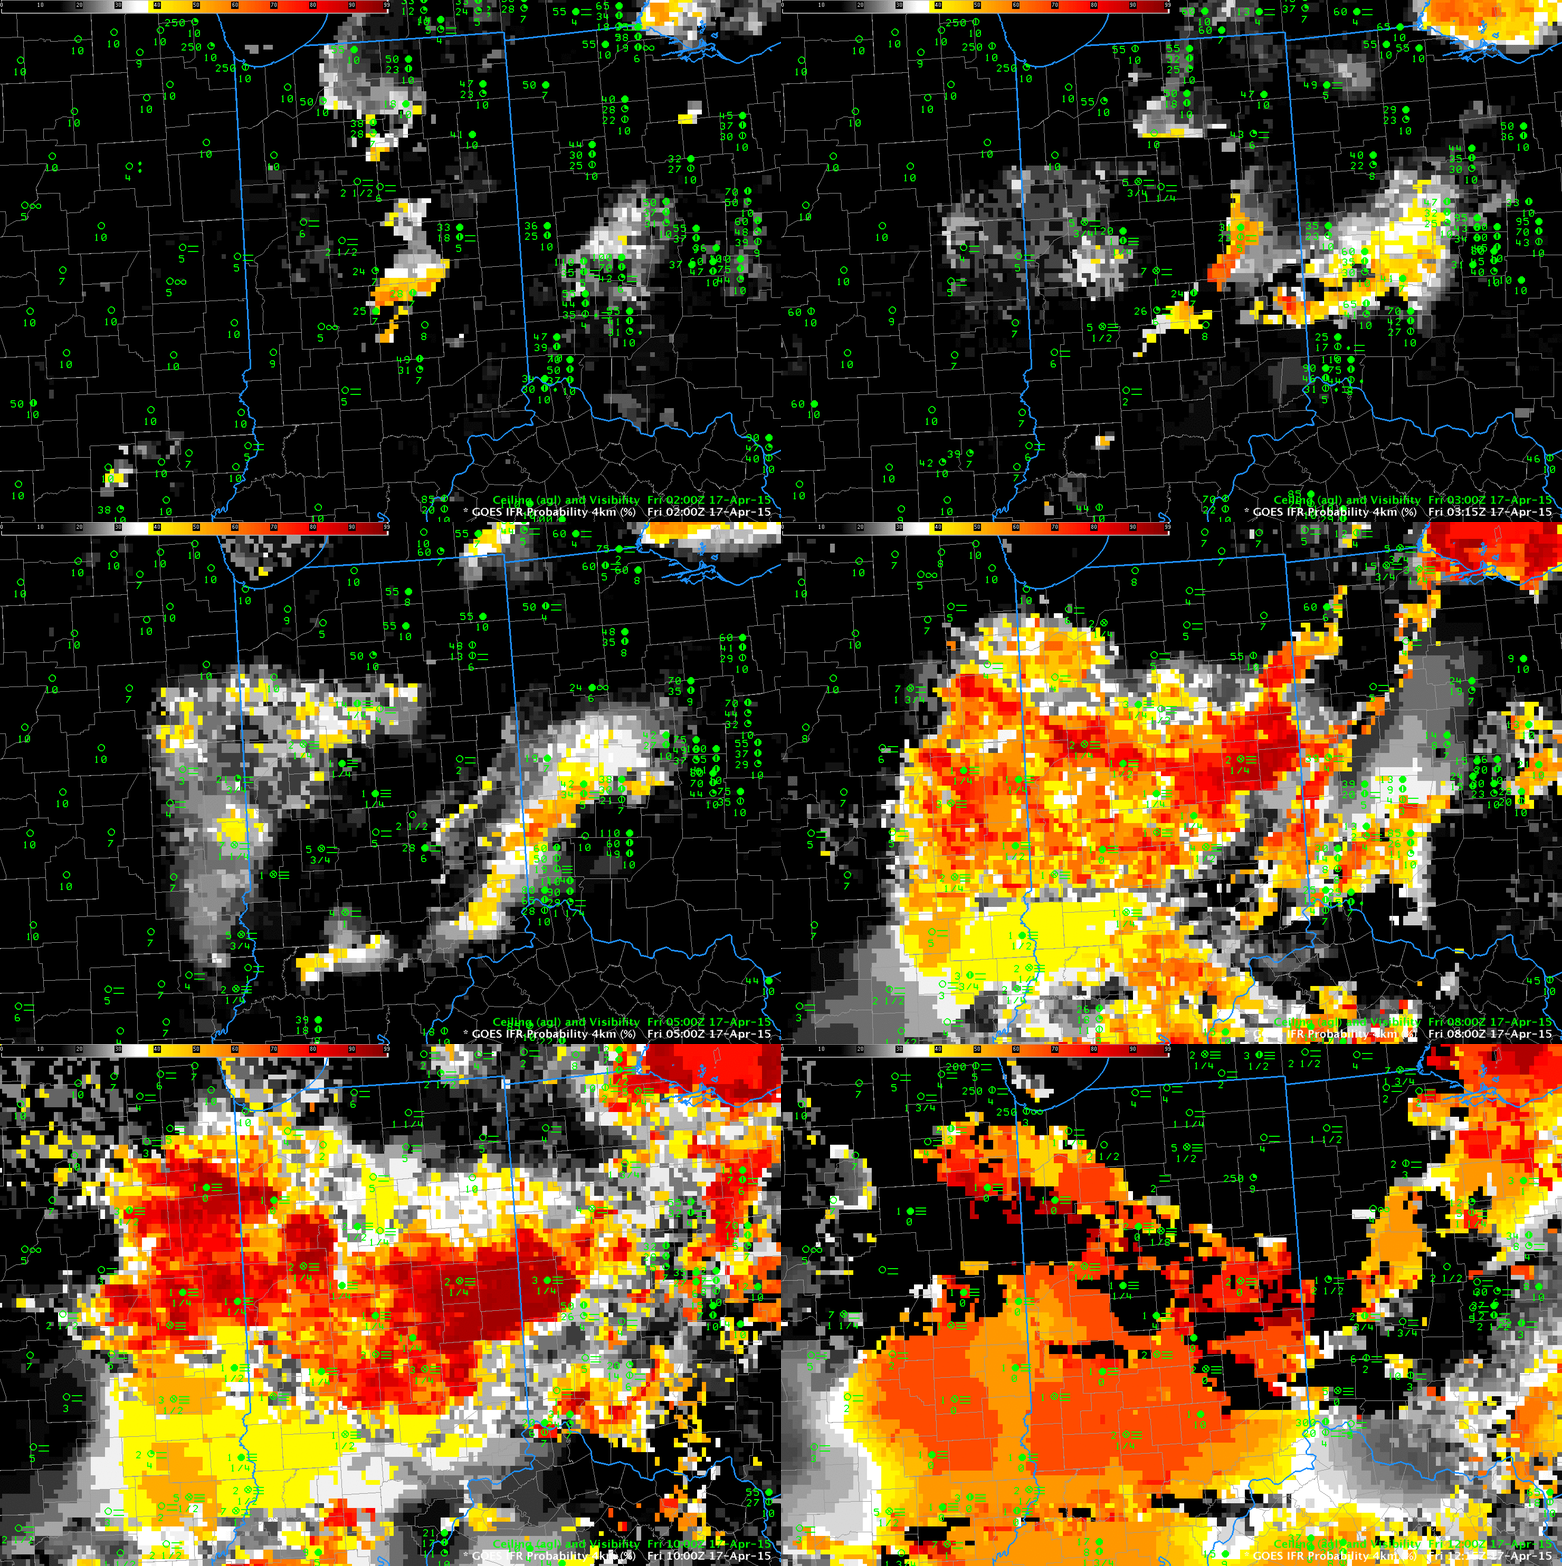
GOES-R IFR Probabilities over Indiana and surrounding states, 0200-1215 UTC on 17 April (Click to enlarge)

For developed over Indiana and surrounding states during the morning of April 17th.  An hourly animation of GOES-R IFR Probabilities, from 0200 through 1215 UTC, computed from GOES-East and Rapid Refresh Data is shown above.  Fog is developing at 0200 UTC, already over portions of western Indiana, and IFR Probabilities increase quickly.  By 0700 UTC, large regions show reduced visibilities and IFR Probabilities exceeding 85%.

High clouds moving in from the west and southwest starting at about 0800 UTC have an impact on the IFR Probability fields as well.  Only Rapid Refresh Data are used to compute IFR Probabilities where mid-level and high clouds prevent satellite detection of low clouds.  As a result, the character of the field changes:  it becomes flatter (less pixelated) and values decrease (because probability is not so certain when satellite data cannot be used to validate Model predictions).

The final image in the animation above, at 1215 UTC, was computed just after sunrise.  Note that IFR Probability values generally increase.  This is especially notable in regions where mid-level and high-level clouds are present (over southern Illinois and southern Indiana).  Probabilities are higher because the satellite can detect clouds are present.  There are also regions at 1215 UTC where IFR Probabilities rapidly drops to zero.  This is likely a difficulty in the Cloud Typing algorithm that occurs with very low sun angle (as discussed here).  Holes at 1215 UTC have filled in by 1300 UTC.

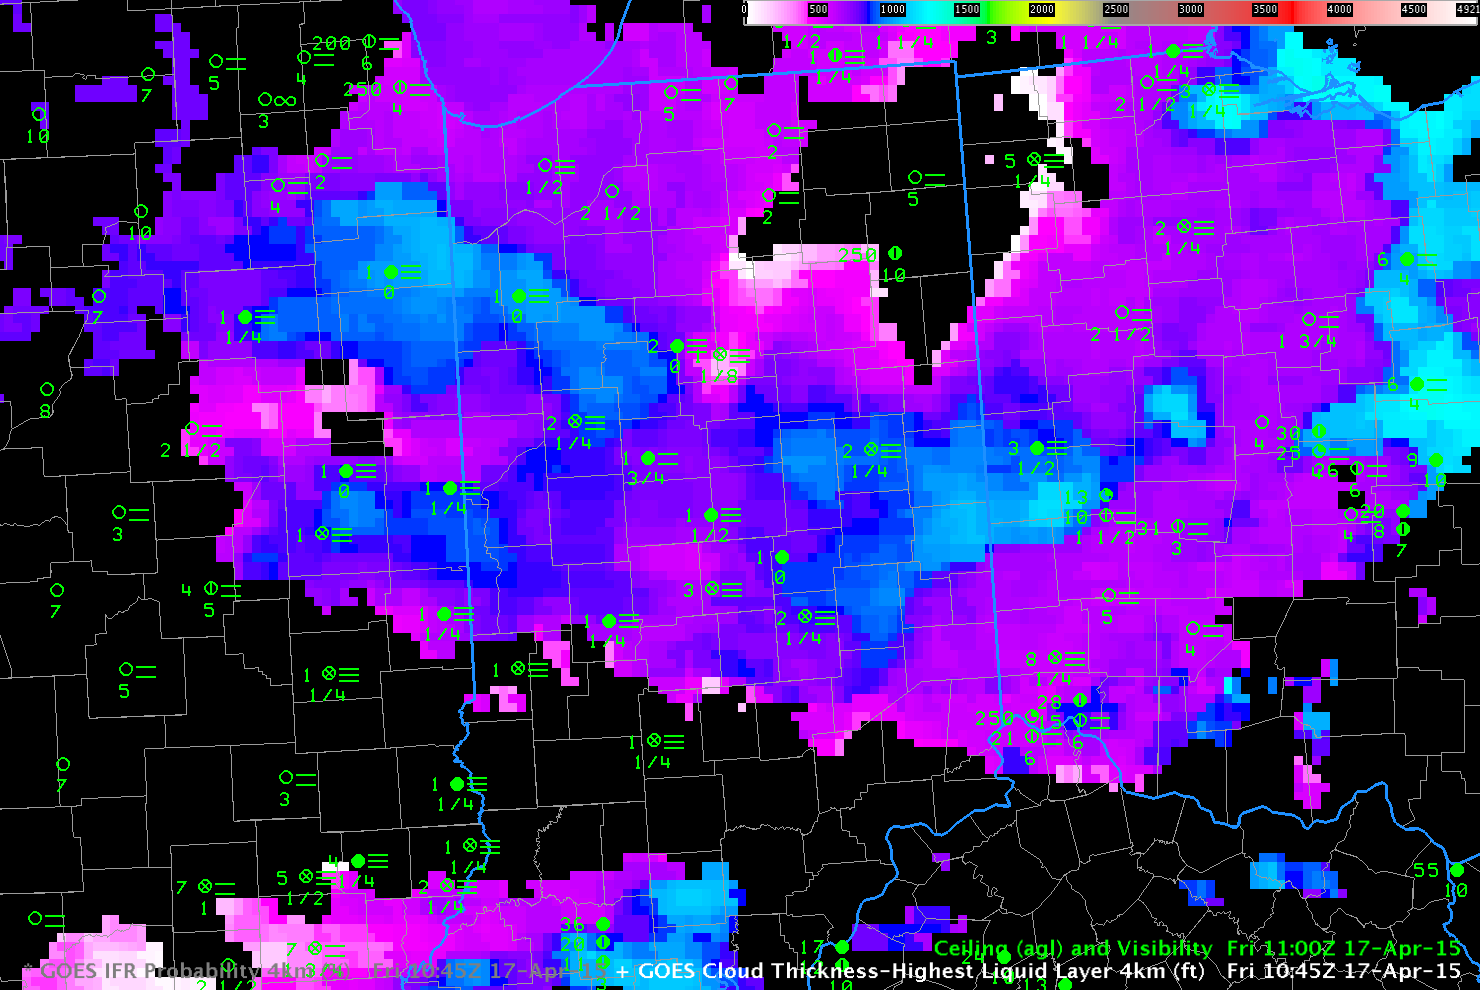
Cloud thickness can give a first estimate of cloud dissipation time. This link shows a scatterplot with a best-fit line that relates dissipation time to Cloud Thickness from a past study. The Cloud Thickness used is the final one computed before twilight conditions, and that is shown below. (Note that cloud thickness is not computed in regions where mid-level and high-level clouds exist) Much of the fog over Indiana is relatively thin — less than 800 feet thick — with a few regions that exceed 1000 feet. Burn-off of this fog should be relatively quick, and most of the Dense Fog Advisories expired at 1400 UTC.

GOESR_CloudThickness_17April_1045UTC

GOES-R Cloud Thickness just before sunrise, 17 April 2015 (Click to enlarge)


URGENT - WEATHER MESSAGE
NATIONAL WEATHER SERVICE NORTHERN INDIANA
600 AM EDT FRI APR 17 2015

INZ020-022-023-032>034-171400-
/O.NEW.KIWX.FG.Y.0005.150417T1000Z-150417T1400Z/
WHITE-CASS IN-MIAMI-GRANT-BLACKFORD-JAY-
INCLUDING THE CITIES OF...MONTICELLO...BROOKSTON...MONON...
LOGANSPORT...ROYAL CENTER...PERU...GRISSOM AFB...MEXICO...
MARION...GAS CITY...UPLAND...HARTFORD CITY...MONTPELIER...
PORTLAND...DUNKIRK
600 AM EDT FRI APR 17 2015

...DENSE FOG ADVISORY IN EFFECT UNTIL 10 AM EDT THIS MORNING...

THE NATIONAL WEATHER SERVICE IN NORTHERN INDIANA HAS ISSUED A
DENSE FOG ADVISORY...WHICH IS IN EFFECT UNTIL 10 AM EDT THIS
MORNING.

* VISIBILITY: A QUARTER MILE OR LESS.

* IMPACTS: VERY HAZARDOUS DRIVING CONDITIONS...WHICH WILL LEAD TO
  TRAVEL DELAYS. PLEASE LEAVE EARLY IF TRAVELING THIS MORNING AND
  ALLOW EXTRA TIME TO REACH YOUR DESTINATION.

PRECAUTIONARY/PREPAREDNESS ACTIONS...

A DENSE FOG ADVISORY MEANS VISIBILITIES WILL FREQUENTLY BE
REDUCED TO LESS THAN ONE QUARTER MILE. IF DRIVING...SLOW DOWN...
USE YOUR HEADLIGHTS...AND LEAVE PLENTY OF DISTANCE AHEAD OF YOU.

When IFR Probabilities suddenly vanish

GOESIFR_PROB_Sunrise_11March2015

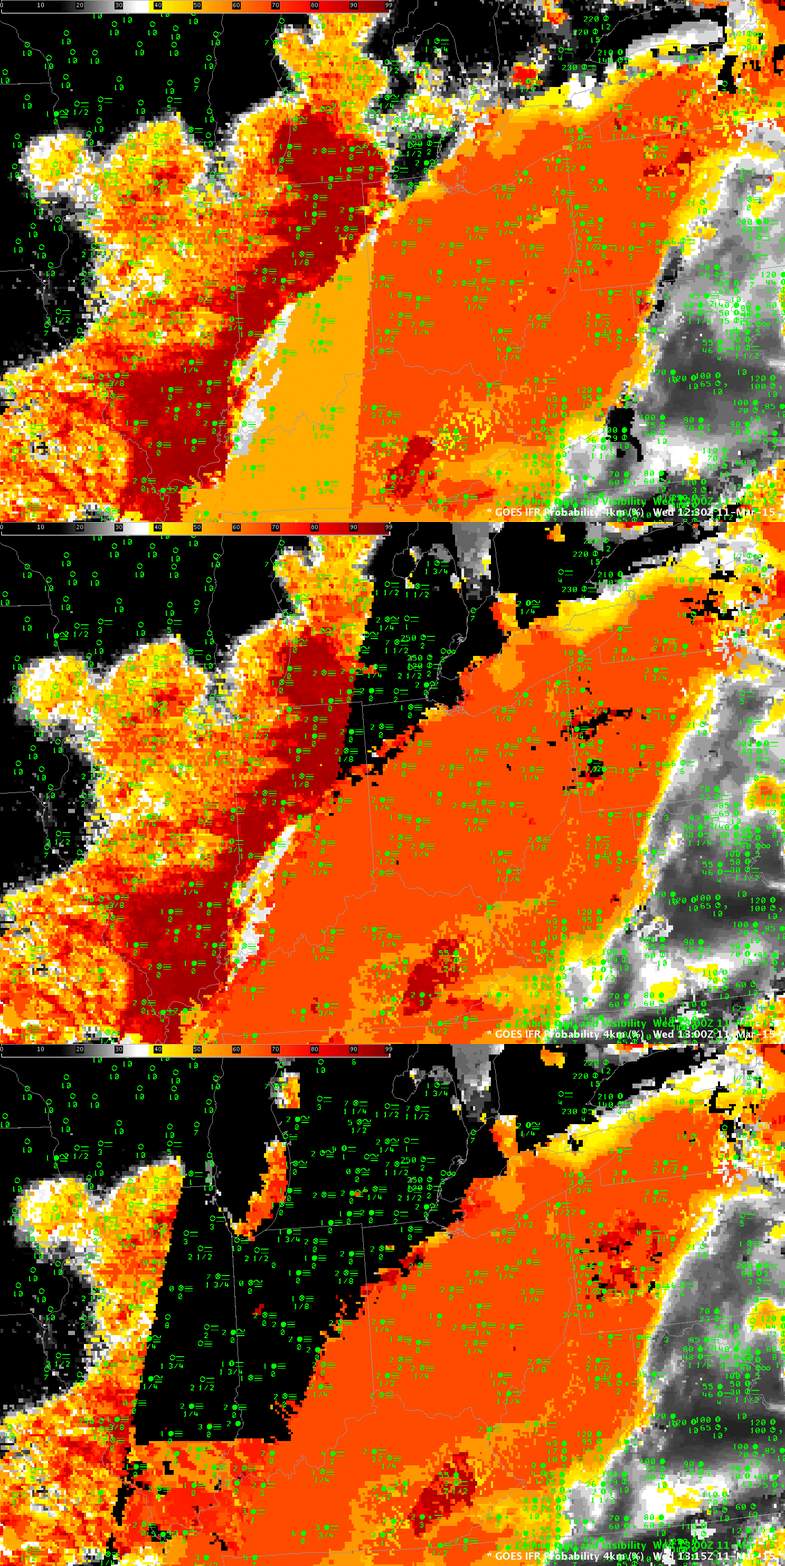
GOES-R IFR Probabilities over Indiana around sunrise on March 11 demonstrated what can happen when the Cloud Mask does not detect clouds, for whatever reason. The three-image loop above shows GOES-R IFR Probability at 1230, 1315 and 1330 UTC on 11 March. In the 1230 UTC image, the boundary between daytime predictors (to the east) and nighttime predictors (to the west) is manifest as a nearly north-south line through Kentucky and eastern Indiana. At 1315 UTC, a different boundary has appeared central lower Michigan, and this boundary moves westward to central Illinois at 1330 UTC. IFR Probabilities drop quickly to ~2% as this boundary passes, even though widespread IFR conditions are apparent. What is going on?

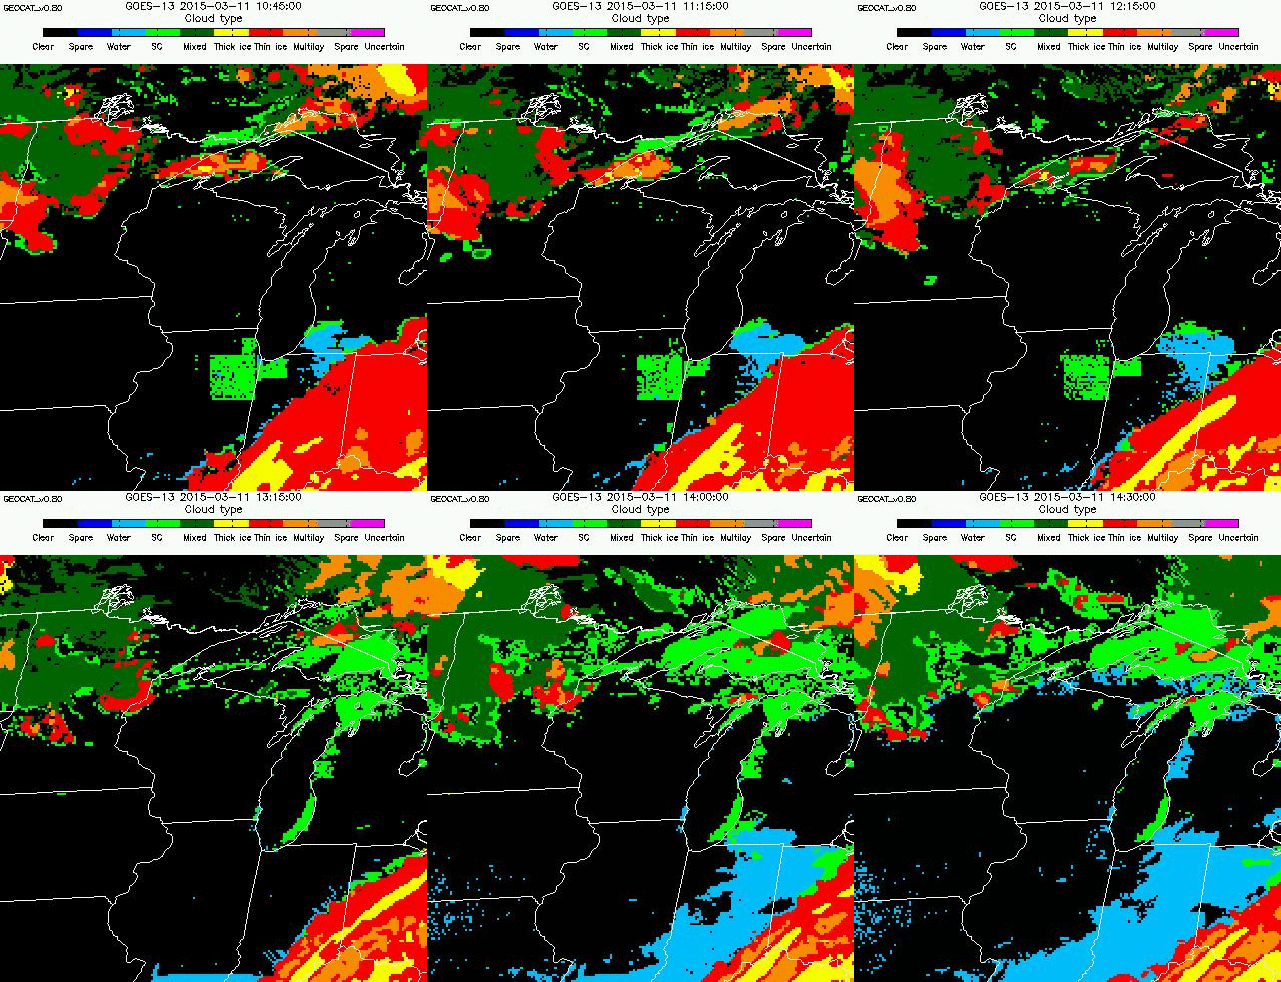
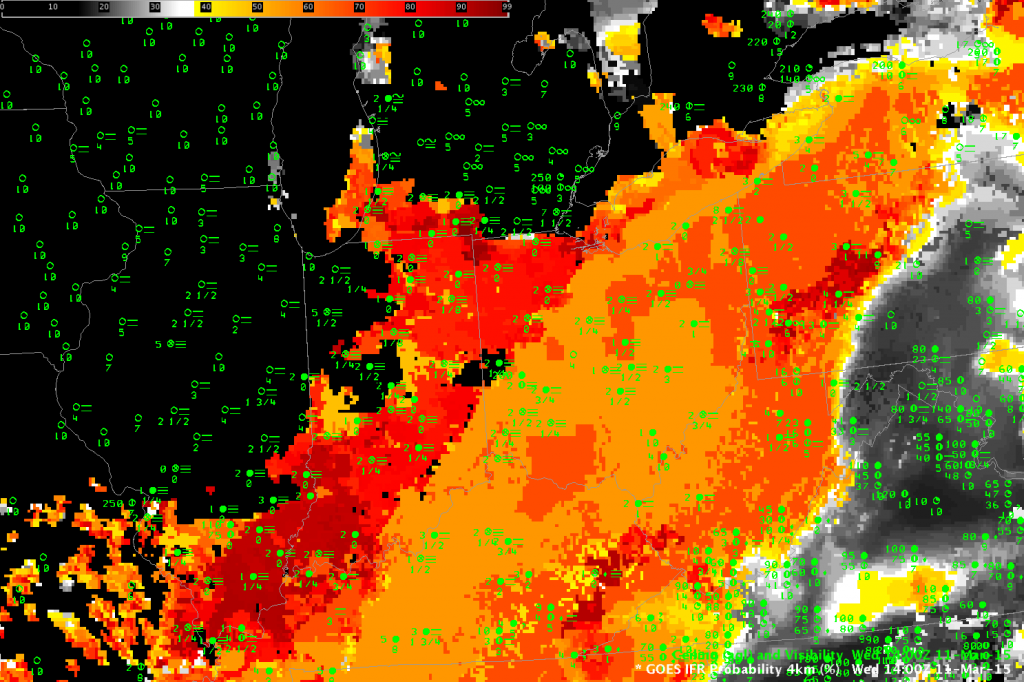
In this case, the cloud mask algorithm has failed to identify clouds over Indiana where clouds are present. A lack of clouds suggests Fog cannot be present. During the night, cloud masking is assigned less weight (because cloud detection is more difficult at night) so the cloud mask has a smaller impact on the IFR Probability. As night transitions into day, however, cloud masking acquires more importance in the computation of IFR Probability so the lack of a cloud will greatly influence IFR Probabilities. The IFR Probability algorithm also has a temporal check, so the effect of no cloud — as determined by the cloud mask — does not happen immediately as the sun rises. The animation below of cloud type shows no cloud type detected (starting at 1215 UTC over Michigan) in the regions where IFR Probabilities dropped. (That is, the cloud mask says no cloud is present; note also how IFR Probabilities do persist with the supercooled clouds over lower Lake Michigan, and with the clouds over southern Illinois).  Notice also how the cloud type returns over southern Illinois at 1315 UTC — the cloud mask is more accurate at that point.  Cloud masking identifies clouds over most of Indiana and Illinois by 1400 UTC; this can be deduced by the presence of cloud type values there.  The 1400 UTC GOES-R IFR Probability field, at bottom, shows IFR Probabilities redeveloping over Indiana and Illinois.

The Cloud Mask that is used by GOES-R IFR Probabilities is scheduled to be replaced with a more accurate (and more up-to-date) Bayesian Cloud Mask in the near future. This change, and GOES-R data (GOES-R is scheduled to launch on March 11 2016, in one year) will likely mitigate such cloud-masking errors as occurred on March 11 2015.

geocat.GOES-EAST.2015070.104500.to.143000.WISC.ctypeloop

GOES-13 Cloud Type, 1045 – 1430 UTC on 11 March 2015 (Click to enlarge)

GOES_IFRPROB_1400UTC_11March2015

GOES-R IFR Probabilities, 1400 UTC 11 March 2015 (Click to enlarge)

Fog under high clouds over the Midwest

IFRPROB_UpperMidwest_10March2015_2_11

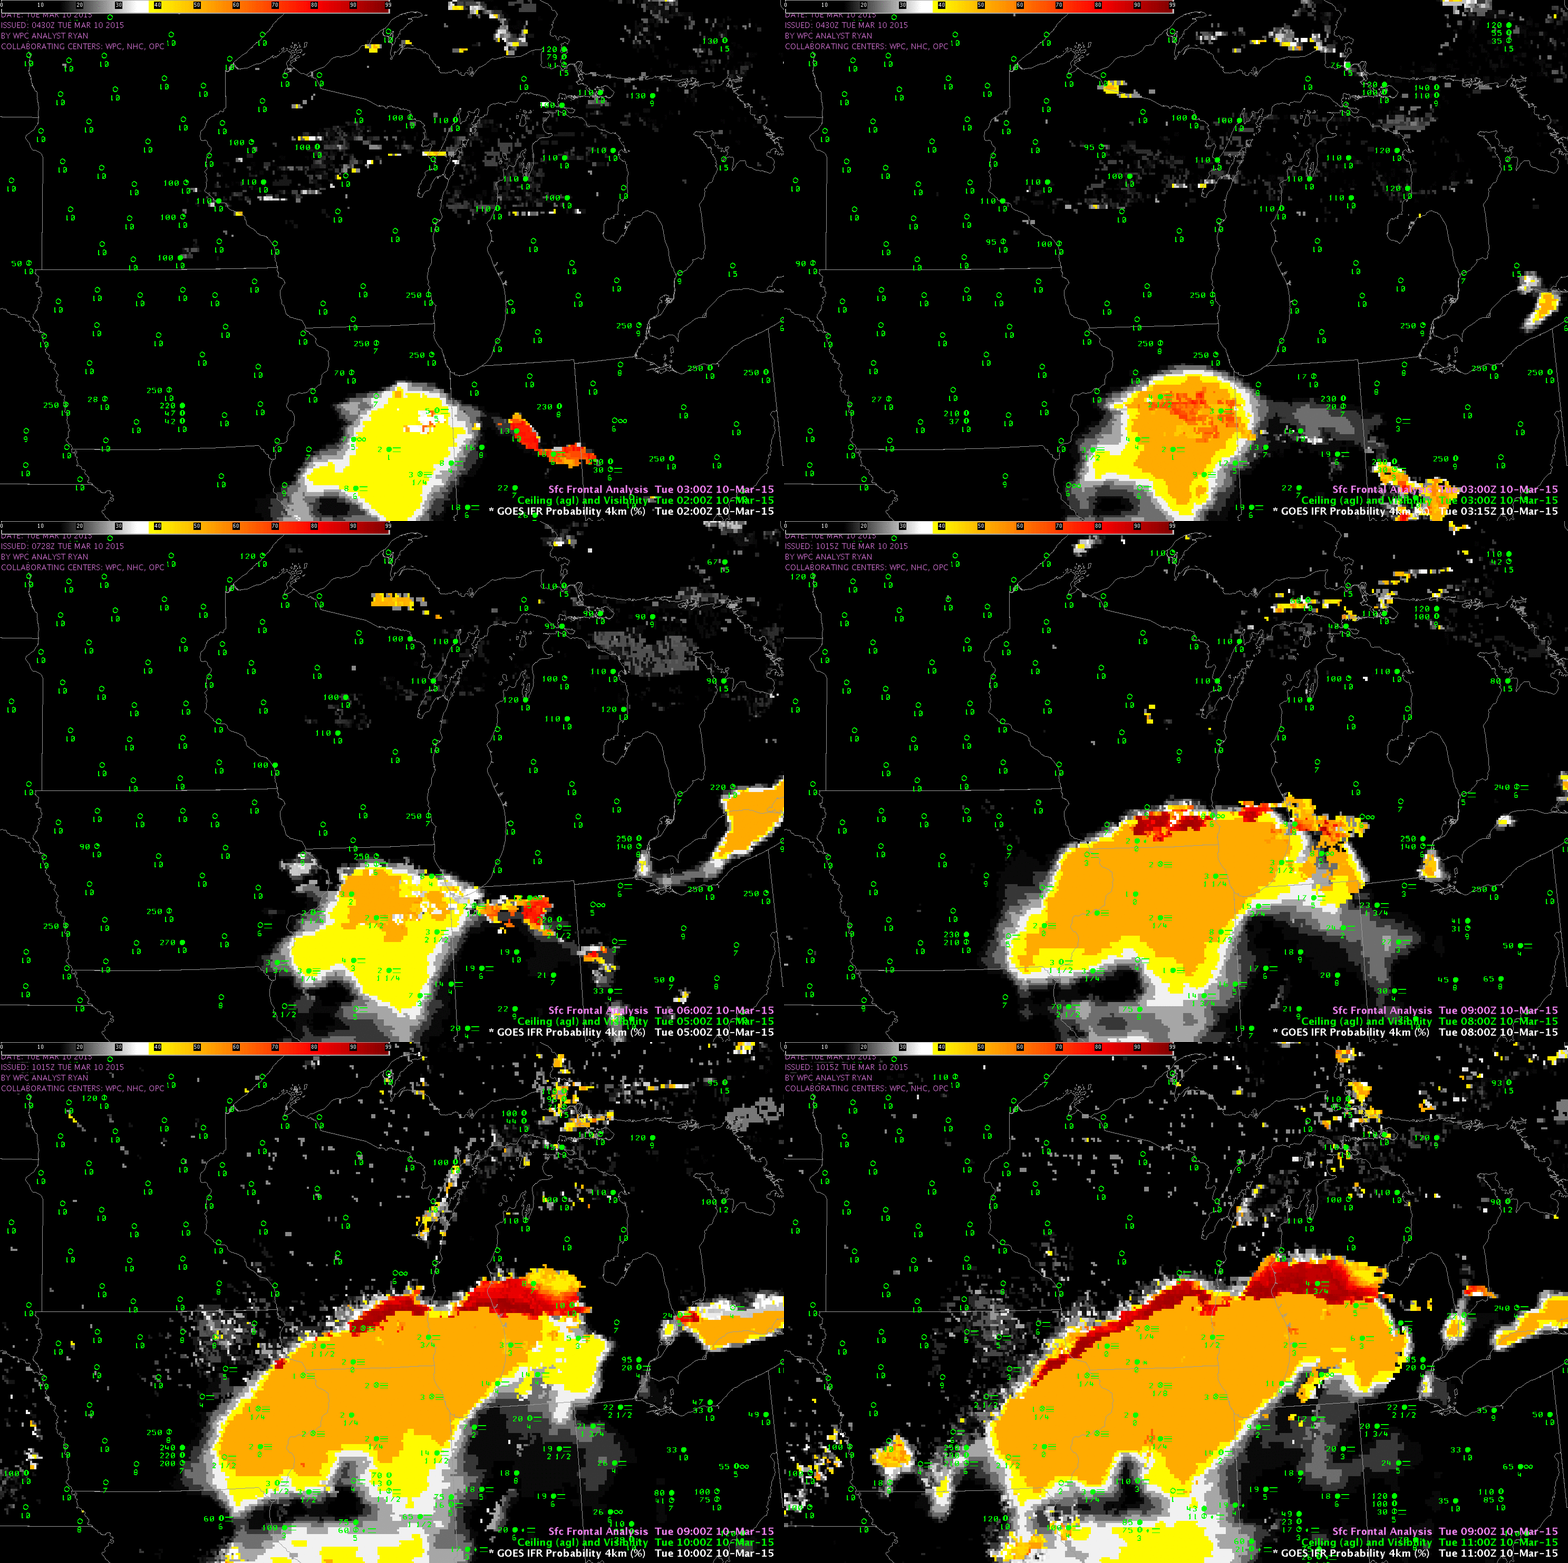
GOES-R IFR Probability Fields, 0200-1100 UTC on 10 March 2015, along with surface observations of ceilings and visibilities (Click to enlarge)

A region of dense fog/low clouds moved northward overnight through Illinois and into Wisconsin. Its movement northward was captured accurately by the GOES-R IFR Probability fields, above. IFR conditions develop as the region of high IFR Probability moves overhead. In addition, as the IFR Probability fields move northward, ceilings and visibilities along its southern flank improve. That is, the IFR Probability fields capture the northward motion of improving visibilities over Illinois. Detecting when visibilities improve is as important as detecting when visibilities deteriorate, and the GOES-R IFR Probability field in this case is doing both.

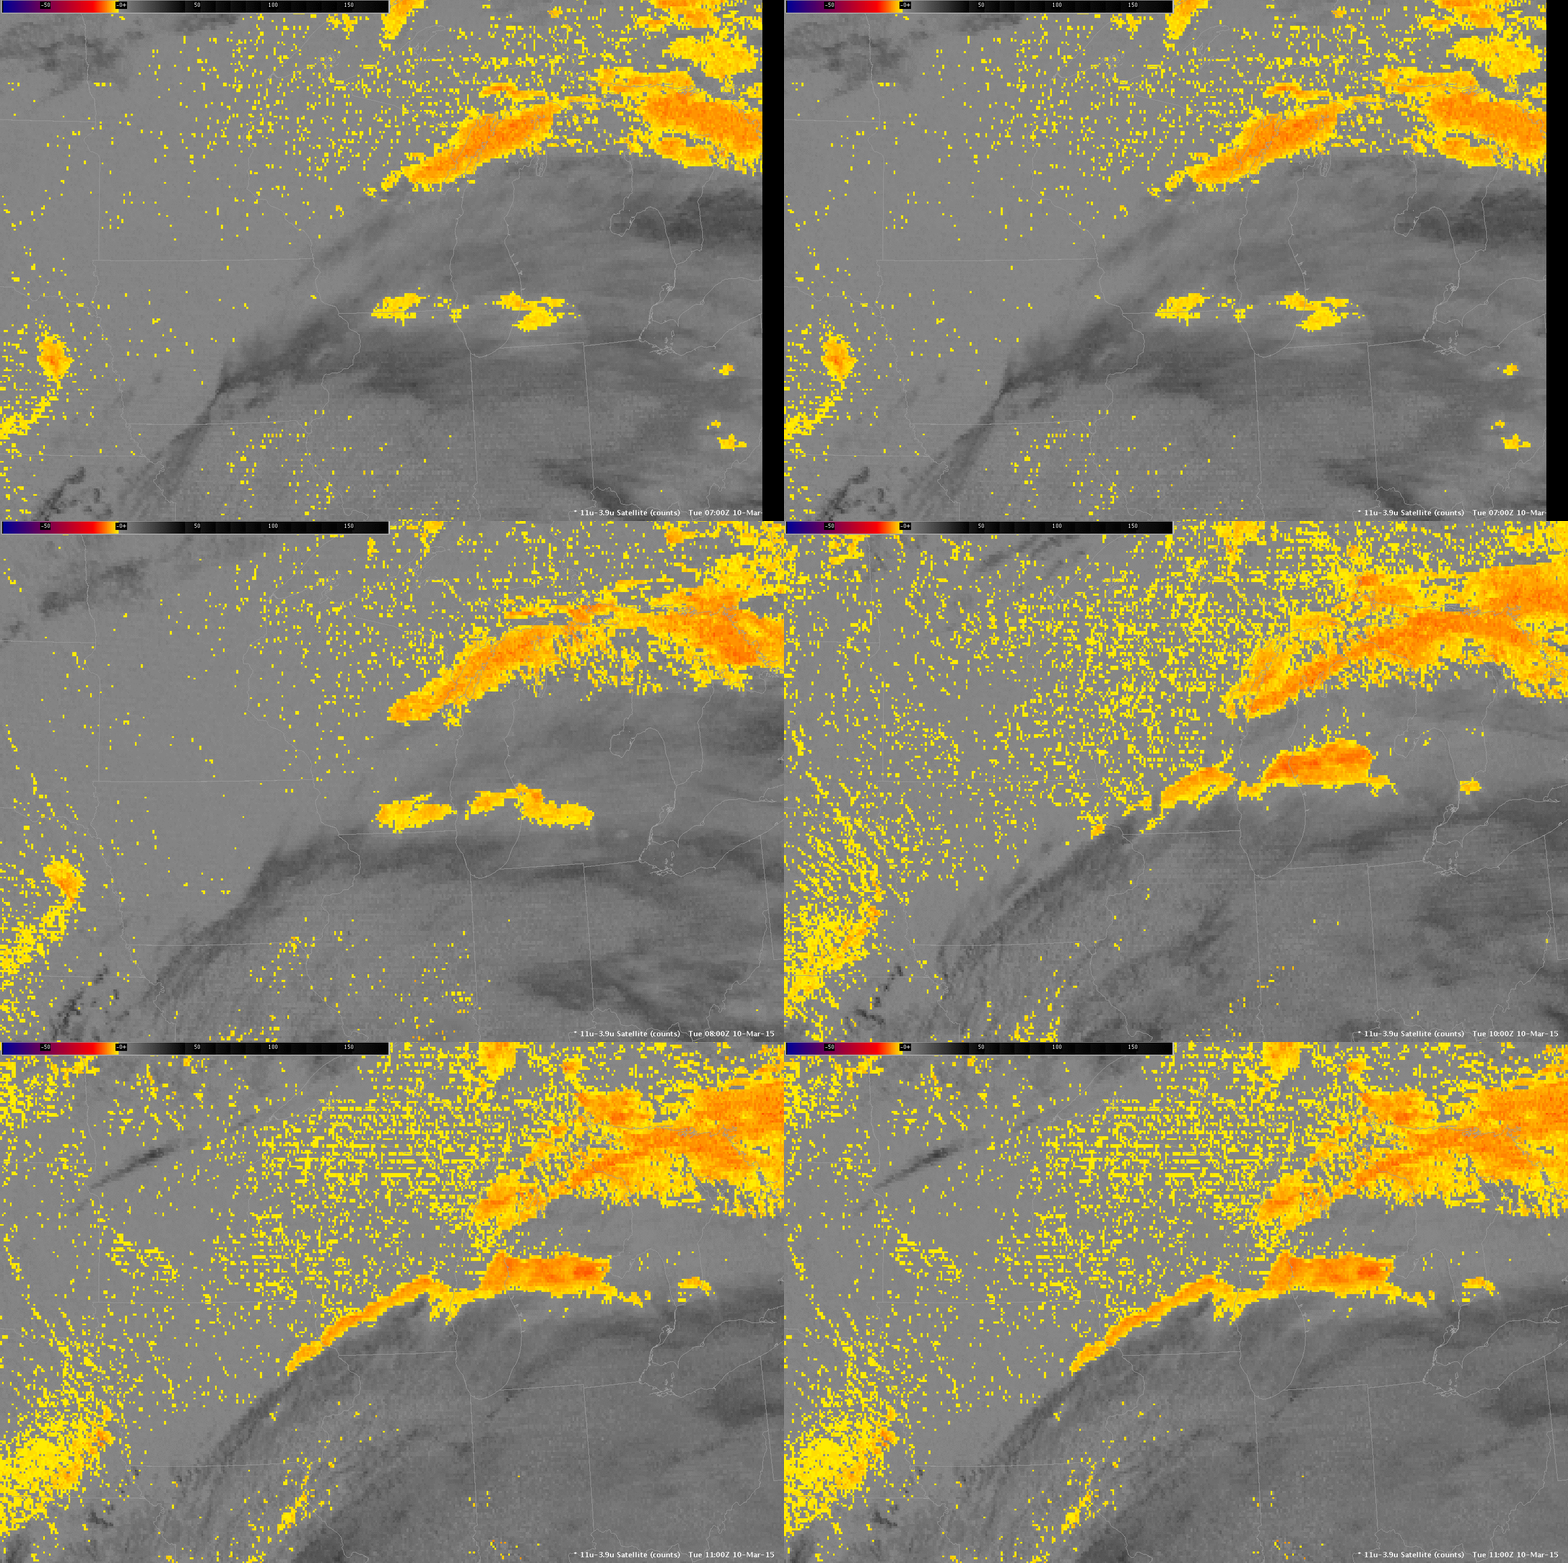
Compare that to the traditional method of detecting low clouds, the brightness temperature difference field, shown below. Low stratus and fog along the northern edge of the cirrus shield is detected, but the northward movement of the southern edge of the IFR conditions cannot be detected under the cirrus.

BTD_1100_10March2015_7_11

GOES-East Brightness Temperature Difference Fields (10.7µm – 3.9µm), 0700-1100 UTC, 10 March 2015 (Click to enlarge)

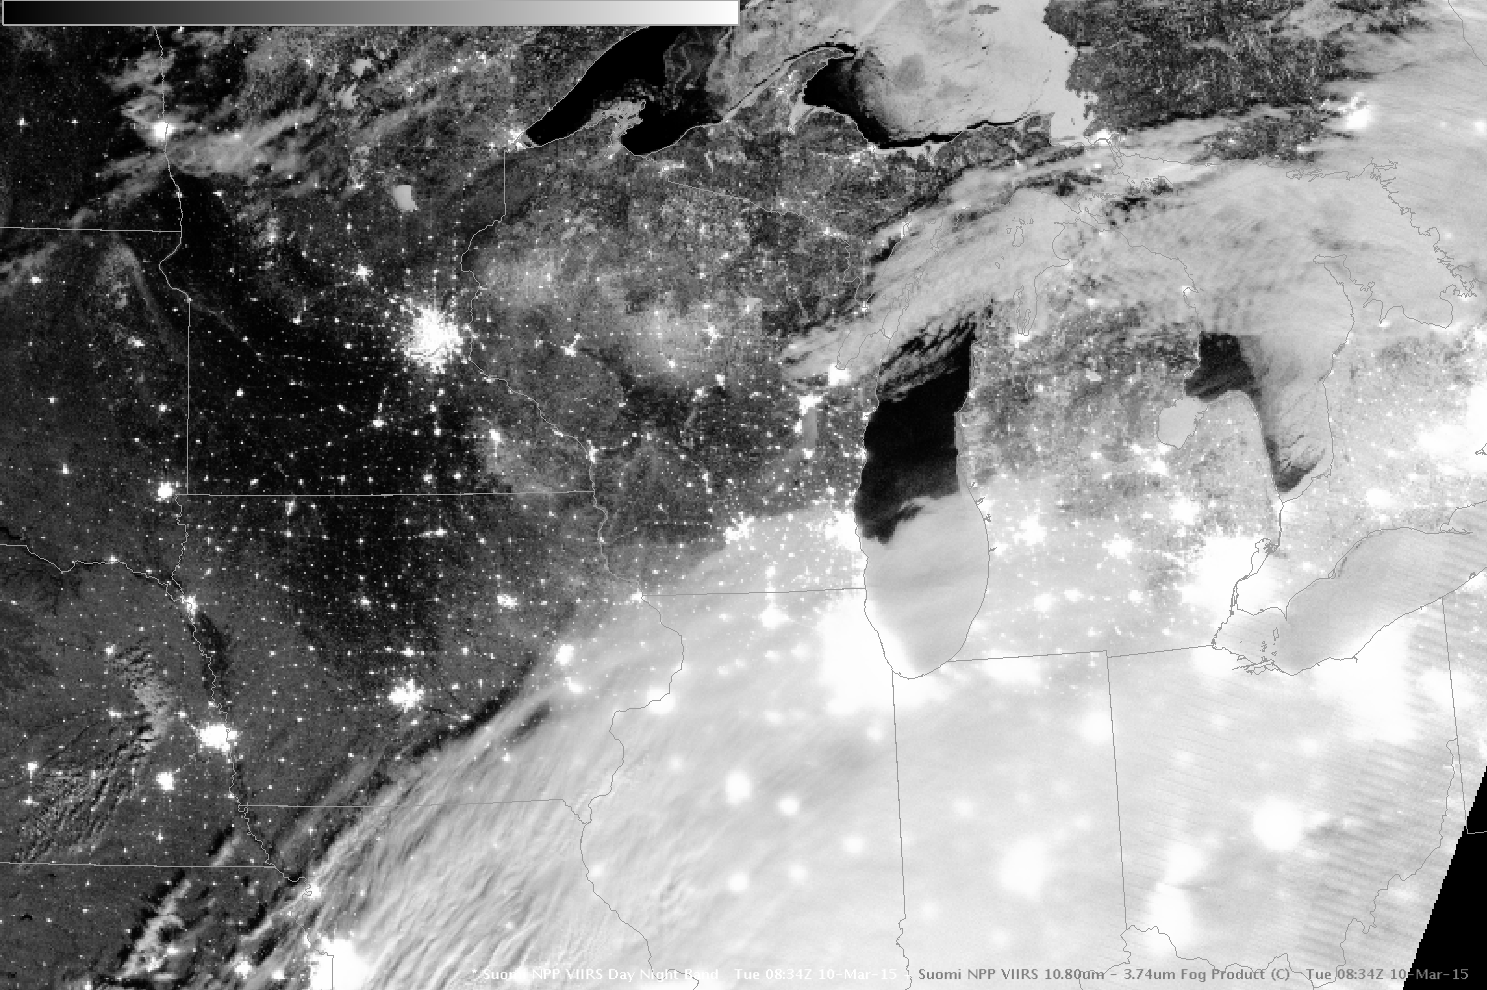
Suomi-NPP overflew the region at 0830 UTC, just as the fog was moving into southern Wisconsin. The image below shows the extensive cloud field.  The brightness temperature difference field (11.32µm – 3.74µm) (here) for the same time suggests that much of the cloudiness detected over Illinois is higher cloud.

SNPP_DNB_0834_10March2015

Suomi NPP Day Night Band (0.70 µm) imagery, 0334 UTC on 10 March 2015 (Click to enlarge)

Using IFR Probability to distinguish between low stratus and mid-level stratus

IFR_GOES_0700_23Jan2015

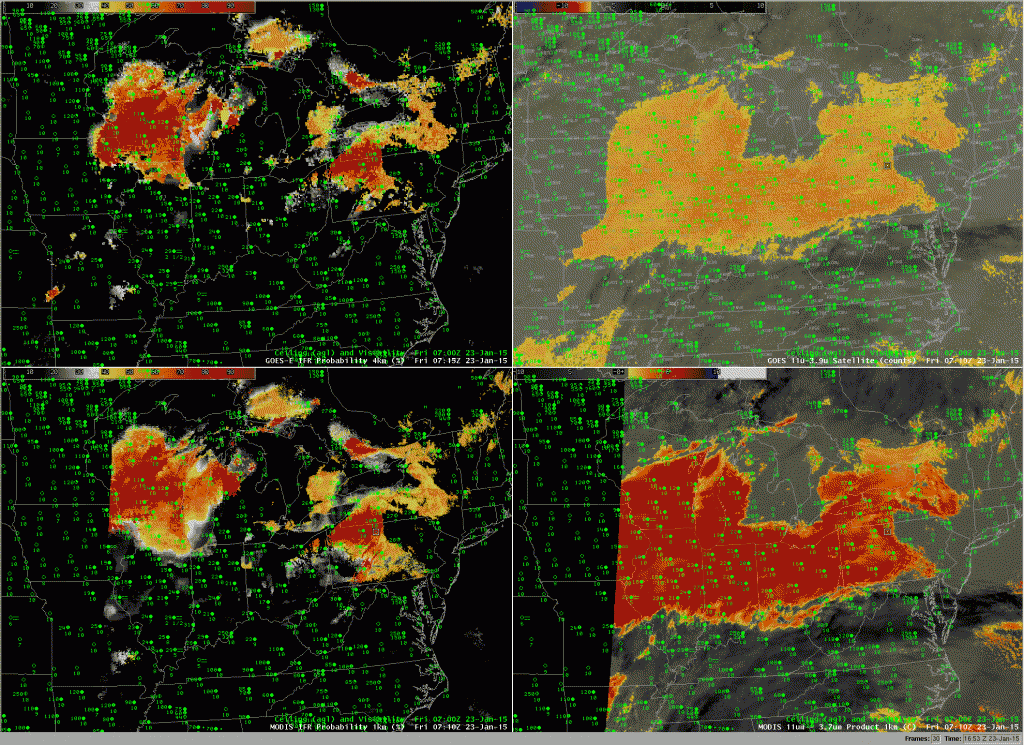
GOES-based IFR Probability (Upper Left), GOES-13 Brightness Temperature Difference (10.7µm – 3.9µm) (Upper Right), Aqua MODIS-based IFR Probability (Lower Left), Aqua MODIS Brightness Temperature Difference (11µm – 3.7µm) (Lower Right), all with observations of visibility and ceiling, around 0715 UTC 23 January 2015 (Click to enlarge)

The imagery above shows a stratus deck stretching from Wisconsin and Missouri to New York. Both MODIS and GOES Brightness Temperature Difference fields show strong returns that suggest the presence of stratus clouds comprised of water droplets (owing to the difference in emissivity from small droplets at 3.9µm and at 10.7µm). But what about the cloud base, a parameter that is very difficult to determine from satellite data alone?

IFR Probabilities suggest differences in the cloud bases. Highest probabilities are over Wisconsin — where ceilings are around 1000 feet, and where fog is reported (at Lone Rock). Over Indiana and Ohio, IFR Probabilities are low, and ceilings are generally above 2000 feet. IFR Probabilities are higher over Pennsylvania and New York, where ceilings drop again to 600-1000 feet, and where fog is again reported (At Dubois).

The inclusion of surface moisture information (from the Rapid Refresh Model) in the IFR Probability fields allows the IFR Probability fields to better distinguish between low ceilings/fog (known transportation hazards) and higher ceilings in regions of stratus where satellite data alone shows little difference.

Advection Fog with a Cyclone over the Midwest

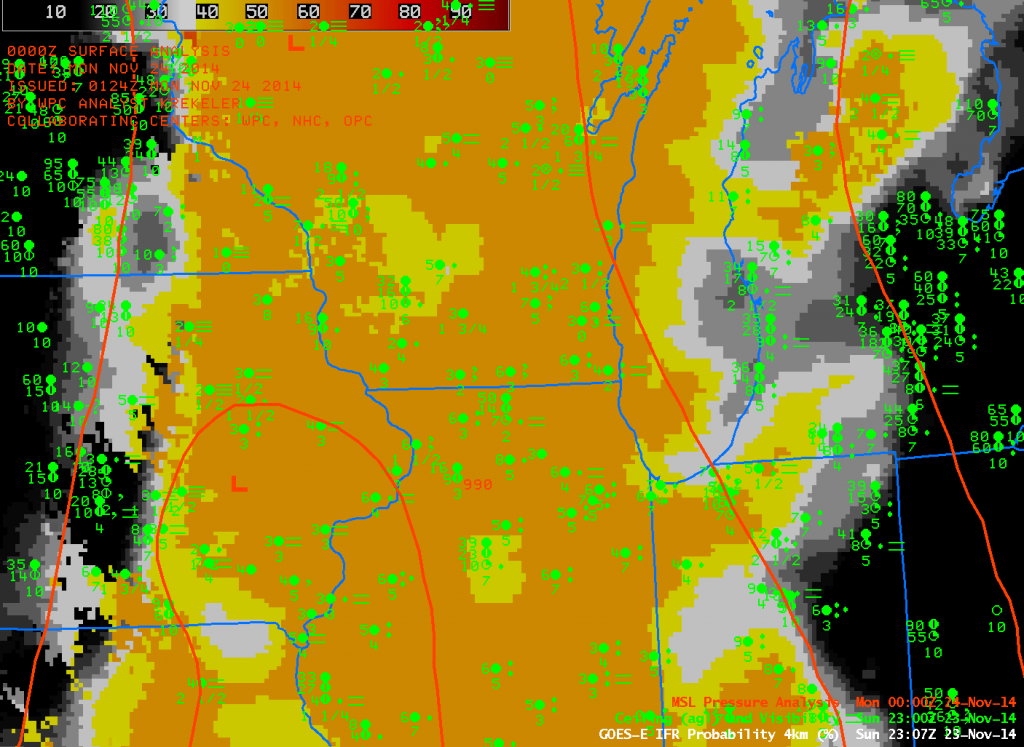
GOES_IFR_PROB_20141123_2307

GOES-based GOES-R IFR Probabilities and surface observations of Ceilings and Visibilities, ~2300 UTC, and the 0000 UTC HPC Analysis of surface pressure (Click to Enlarge)

In the image above, a trough of low pressure is depicted along the Mississippi River, with moist southerly flow over the Ohio Valley and Western Great Lakes (Dewpoints in Wisconsin at this time were mid- to upper-40s (Fahrenheit). This moist air is easily cooled to its dewpoint by the underlying cool ground, and dense fog is a result. However, this fog is difficult to detect from satellite because of the multiple cloud layers that accompany low pressure systems. GOES-R IFR Probabilities show a good signal because of Fog Predictors that are derived from numerical model output (the numerical model used is the Rapid Refresh). In this case, the Rapid Refresh was accurately depicting the evolution of the system because the model-based field of IFR Probabilities accurately overlaps the region of observed IFR (and near-IFR) conditions.

IFR Probabilities with a strong extratropical cyclone

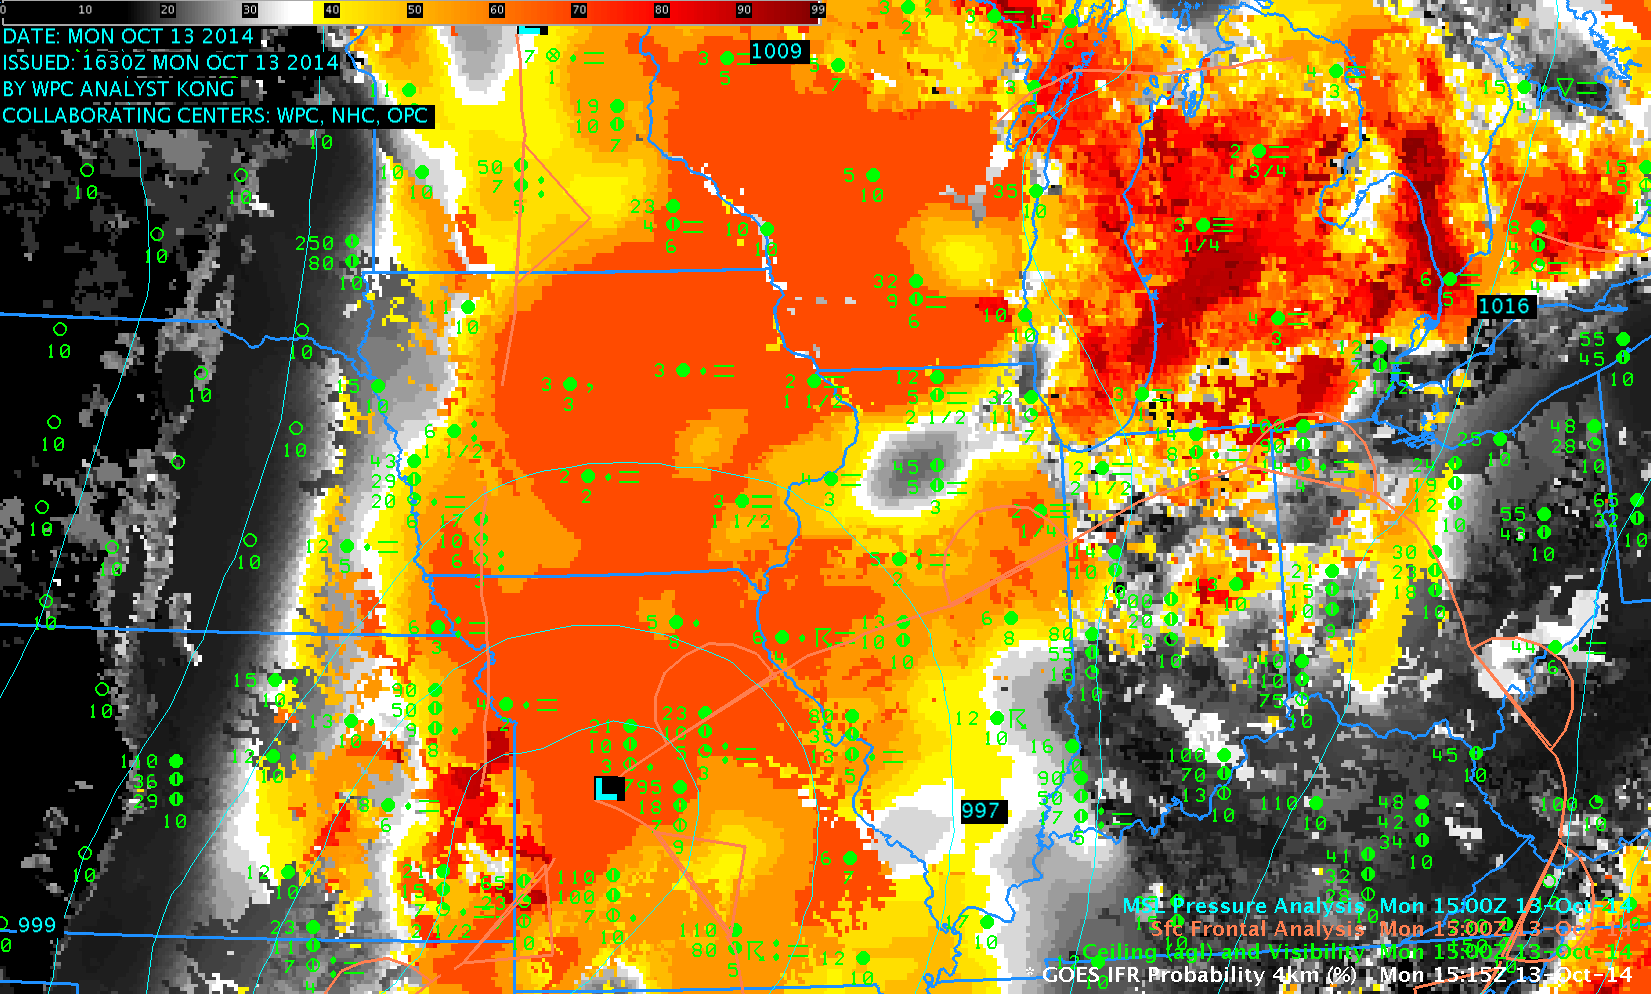
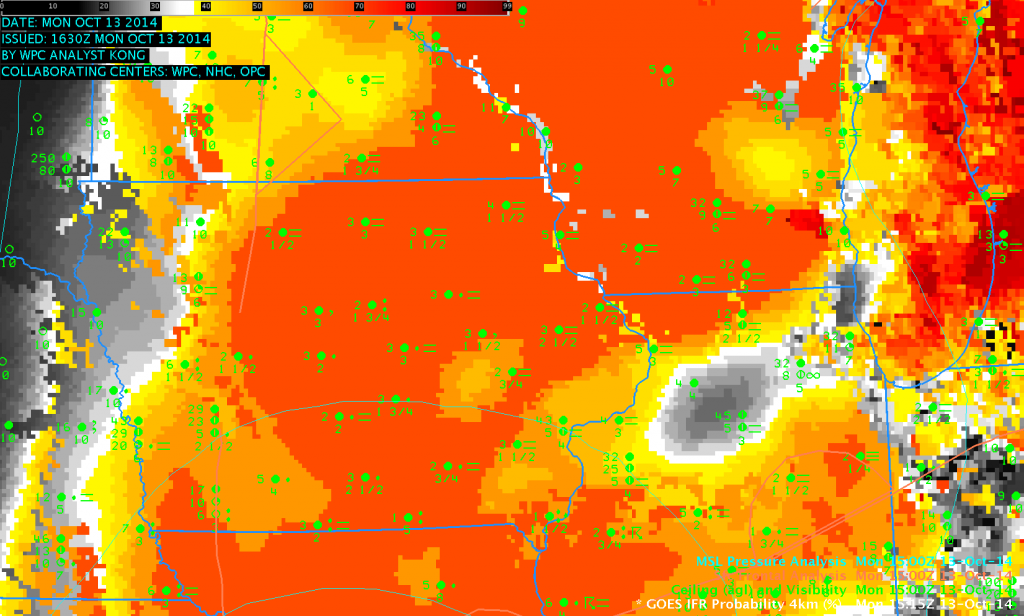
GOES_IFR_1515UTC_13Oct2014

GOES-R IFR Probabilities over the upper Midwest, 1515 UTC on 13 October 2014, along with surface reports of Ceilings and Visibilities, and HPC Frontal / Pressure analyses (Click to enlarge)

Strong low pressure systems can cause IFR conditions over large areas, but the multiple cloud layers that accompany extratropical cyclogenesis make difficult the observation of low stratus, because higher cloud decks are invariably in the way of the satellite’s view. For such systems, inclusion of Rapid Refresh Data as a way of detecting low-level saturation is a must. In the imagery above, note that the highest IFR Probabilities are between the warm front (that emerges from the low in Missouri and stretches into Illinois and Indiana) and the trough that extends north of the low in Missouri.

A zoomed-in view of the above image, below, centered over Iowa, does show good spatial correlation between observed IFR conditions and high IFR Probabilities. This suggests that the Rapid Refresh Model is accurately simulating the evolution of the strong storm in Missouri.

GOES_IFR_ZOOM_1515_13Oct2014

As above, but zoomed in over Iowa (Click to enlarge)

Comparing IFR Probabilities and Brightness Temperature Differences over Wisconsin

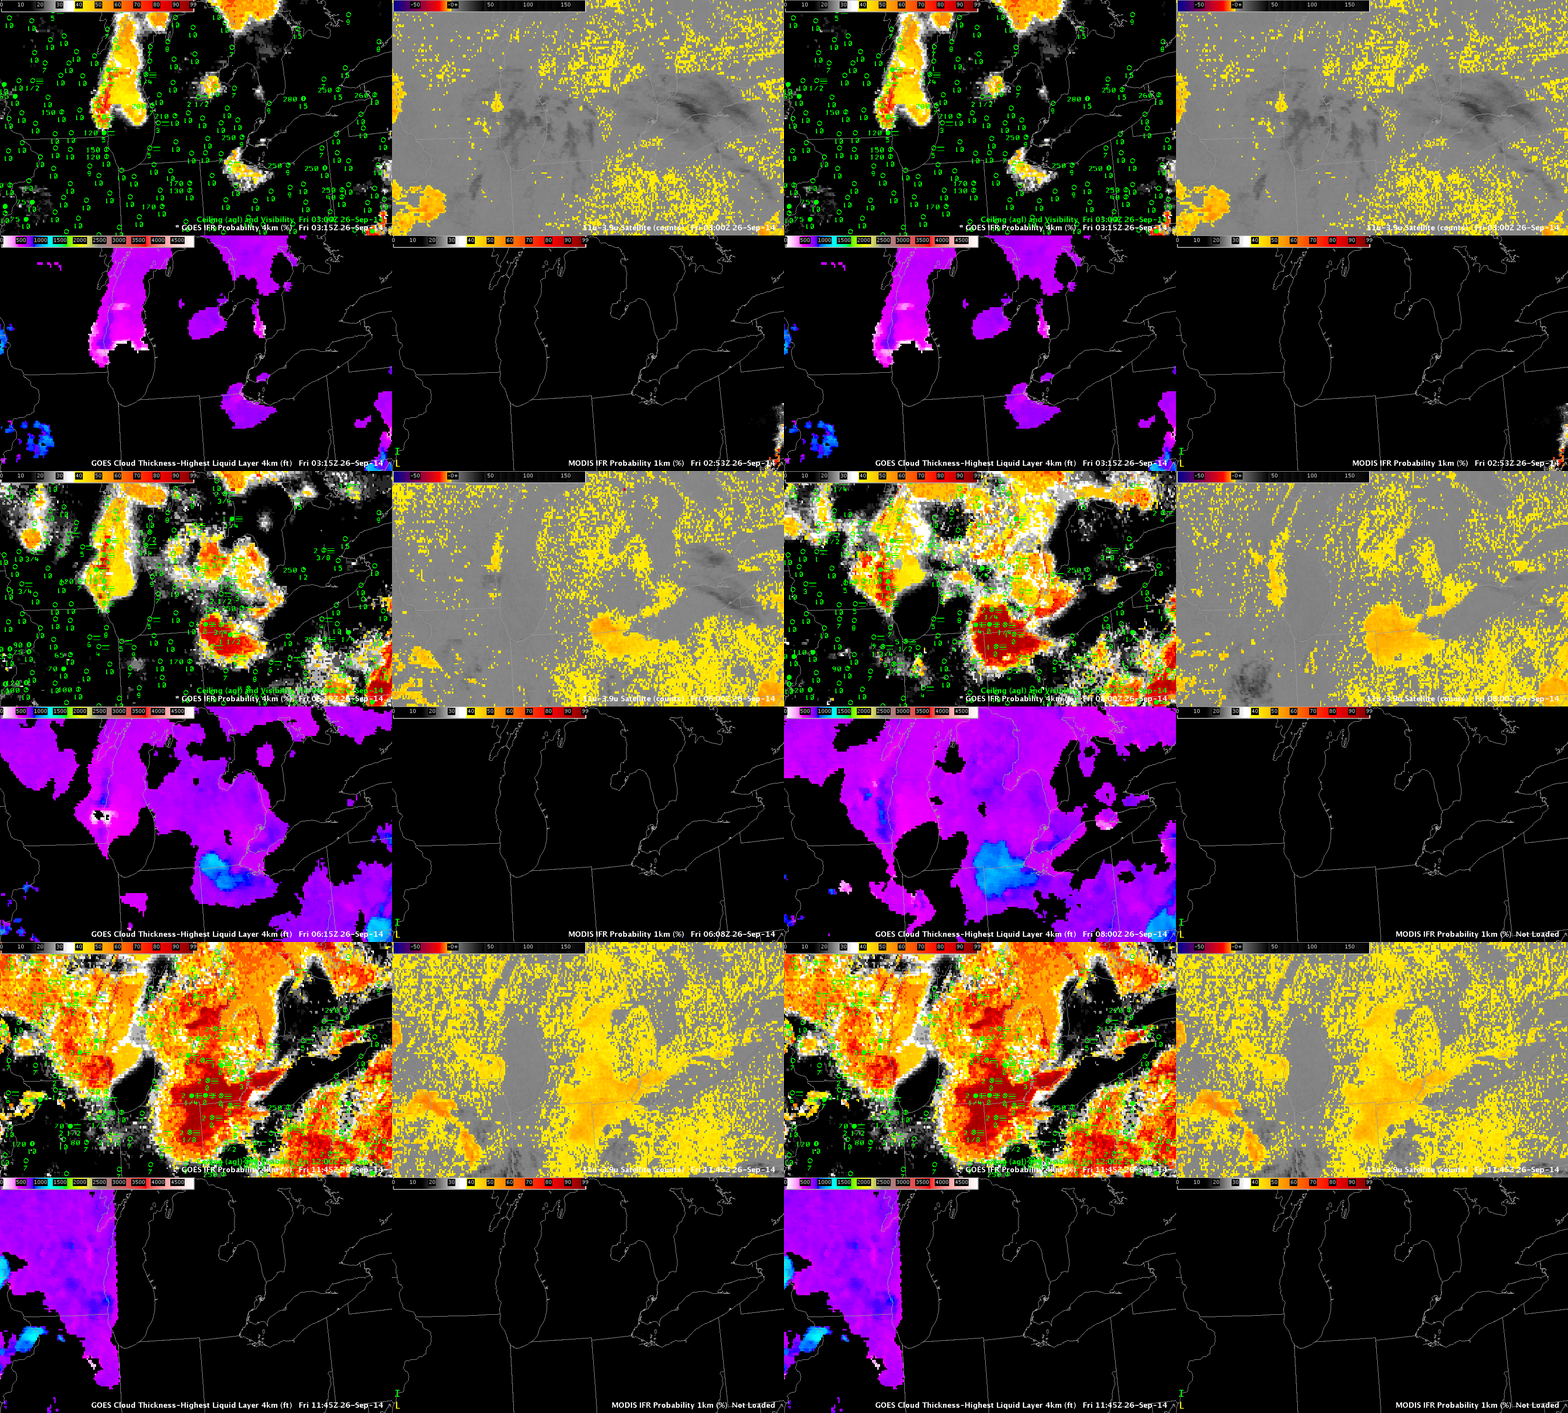
GOES_MODIS_IFR_PROB_26Sep2014_03-11

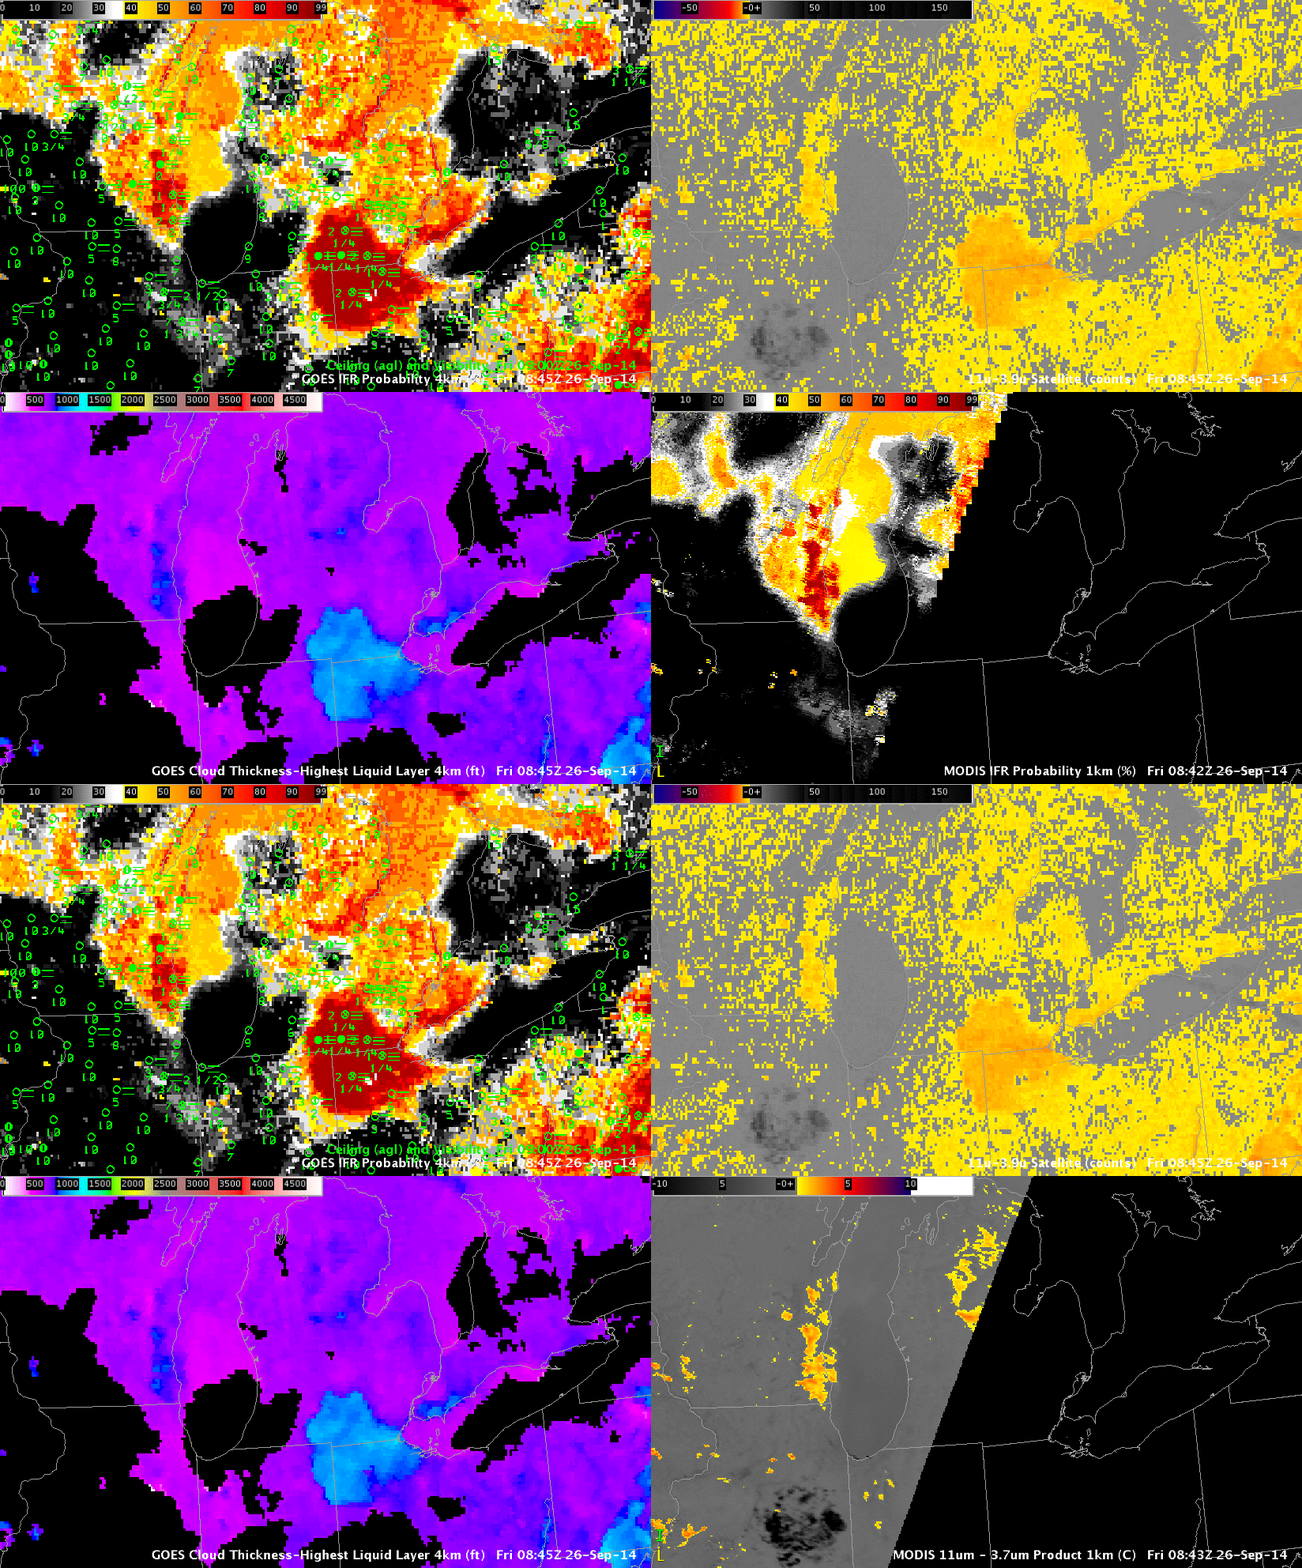
GOES-R IFR Probabilities computed from GOES-East (Upper Left), GOES-13 Brightness Temperature Difference (10.7 µm – 3.9 µm) (Upper Right), GOES-R Cloud Thickness computed from GOES-East (Lower Left), GOES-R IFR Probabilities computed from MODIS (Lower Right), hourly from 0300 through 1200 UTC 26 September (Click to enlarge)

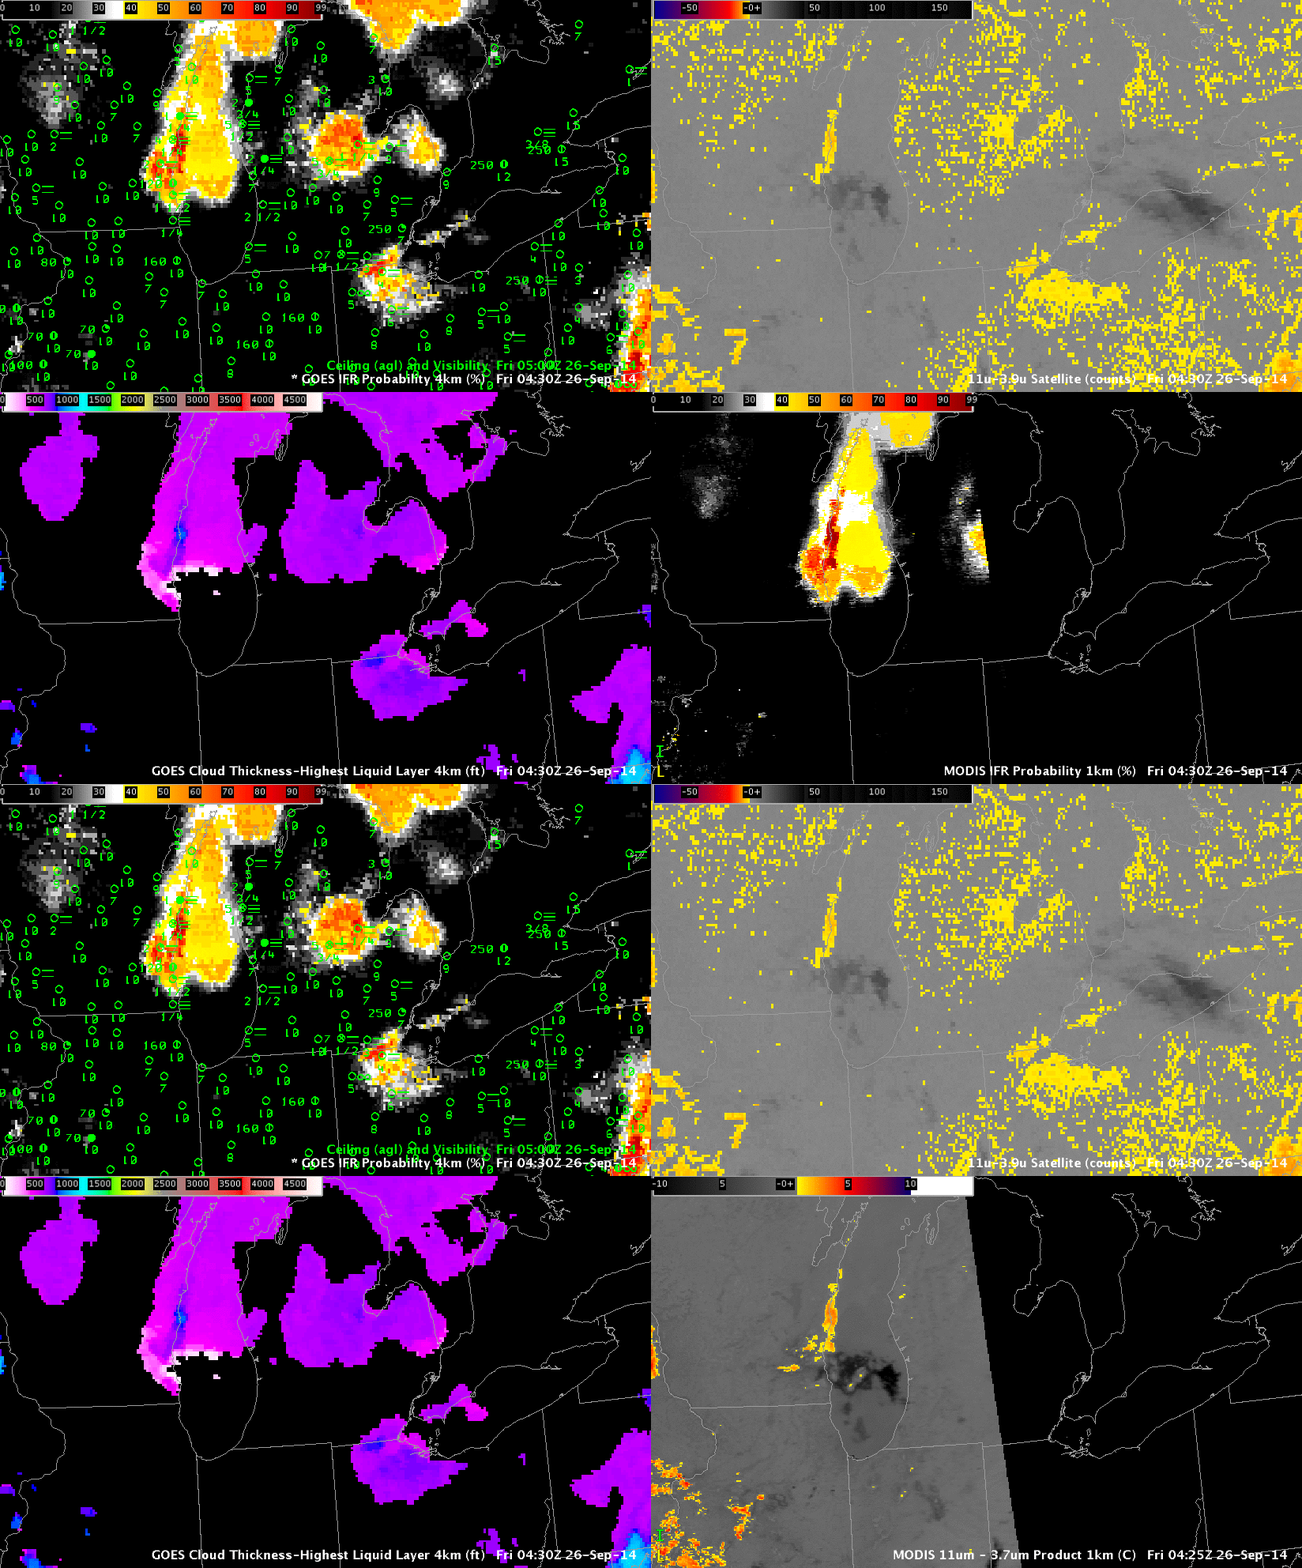
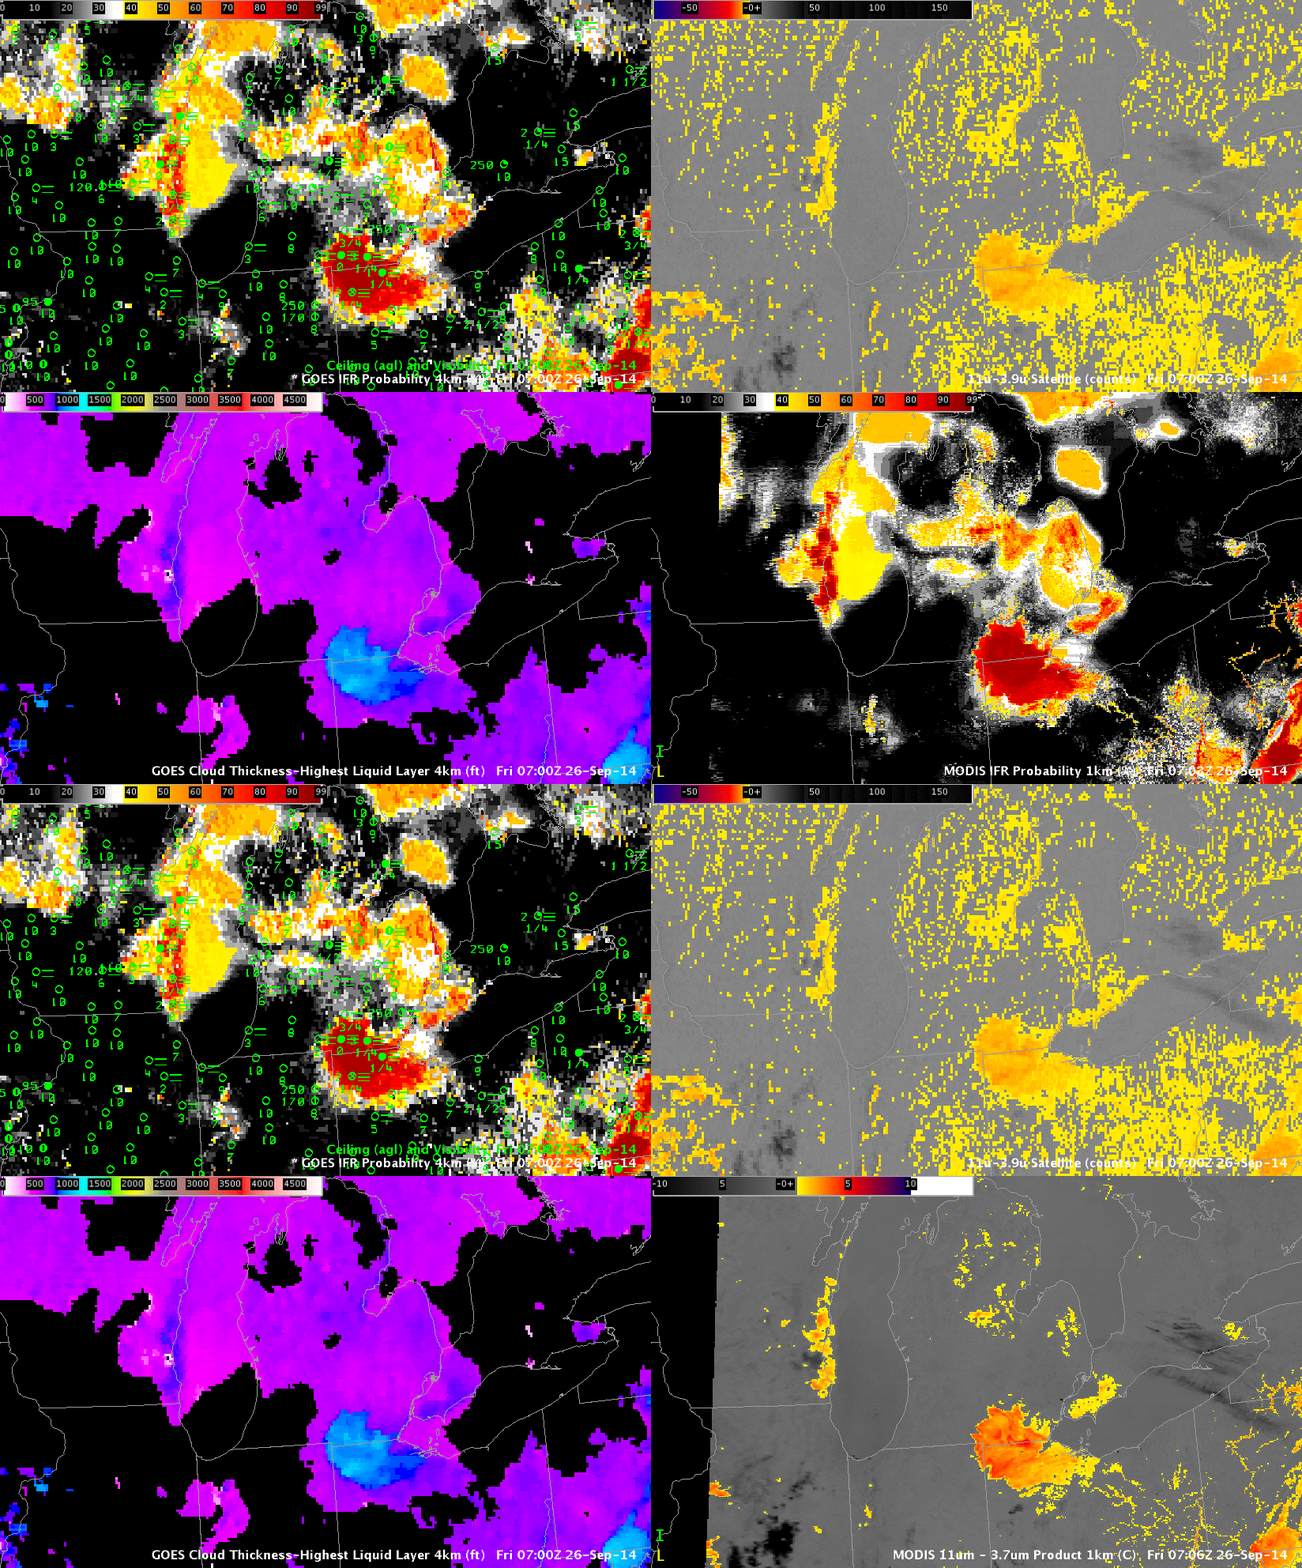
Fog developed over southeast Wisconsin during the morning of 26 September 2014. The GOES-R IFR Probability fields did a better job of detecting the hazard than did the traditional method of satellite-based fog detection (brightness temperature difference) in part because of the presence of higher clouds. (Fog/low stratus also generated IFR conditions over northeast Ohio). The animation above also includes a MODIS-based IFR Probability field. In fact, three separate MODIS-based fields were created, one at 0430 UTC, one at 0700 UTC, and one at 0845 UTC, shown below (Note that the MODIS-based IFR toggles with the MODIS Brightness Temperature Difference field). MODIS data confirms the small-scale nature of the fog event over southeast Wisconsin. (Note also how the MODIS-based data at 0700 UTC, below, are able to resolve the small river valleys in Pennsylvania in ways the GOES data cannot.)

Note how the IFR Probability fields ignore regions of mid-level stratus, such as over northeast Ohio along Lake Erie.

MODIS_BTDIFR_26Sept2014_0430

As above, but for 0430 UTC, and with the MODIS Brightness Temperature Difference in the lower right (Click to enlarge)

MODIS_BTDIFR_26Sept2014_0700

As above, but for 0700 UTC, and with the MODIS Brightness Temperature Difference in the lower right (Click to enlarge)

MODIS_BTDIFR_26Sept2014_0845

As above, but for 0845 UTC, and with the MODIS Brightness Temperature Difference in the lower right (Click to enlarge)

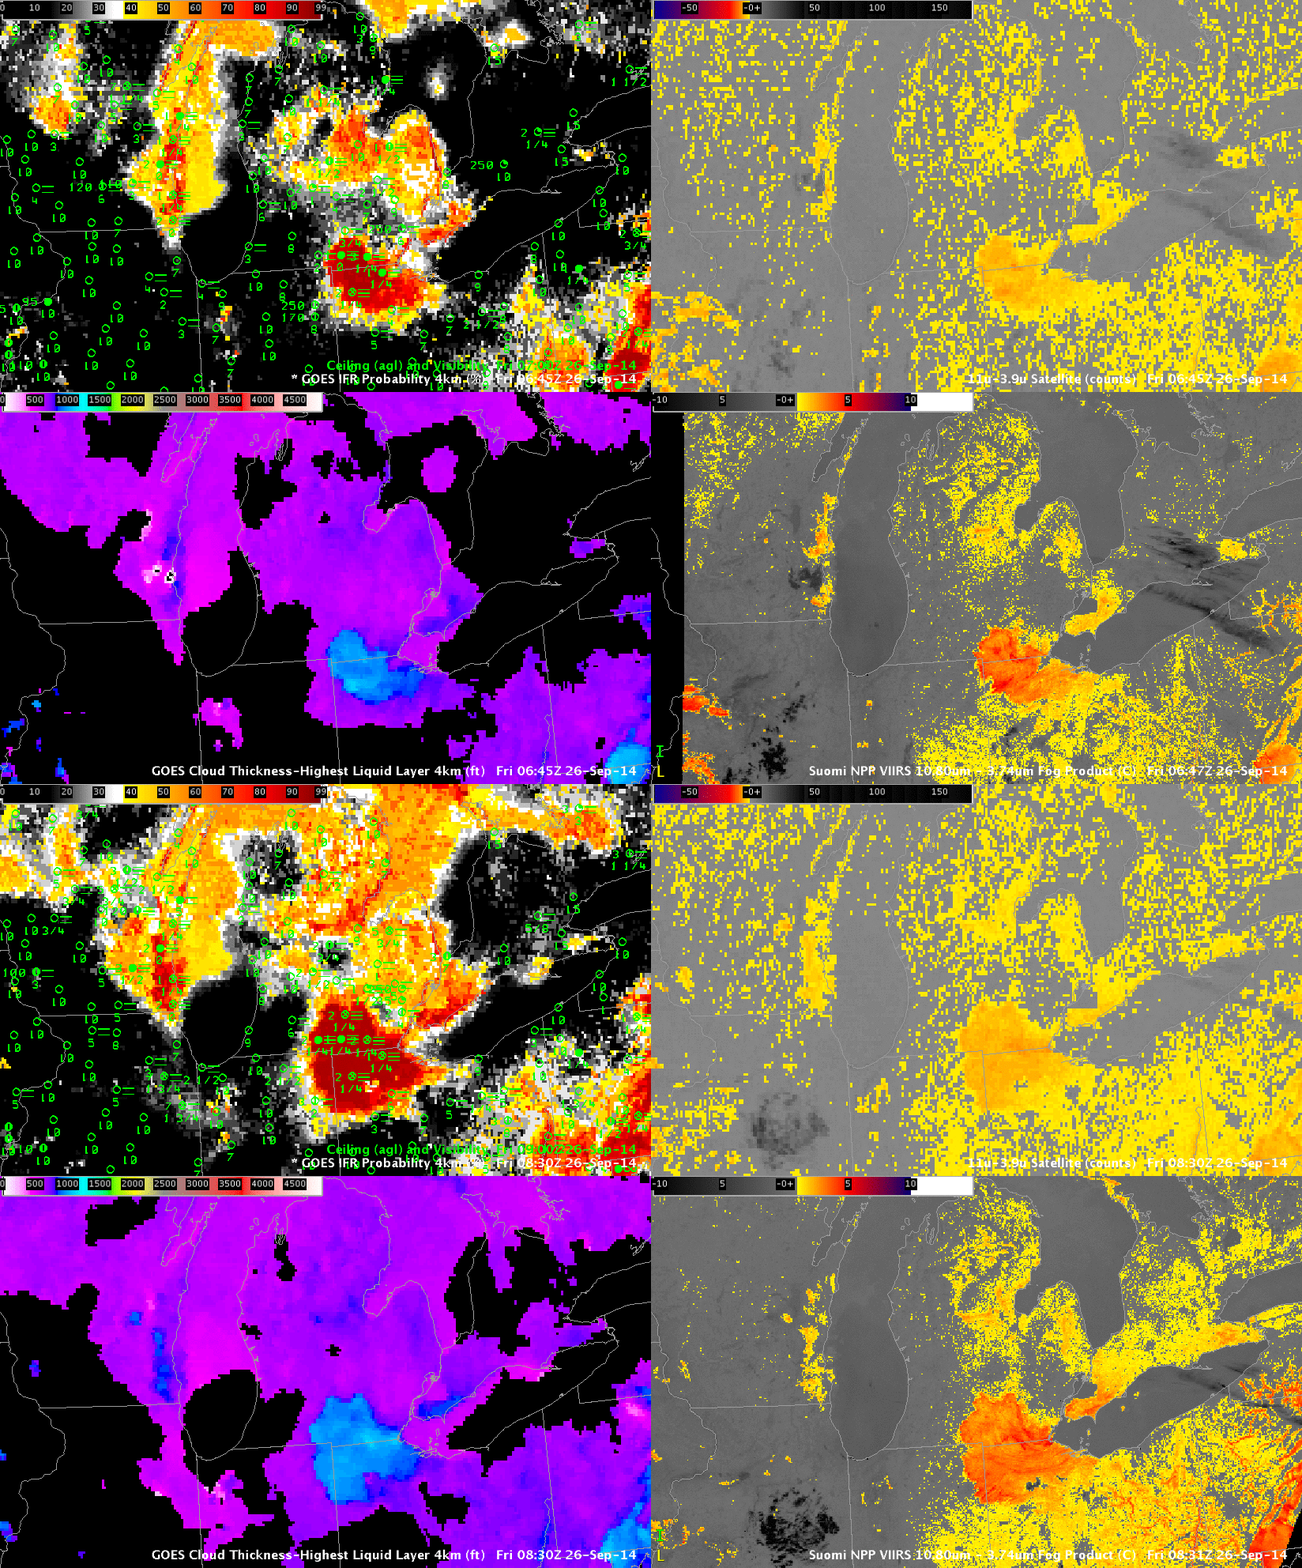
Suomi NPP Overflew the region as well. GOES-R IFR Probability algorithms do not yet incorporate Suomi NPP data; when that happens, an early morning snapshot that complements MODIS overpasses will be available.

SNPP_BTD_26Sept2014loop

As up top, but with Suomi NPP Brightness Temperature Difference (11.35 µm- 3.74 µm) in the bottom right, times at 0647 and 0831 UTC 26 September (Click to enlarge)

Cloud Thickness as a Predictor of Fog Dissipation

GOES_R_Cloud_Thickness_1137UTC_18Sep2014

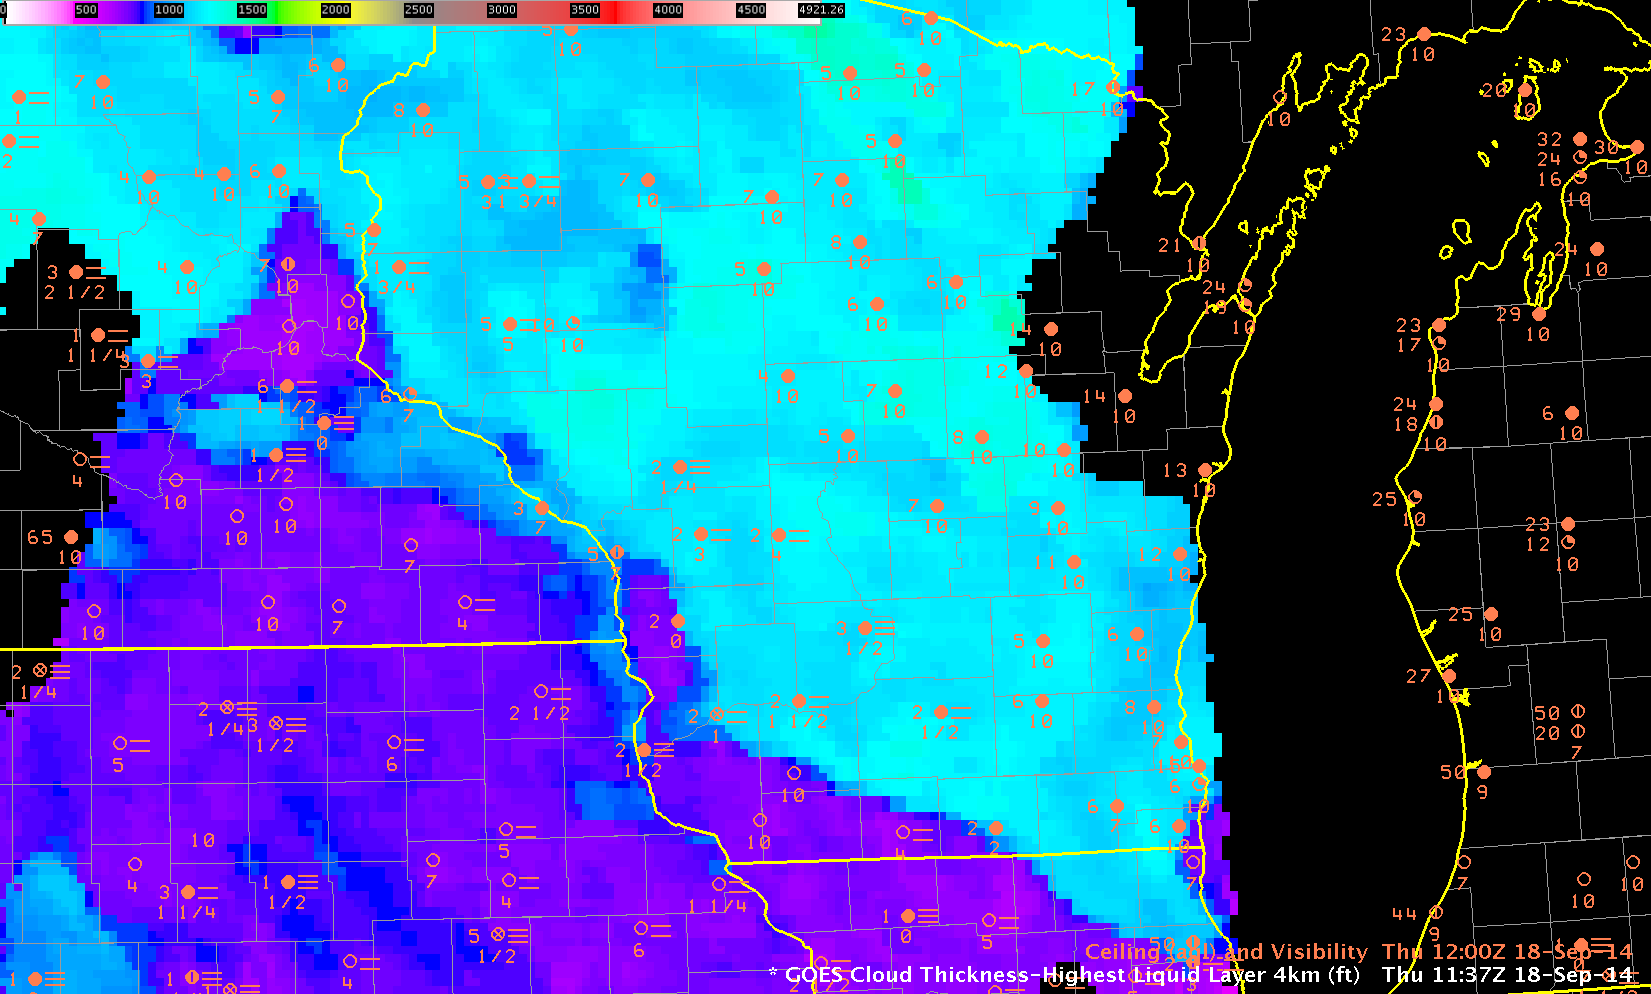
GOES-R Cloud Thickness over Wisconsin and surrounding States, 18 September 2014, just before sunrise (Click to enlarge)

GOES-R Cloud Thickness can be used as a predictor for dissipation time of Radiation Fog, using this chart and the thickness (as above) from the last pre-dawn GOES-R Cloud Thickness field (Recall that GOES-R Cloud Thickness is not computed in the few hours of twilight surrounding sunrise or sunset; in the image above, twilight has reached lower Michigan but not yet Wisconsin). However, it’s important to remember that the chart is valid for radiation fog. Other forcings might cause fog to dissipate (or persist).

In the example above, Cloud Thickness values ranges from around 700 over southwest Wisconsin to as much as 1400 over north-central Wisconsin. Most of south-central Wisconsin (cyan) has values around 1200. According to the best-fit line, that suggests a burn-off time of more than 5 hours (although those values are extrapolated; note that no values that large went into the creation of the best-fit line) over WI, except over southwestern WI where a burn-off time of less than 1 hour is predicted. Did that work out?

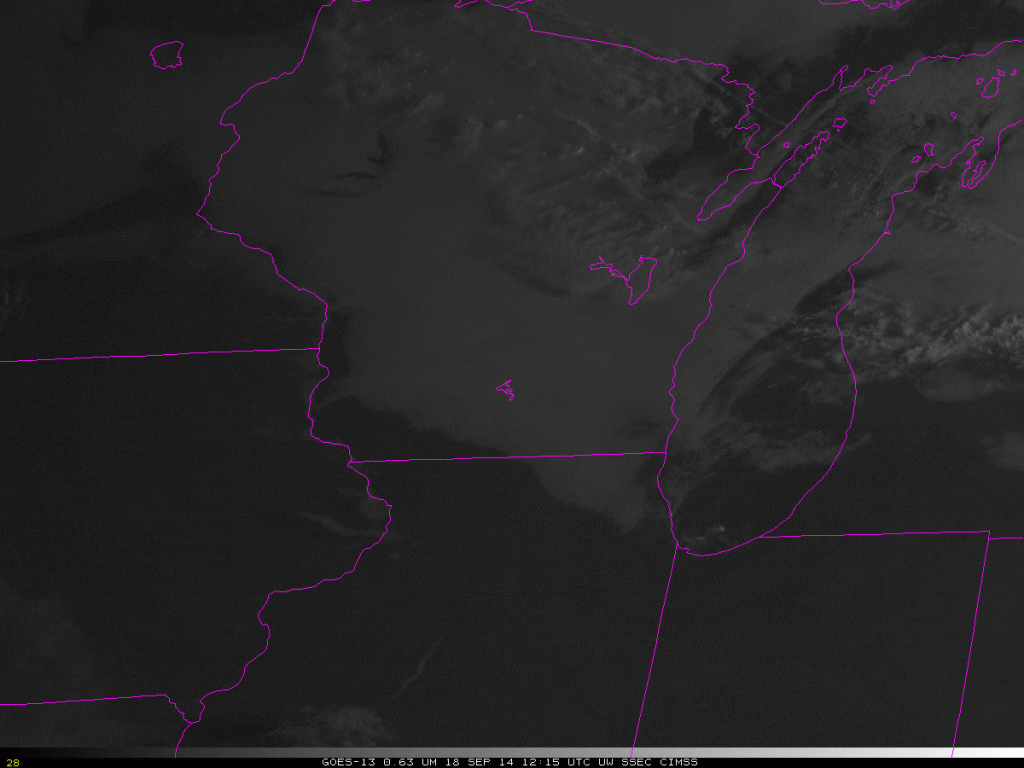
The animation below shows fog/low stratus moving towards the southwest with time. The cool and damp northeasterly flow from the Great Lakes into Wisconsin (surface map at 1800 UTC on 18 September) suppressed the heating necessary to reduce the relative humidity and foster fog evaporation. Perhaps the fog initially formed as advection fog; however, the northeasterly flow that developed early in the morning on 18 September came from a synoptic set-up that allowed fog to persist longer than the GOES-R Cloud Thickness algorithm suggests. This is not an uncommon occurrence. Clouds did not burn off over south-central WI until after 1800 UTC. During September, delayed burn-off of morning clouds can significantly affect the day-time temperature.

WIFOG_18Sep2014_12-20loop

Half-hourly visible imagery over Wisconsin, 1215-2045 UTC on 18 September (Click to animate)

=============================================================================

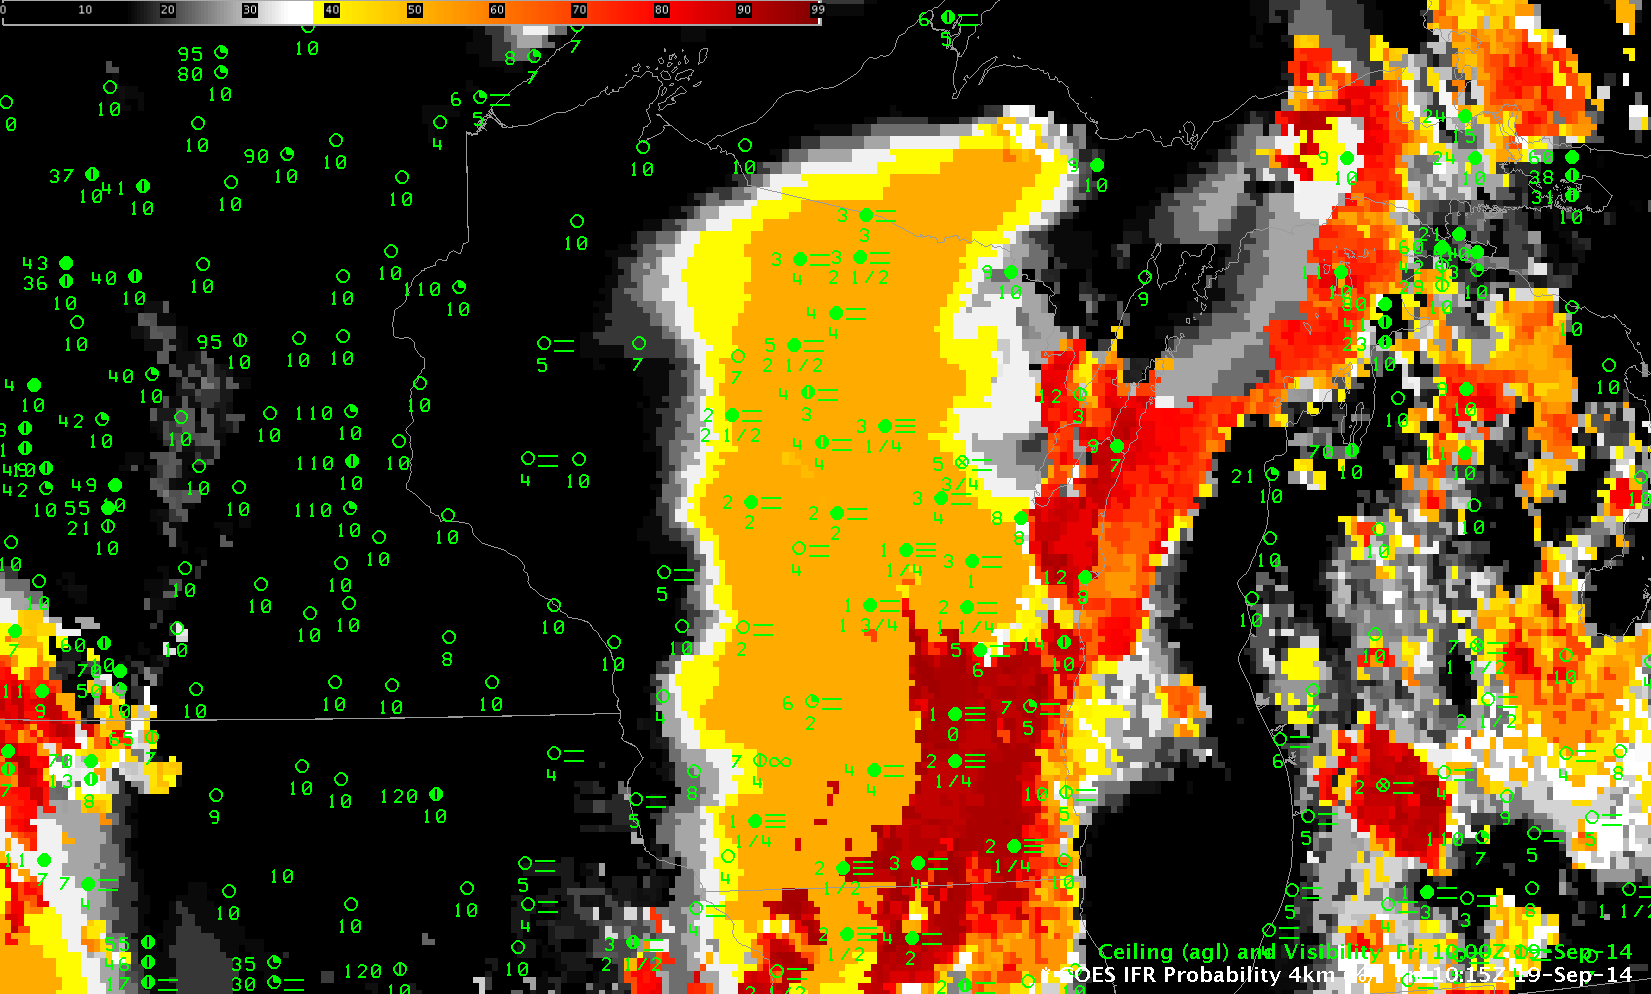
Low clouds and fog redeveloped during the morning of the 19th of September as well. This occurred during persistent southerly flow in advance of a low pressure system over the Northern Plains. The hourly animation of IFR Probabilities, below, shows IFR Probabilities developing over the course of the early morning of the 19th between 0315 and 1215 UTC. The animation shows a gradual overspreading of the IFR Probability field with higher clouds moving in from the west. (Here is a toggle between IFR Probability and GOES-13 Brightness Temperature Difference Fields at 1115 UTC; note how smooth the field is over much of WI where only Rapid Refresh model data can be used in the computation of the IFR Probability).

GOESR_IFRPROB_WI_19Sep2014_03-12

GOES-R IFR Probability fields, hourly from 0315-1215 UTC on 19 September (Click to animate)

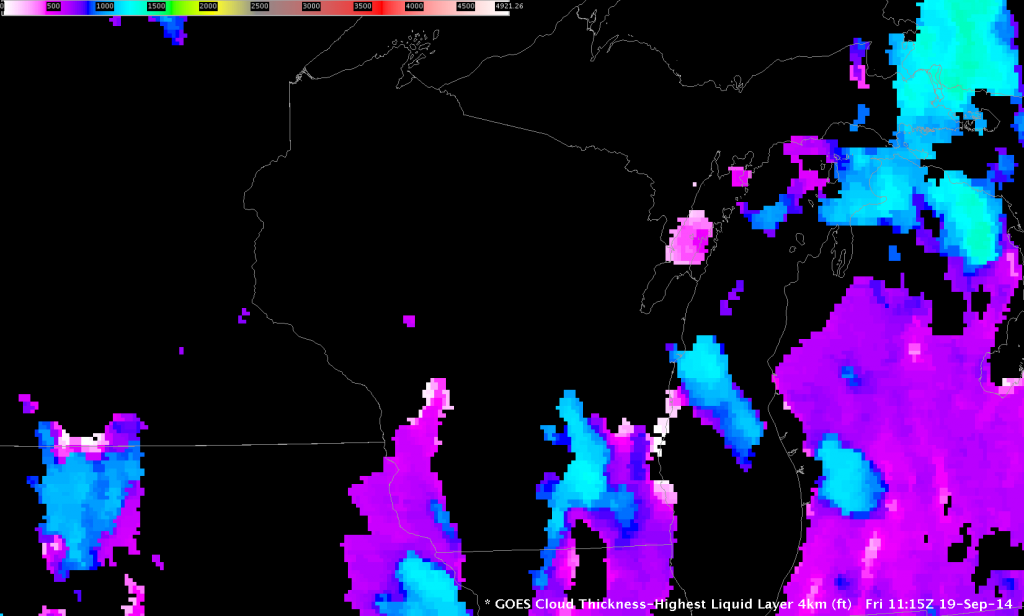
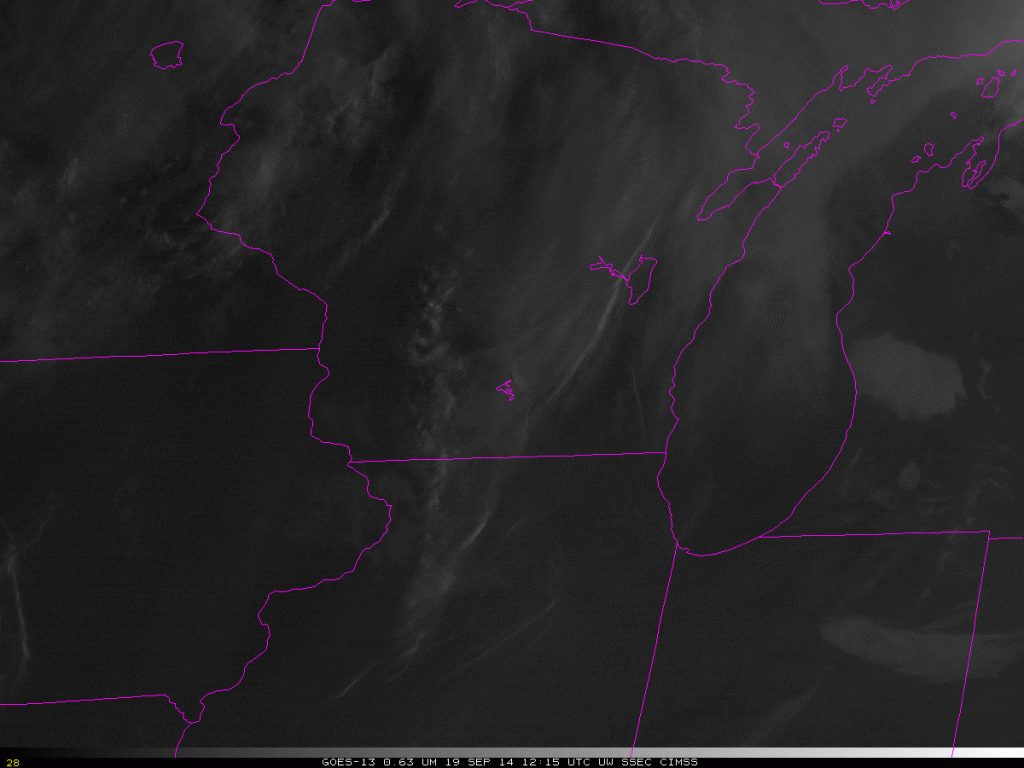
When high clouds overspread the scene, GOES-R Cloud Thickness is not computed. Thus, the last image before twilight, below, shows Cloud Thickness in only a few locations, but those values over southeast Wisconsin exceed 1200 feet, suggesting a burn-off of around 1615 UTC — 5 hours after this last Cloud Thickness image. In this case, that is an overestimate because the southerly winds over WI promote mixing, and the fog quickly dissipates after sunrise. It’s important to consider the synoptic forcing when you use Cloud Thickness. The last Cloud Thickness field and its use as a predictor for fog dissipation (using this chart) is most useful for radiation fog. The visible imagery animation at the bottom shows that the fog dissipated by 1415 UTC.

GOESR_CTH_WI_19Sept2014-9

GOES-R Cloud Thickness just before Sunrise (1115 UTC on 19 September 2015) (Click to enlarge)

WIFOG_19Sep2014_12-16loop

GOES-13 Visible Imagery, 1215-1615 UTC on 19 September (Click to animate)

Fog over Indiana

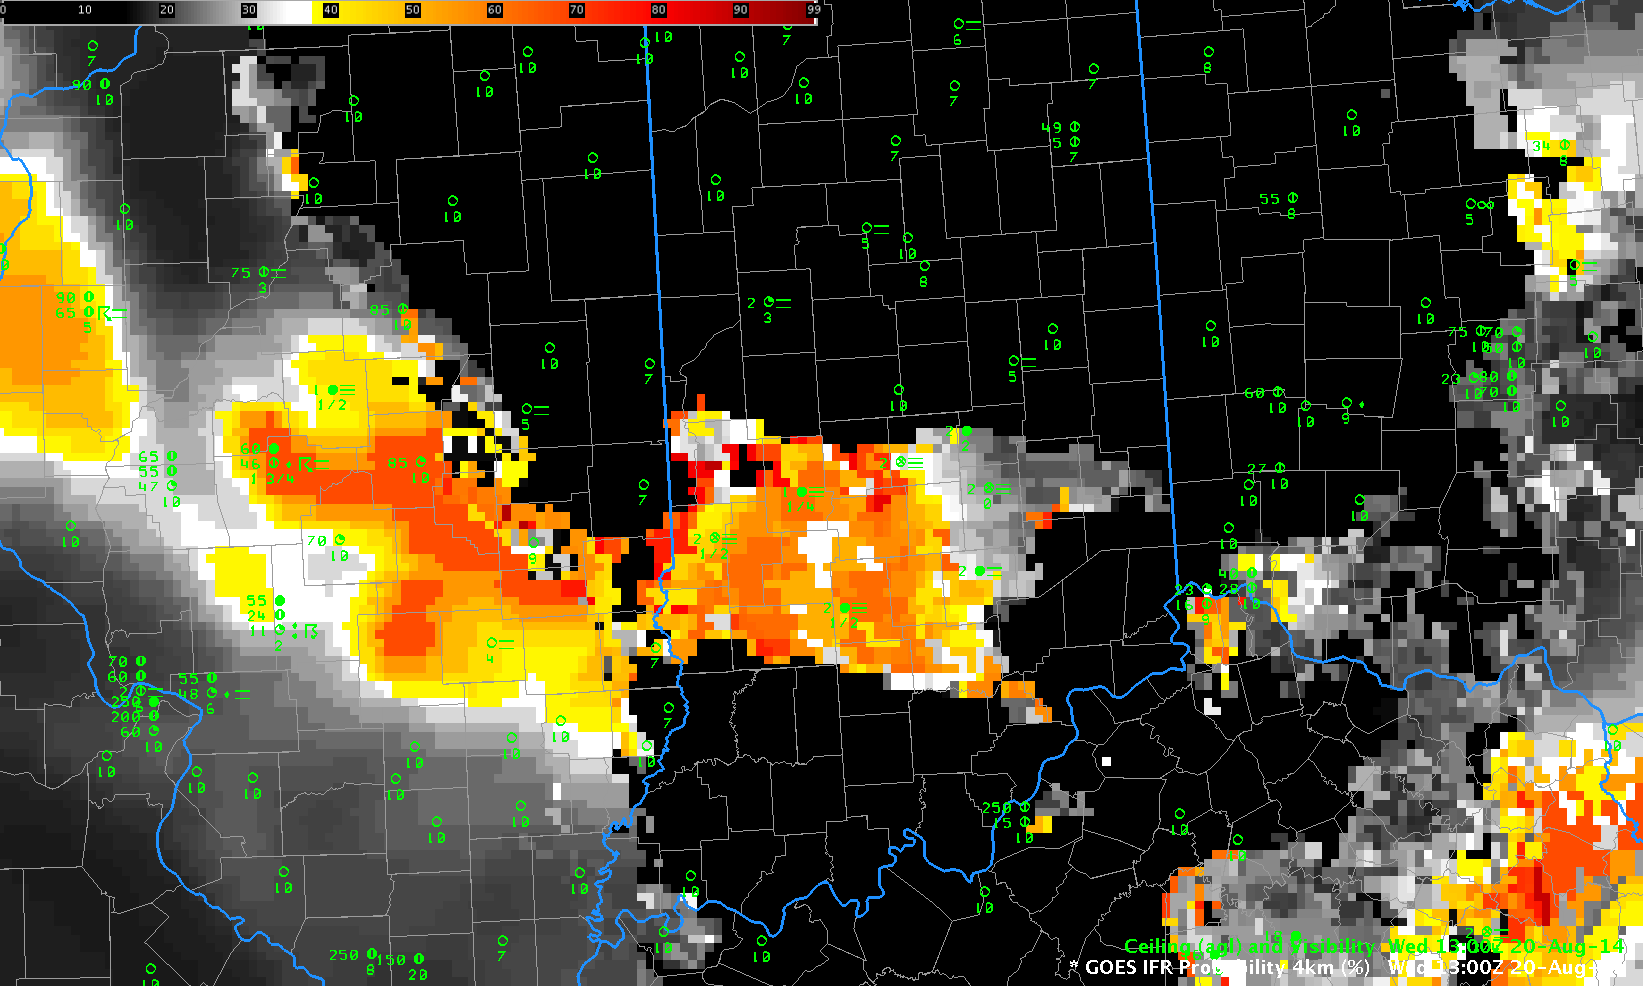
Indiana_IFR_20August_1300

GOES-R IFR Probabilities computed from GOES-13 data, 1300 UTC 20 August 2014

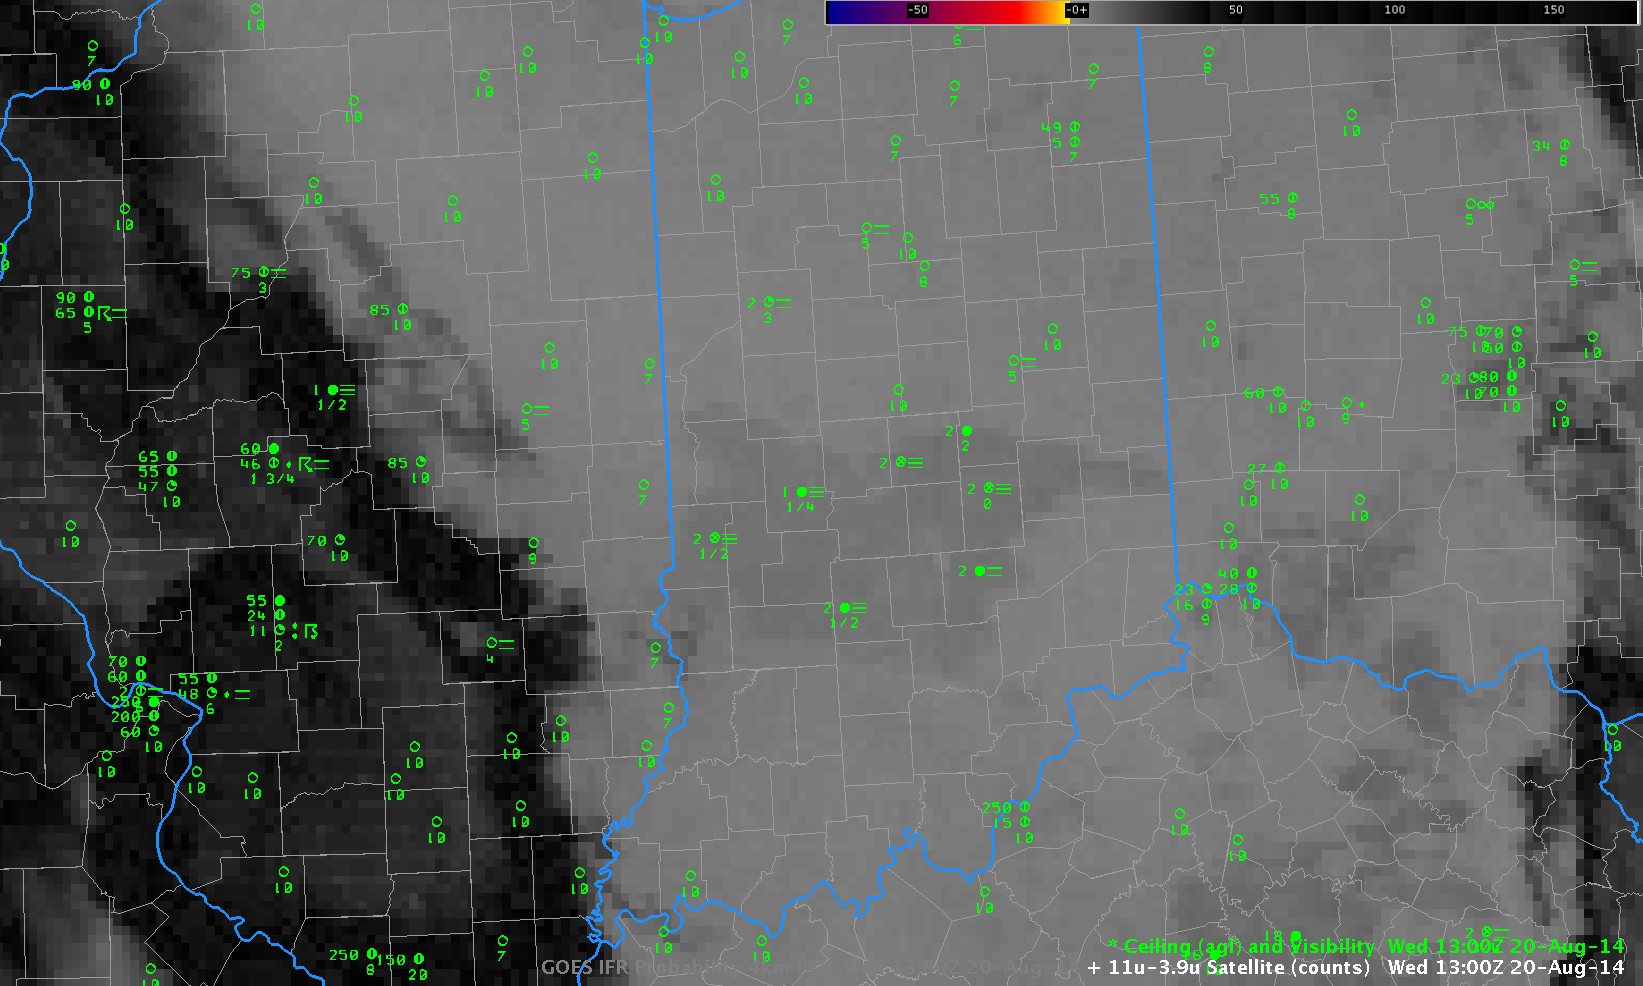
A small area of IFR conditions developed over southern Indiana during the overnight/early morning hours of 20 August, and the imagery in this post serves as a good tutorial for how to interpret GOES-R IFR Probabilities. The 1300 UTC imagery, above, is from after sunrise; therefore, the cloud-clearing algorithm (that includes visible imagery) will do a good job of screening out regions where widespread fog is not present (Compare this image to the 1000 UTC image that cannot use visible imagery below). The highest IFR Probabilities are confined to the region over southern Indiana where ceilings and visibilities are near or below IFR conditions. The effect of a large convective complex with multiple cloud layers on the IFR probabilities is apparent over Illinois. There, IFR Probabilities have a very smooth appearance because satellite predicitors (which predictors can be pixelated in appearance) are not used: only model data are driving the IFR Probability over most of Illinois. The Brightness Temperature Difference field, below, (10.7 µm – 3.9 µm), the heritage method of identifying regions of low clouds, displays the difficulty inherent in the field after sunrise: solar radiation with a wavelength of 3.9 µm changes the character of the difference field, making interpretation difficult.

Indiana_GOES13_BTD_20August_1300utc

GOES-13 Brightness Temperature Difference Field (10.7 µm – 3.9 µm) 1300 UTC 20 August 2014

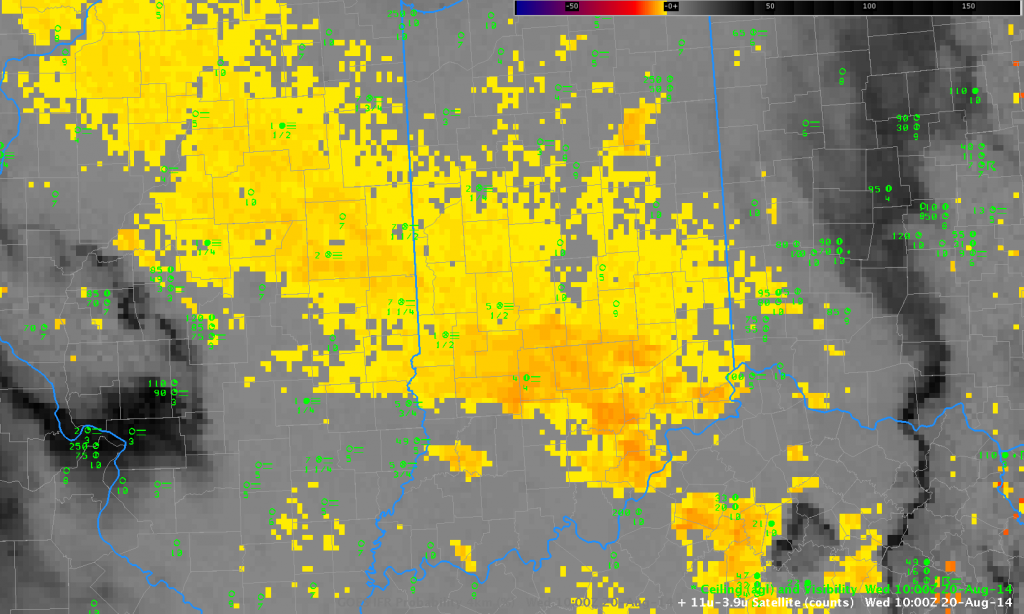
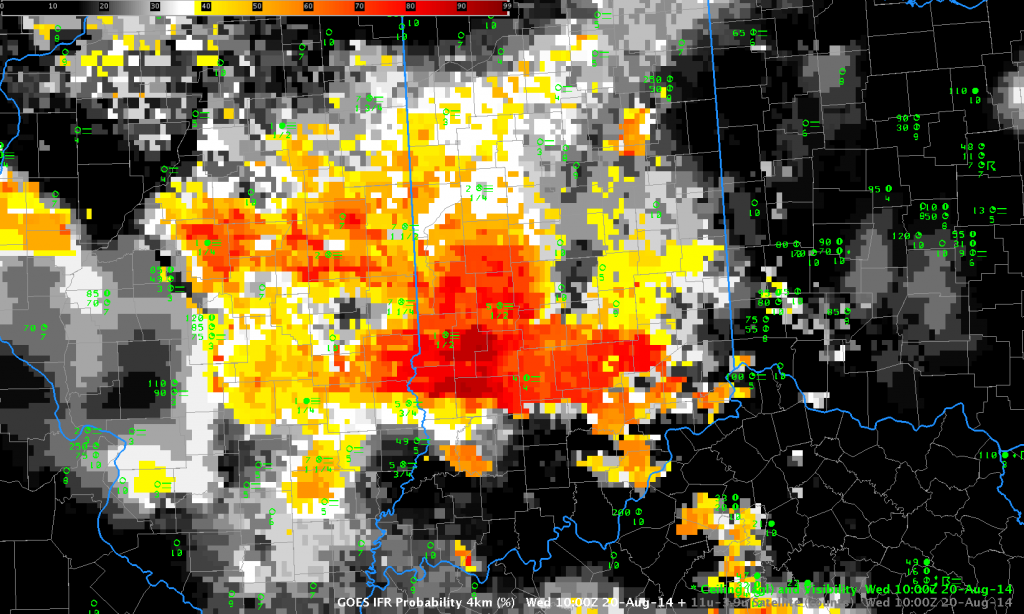
The GOES-13 Brightness Temperature Difference field at 1000 UTC, below, has a more characteristic look for a scene with fog and low stratus present. However, the signal overpredicts where reduced ceilings/visibilities are actually occurring. Mid-level stratus and fog can look very similar when viewed from a satellite. The IFR Probability field at the same time (1000 UTC), at bottom, has highest probabilities over the region of IFR conditions — over southern Indiana. Some regions with a strong Brightness Temperature Difference signal — for example, in western Illinois near Moline/Davenport — have a comparatively weak IFR Probability signal. In those regions, the Rapid Refresh model is correctly suggesting that low-level saturation is unlikely.

Indiana_BTD_20August_1000UTC

GOES-13 Brightness Temperature Difference Field (10.7 µm – 3.9 µm) 1000 UTC 20 August 2014

Indiana_IFR_20August2014_1000

GOES-R IFR Probabilities computed from GOES-13 data, 1000 UTC 20 August 2014