Category Archives: Day/Night Band

Day/Night band and fog detection

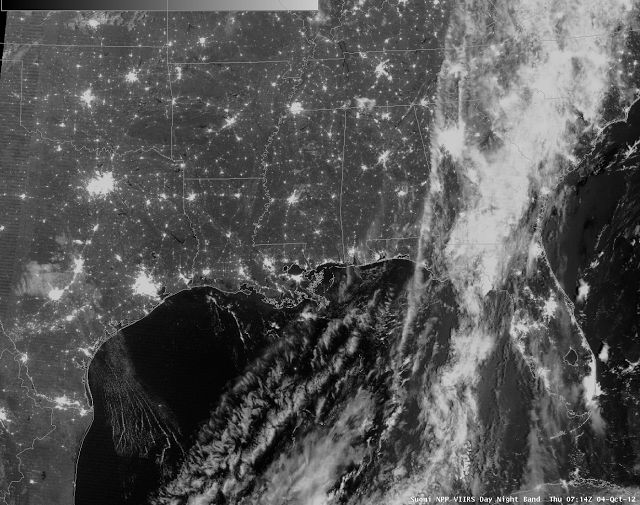
Day/Night band from VIIRS on Suomi/NPP from 0714 UTC on 4 October 2012

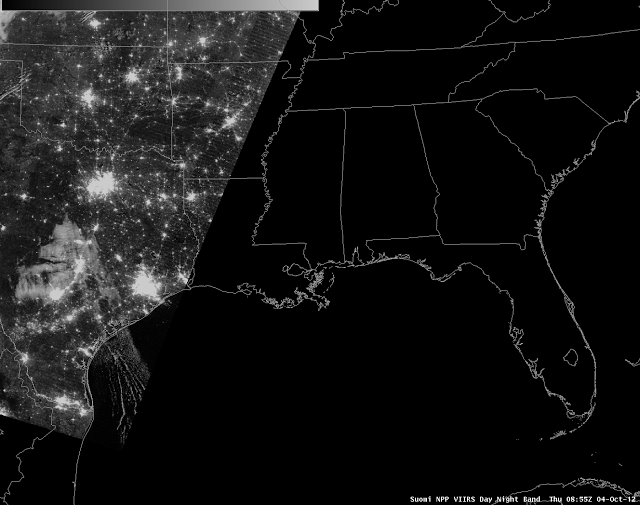
The day/night band imagery, above, shows fog/low clouds in the Hill Country west of San Antonio and Austin in south-central Texas.  Additionally, there are low clouds over the Gulf of Mexico, with cloud street structures that suggest a south-southeasterly wind bringing moisture inland from the Gulf.  The 0855 UTC day/night band image over the same domain, below, shows an expansion of the fog/low cloud signal.

Day/Night band from VIIRS on Suomi/NPP from 0855 UTC on 4 October 2012
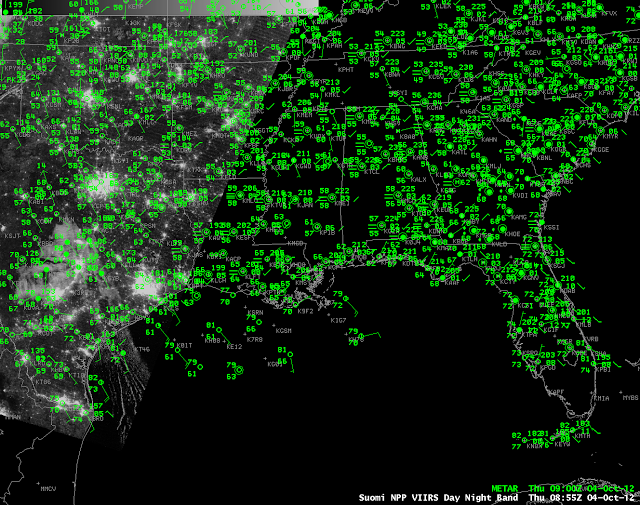
Day/Night band from Suomi/NPP with observations overlain.

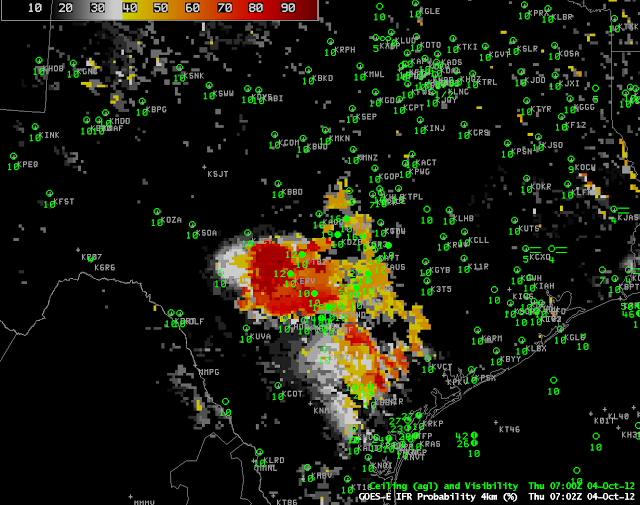
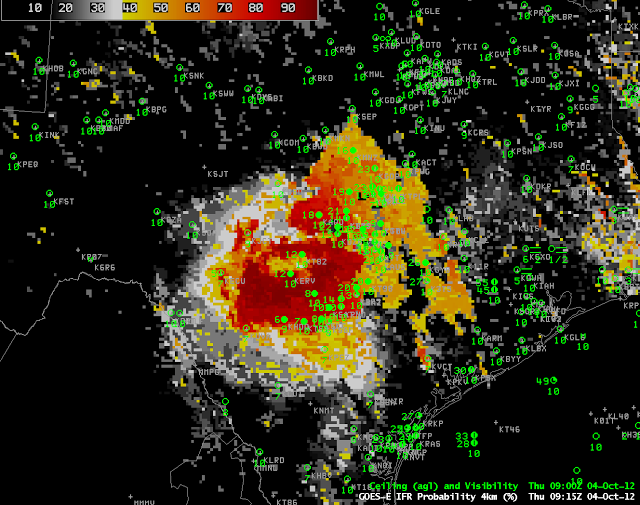
Observations suggest that the northern edge of the cloud streets over the extreme western Gulf of Mexico is the edge of a moisture gradient, and that that gradient extends inland to where the fog and low stratus are occurring.  How did the GOES-R IFR Probability field perform on this day?  The 0702 UTC (below) and 0915 UTC IFR probability fields show an increas in the areal extent of higher probabilities over the course of the night, consistent with the overnight cooling and the continued feed of moisture from the Gulf.  By 0900 UTC, IFR observations are common in and near the region where IFR probabilities are high.  This is a good example of how the Day/Night band and IFR Probabilities can be used in concert to understand the evolution of the fog/low stratus field over south Texas.

GOES-R Fog and the Day/Night Band on VIIRS

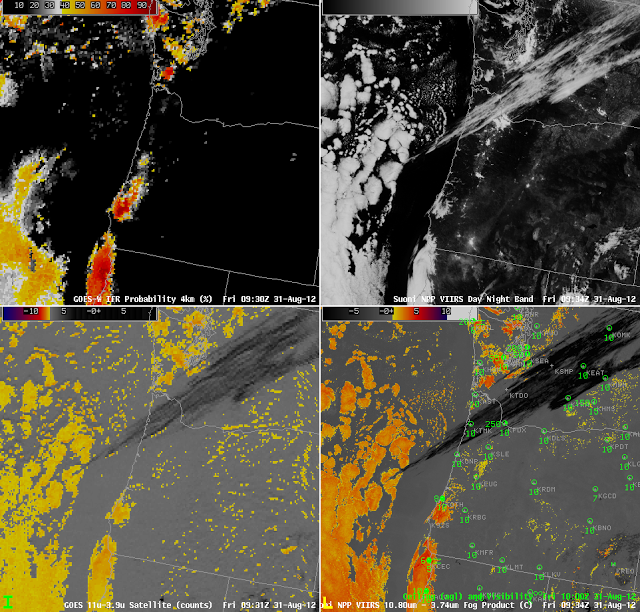
GOES-R IFR Probabilities (upper left), Suomi/NPP VIIRS Day/Night Band (upper right), Brightness temperature difference (10.7 micrometers – 3.9 micrometers) from GOES (lower left), Brightness temrperature difference (11.35 micrometers – 3.74 micrometers) from Suomi/NPP VIIRS (lower right), all around 0930 UTC on 31 August.

The presence of the Day/Night band on the VIIRS instrument on the Suomi/NPP satellite offers a unique method of validating the presence of fog or stratus at night.  During times near full moon (such as the Blue Moon on 31 August), the Day/Night band can detect low clouds using light reflected from the moon.  The GOES-R IFR probabilities show fog and low/stratus over southwestern Oregon;  a larger region of fog/low stratus stretched from just north of Crescent City, CA (where IFR conditions are reported) southward down the coast.  Note also a small patch over southwestern Washington and coastal northwest Washington (where IFR conditions are reported.  Cirrus clouds that prevent the detection of fog/low stratus from satellite are present stretching northeastward from the ocean off the central Oregon coast into central Washington.  There is a small signal in the GOES-R IFR Probability field underneath this upper cloud feature.

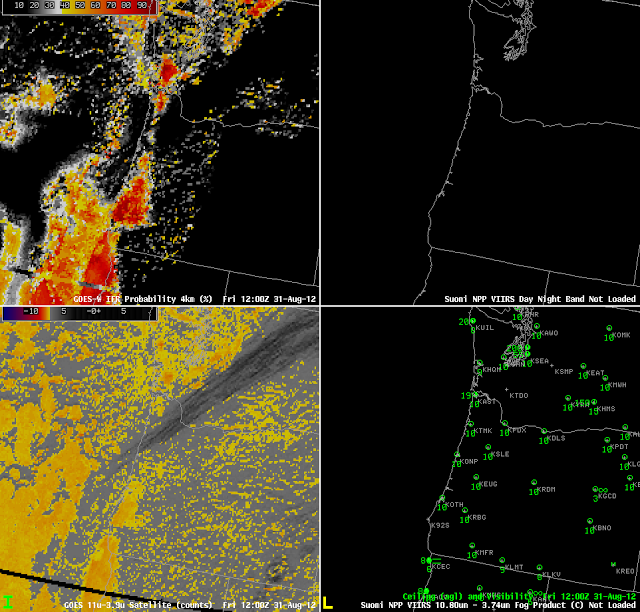
GOES-R IFR probabilties (Upper left), Suomi/NPP VIIRS day/night band (upper right), GOES-West Brightness Temperature Difference between 10.7 and 3.9 micrometer channels (Lower left), Observations (Lower right), all around 1200 UTC, 31 August

AT 1200 UTC, some benefits of the GOES-R IFR probability field are apparent.  The noisy signal over central and eastern Oregon is reduced, and a signal is present also underneath the thin cirrus streak that persists over extreme northwest Oregon.

How to validate GOES-R IFR in regions with no surface observations

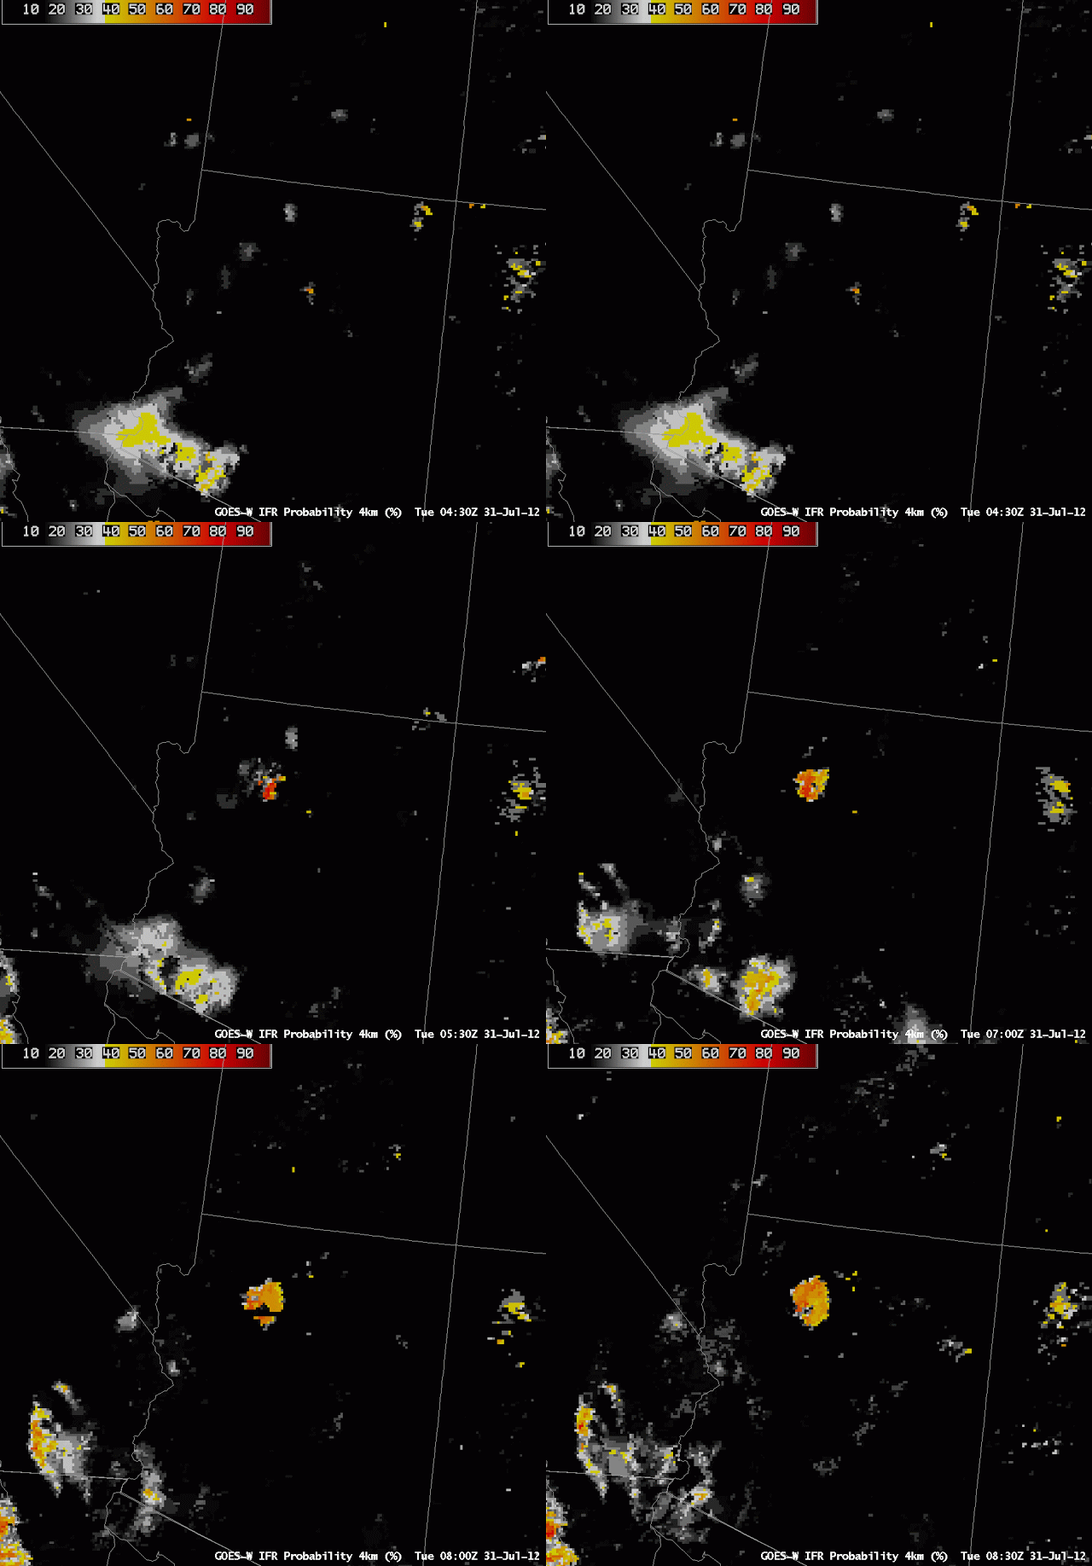
Animation of GOES-W IFR Probabilities over Arizona, half-hourly from 0430 UTC to 0800 UTC 31 July 2012

The animation of GOES-R IFR Probabilities over north-central Arizona shows the development of relatively high probabilities as the night progresses, an evolution that is consistent with the formation of radiation fog.  However, there are no surface observations routinely taken in the region to verify the presence of IFR conditions, or even clouds.  How much credence should be given to such a field?

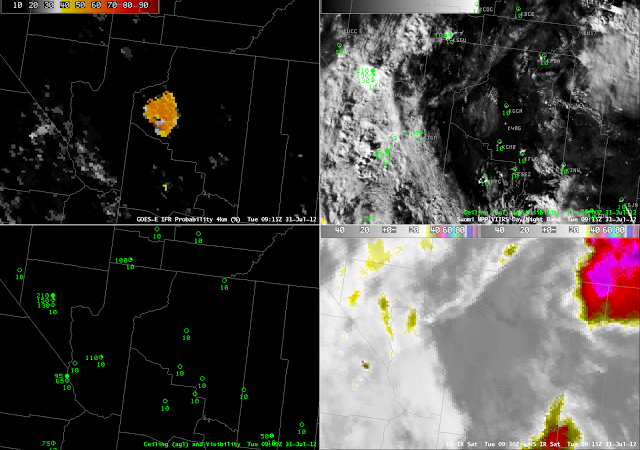
GOES-R IFR Probabilities from GOES-West (upper left), Suomi-NPP Day/Night band imagery (upper right), Surface observations (lower left), GOES-West color-enhanced window channel (lower right), times as indicated.

A serendipitous Suomi-NPP overpass shows a region of clouds neatly outlined by the GOES-W IFR probabilities. Although the Day/Night band cannot give ceiling heights or visibilities (that is, it cannot alone determine if IFR conditions are occurring), it does show the presence of low clouds.

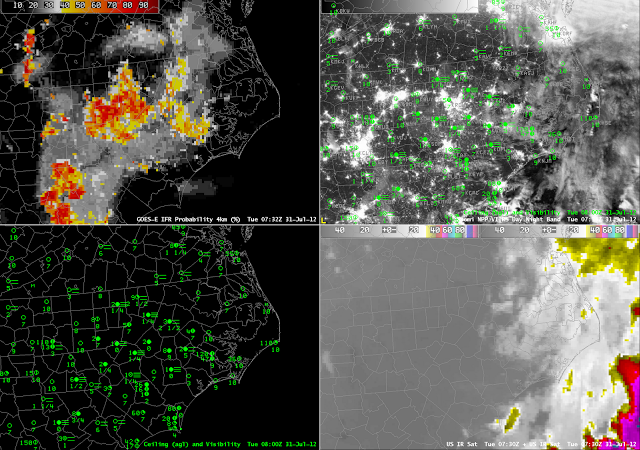
An earlier Suomi/NPP overpass over the eastern United States overflew a second developing region of enhanced IFR probabilities, over the piedmont from North Carolina southwestward into South Carolina (below).  The city lights of the Carolinas make it more difficult to detect cloud edges, although evidence of one does exist between Camden SC (KCDN) and Fairfield CO Airport (KFDW).  This is a also a region where IFR probabilities quickly drop from high values (near KCDN, where there is fog with 100-foot ceilings) to low (near KFDW, which reports clear skies).

GOES-R IFR Probabilities from GOES-East (upper left), Suomi-NPP Day/Night band imagery (upper right), Surface observations (lower left), GOES-West color-enhanced window channel (lower right), times as indicated.

Fog over Louisiana and Mississippi

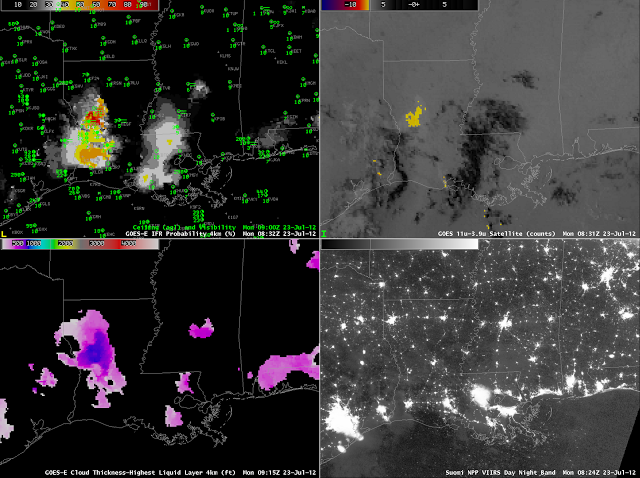
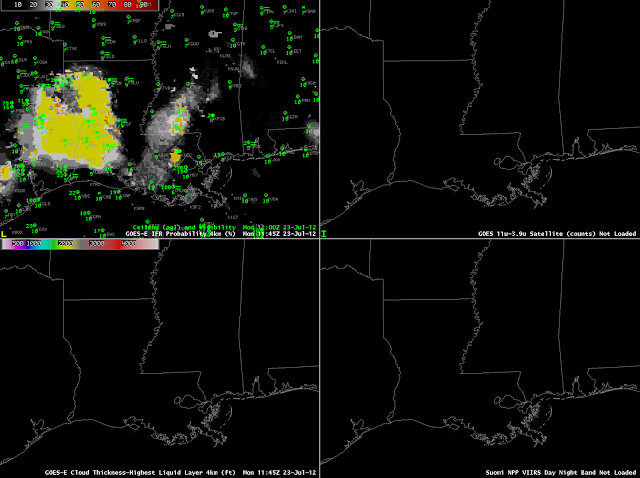
GOES-R IFR Probabilities computed from GOES-East Imager data (upper left), GOES-East brightness temperature difference (upper right), GOES-R Cloud Thickness of the highest liquid water cloud layer (bottom left), Suomi/NPP Day/Night band (bottom right), all from 0830-0900 UTC on 23 July 2012.
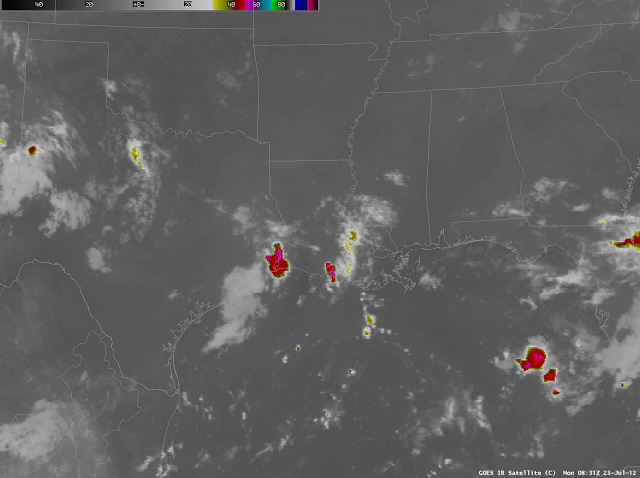
Enhanced 11-micrometer imagery, 0831 UTC 23 July 2012

Fog formed over the southern Mississippi Valley in the early morning of July 23 in a region where high clouds associated with a westward-tracking wave made detection difficult via the traditional brightness temperature difference method.  The imagery above shows relatively high IFR probabilities over southwestern Louisiana where IFR conditions are occurring.  Two items should jump out.  The IFR probabilities are highest where both satellite and model predictors are high, and that occurs in west-central Louisiana.  In regions to the south and west, where higher clouds exist (and satellite predictors are therefore low), probabilities are a bit lower in a region where only model predictors are being used.  However, IFR conditions are present.  Note how the character of the IFR probability field changes from the region where satellite data are used (much more spatially variable) to the region where mostly model data are used (more spatially uniform).  It is very important when interpreting the probability fields to be aware of the presence of high clouds that limit the inclusion of satellite data in the predictors.

GOES-R IFR Probabilities computed from GOES-East Imager data (upper left), GOES-East brightness temperature difference (upper right), GOES-R Cloud Thickness of the highest liquid water cloud layer (bottom left), Suomi/NPP Day/Night band (bottom right), all from 1145-1200 UTC on 23 July 2012.
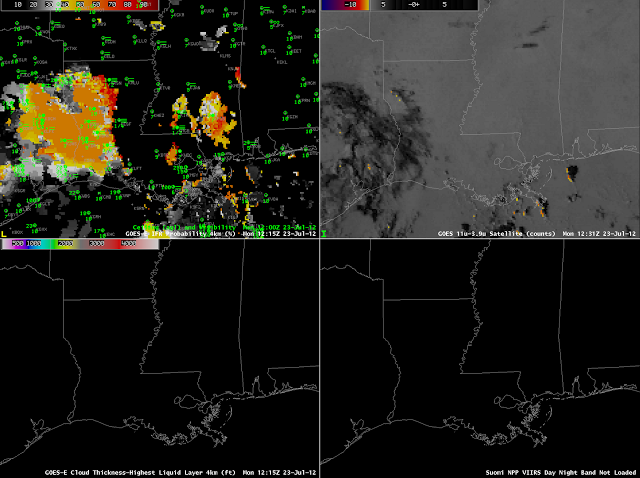
GOES-R IFR Probabilities computed from GOES-East Imager data (upper left), GOES-East brightness temperature difference (upper right), GOES-R Cloud Thickness of the highest liquid water cloud layer (bottom left), Suomi/NPP Day/Night band (bottom right), all from 1215 UTC on 23 July 2012.

The two images above show how the probabilities change as the predictors used change from nighttime values (at 1145 UTC) to daytime values (1215 UTC).  At 1145 UTC, probabilities over Louisiana are near 40%, and these probabilities are driven largely by model data, because of high clouds.  There are several airports reporting IFR conditions at 1200 UTC.  Probabilities jump to around 55% at 1215 UTC.

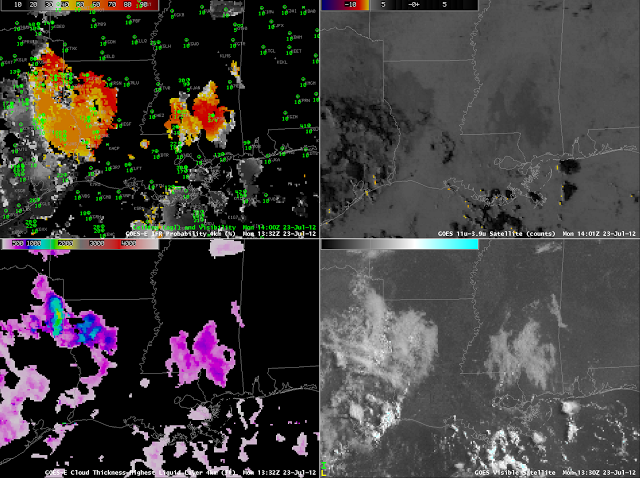
GOES-R IFR Probabilities computed from GOES-East Imager data (upper left), GOES-East brightness temperature difference (upper right), GOES-R Cloud Thickness of the highest liquid water cloud layer (bottom left), GOES-East Visible imagery (bottom right), all from around 1300 UTC on 23 July 2012.

At 1300/1400 UTC, the GOES-R IFR probabilities and cloudt thickness fields neatly overlap the visible imagery observations of cloudiness over Mississippi and over western Louisiana, with a pronounced break in central Louisiana.

Isolated Fog/Low Stratus in Texas

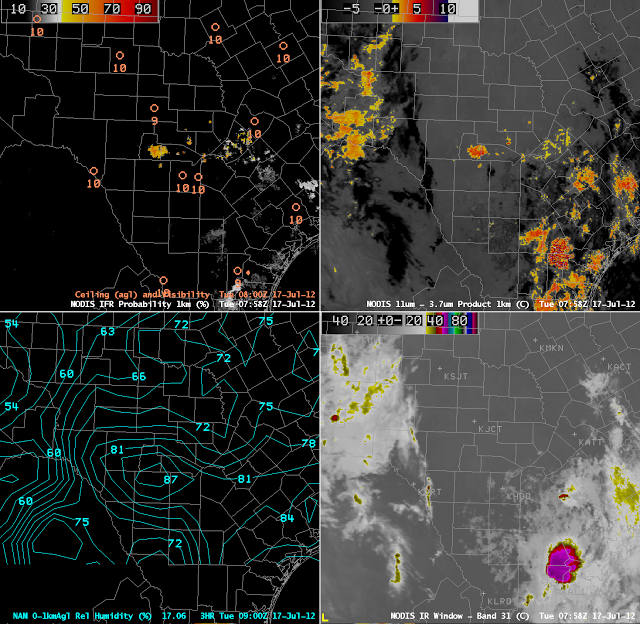
GOES-R IFR Probabilities computed using MODIS data (upper left), MODIS Brightness Temperature Difference (the ‘traditional’ Fog Product) (upper right), Lowest 1km Relative Humidity from the NAM (lower left), MODIS IR Window Channel (lower right)

The MODIS-based GOES-R IFR probability image, above, showed a region of high probabilities of IFR over Bandera and Real Counties in Texas west of San Antonio.  This signal is driven by the brightness temperature difference (shown, upper right) and the relative humidity in the Rapid Refresh.  The NAM relative humidity is shown in the lower left image, and the signal in the GOES-R IFR field suggests the RAP relative humidity is similar.  Note how the brightness temperature difference signal farther west in the image does not lead to a signal in the IFR Probabilities;  model relative humidities there are lower.

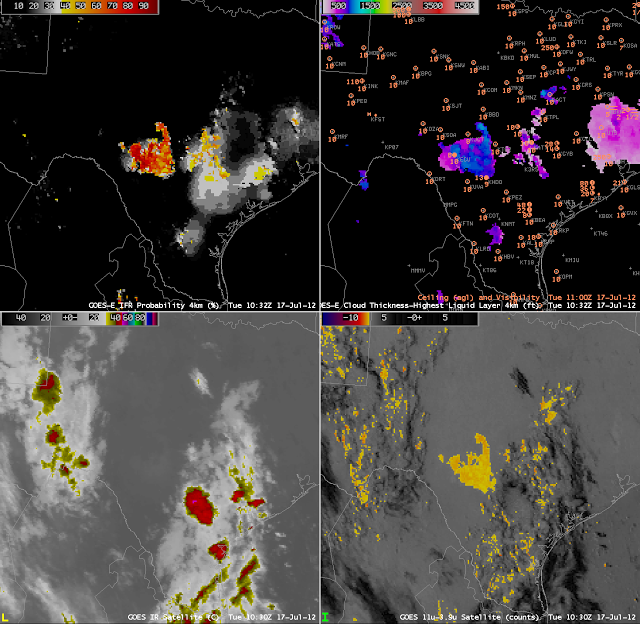
Does the high probability of IFR signal verify?  In other words, when you see an isolated signal like this, how much credence can you give it?  Hondo, TX (HDO), just southeast of the higher IFR probabilities, does not show IFR conditions.  How do things evolve with time?  GOES-based imagery, below, show the expansion of the IFR probabilities from 0800 UTC, the approximate time of the MODIS pass, above, to 1030 UTC.  The expansion is typical of what would occur with radiational fog formation overnight.  By 1100 UTC, ceilings at Hondo (HDO) and Rocksprings (ECU) are near IFR conditions.  It appears that the IFR probability signal is correctly diagnosing the slow development of a  fog/stratus deck.
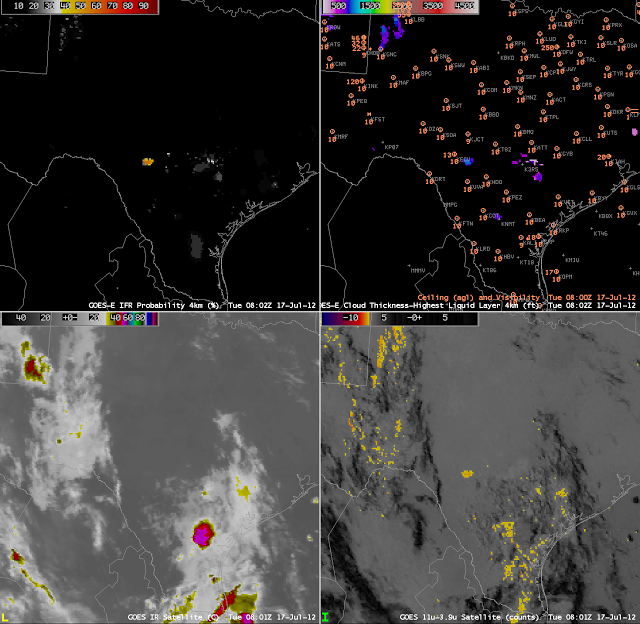
GOES-R IFR Probabilities (Upper left), Ceilings and Visibility plotted over GOES-R Cloud Thickness (upper right), GOES-East enhanced Window Channel brightness temperature (bottom left), GOES-East Brightness Temperature Difference (bottom right) from 0800 UTC

GOES-R IFR Probabilities (Upper left), Ceilings and Visibility plotted over GOES-R Cloud Thickness (upper right), GOES-East enhanced Window Channel brightness temperature (bottom left), GOES-East Brightness Temperature Difference (bottom right) from 1030-1100 UTC

There was a fortuitous pass of the Suomi/NPP satellite over this region as the fog/low stratus developed.  Does that satellite give any more information about the presence of fog?  The loop below toggles between the GOES-R IFR probability from GOES-East data and the Day/Night Band from VIIRS.  Because the Moon is nearly new, very little moonlight is illuminating the cloud field so it is difficult to determine if fog is actually present at 0832 UTC over the region.  The parts of the counties over which the fog is developing are sparsely populated, so there are no city lights from which to glean information.