Category Archives: California

Fog Dissipation Example over California

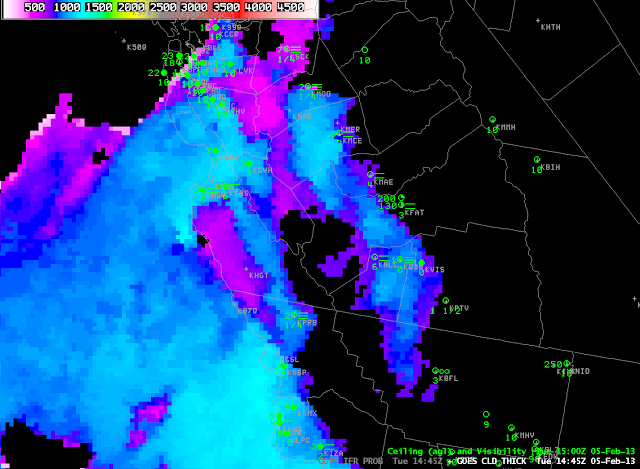
GOES-R Cloud Thickness over California, 1445 UTC on 5 Feb 2013

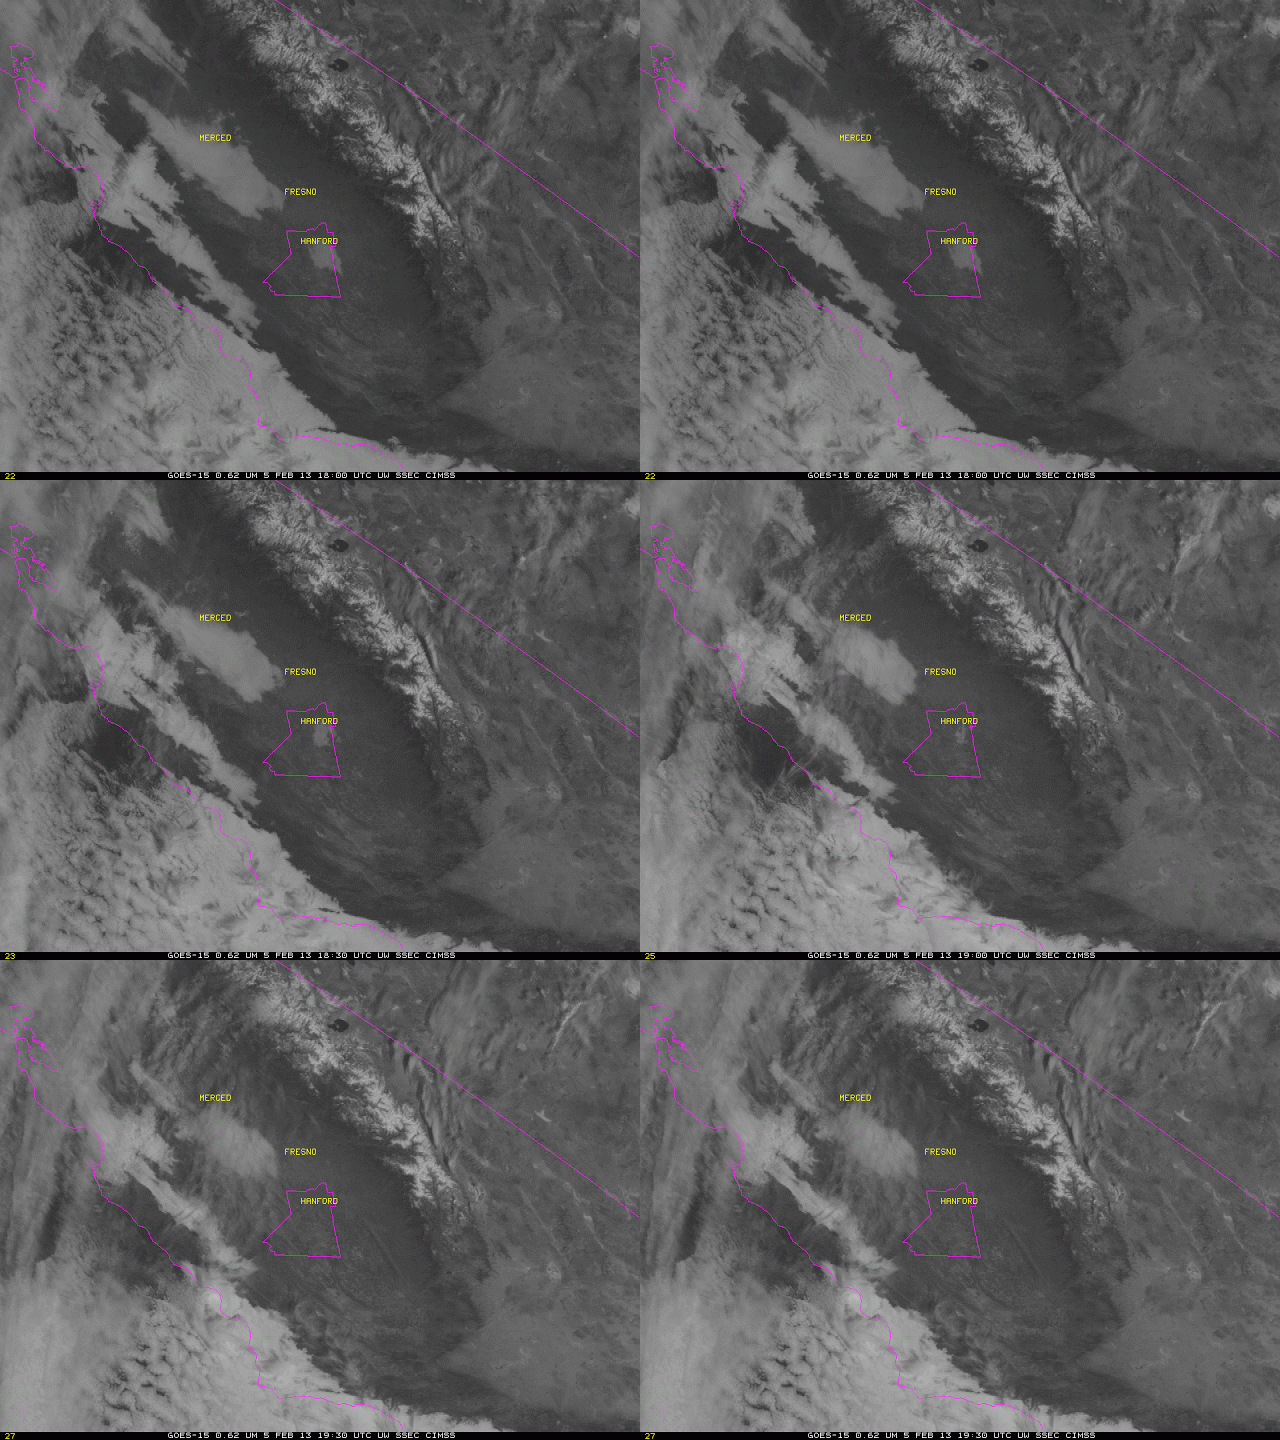
GOES-R Cloud Thickness can be used to esimate when radiation fog will dissipate.   In this example from central California, radiation fog has developed to a depth of around 1000 feet near Hanford, 1000 feet just southwest of Fresno, and 1100 feet near Merced.  This chart shows the relationship between Cloud Thickness and burn-off time.  1000 feet correlates well with a 3-hour burn-off time;  1100 feet correlates well with a 4-hour burnoff time.  The animation below, with imagery at 1800, 1830, 1900 and 1930 UTC shows that the fog around Hanford was slow to burn off — by about an hour.  Fog near Merced was also slow to burn off, but high clouds moving in may have been responsible for that delay.

GOES-15 Visible Imagery over Central California.  Times as indicated.

California Fog

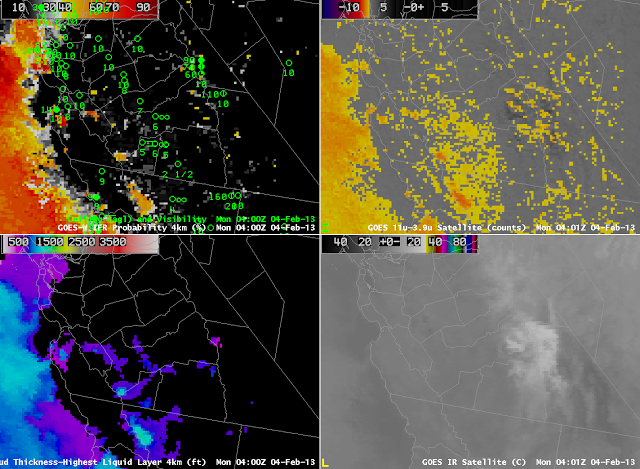
GOES-R IFR Probability computed from GOES-West (Upper Left), GOES-R Cloud Thickness computed from GOES-West (Lower Left), GOES-West Brightness Temperature Difference (10.7 µm – 3.9 µm) (Upper Right), GOES-West 10.7 µm imagery (Lower Left) at 0400 UTC 4 February

Fog develped over the San Joaquin and Salinas Valleys of California early on 4 February.  At 0400 UTC, the Brightness Temperature Difference signal shows a noisy signal over the east part of the San Joaquin Valley, with a more coherent signal off the coast and over Kern and Kings County.
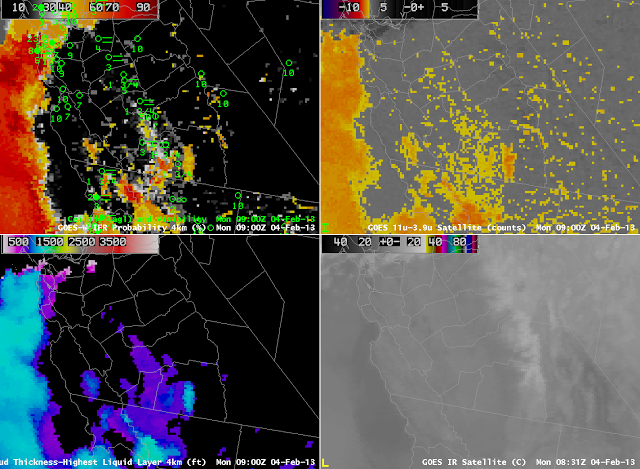
As above but at 0900 UTC.

By 0900 UTC, five hours later, although the seemingly noisy signal continued over the California in the brightness temperature difference product, the GOES-R IFR probability field is starting to show higher values aligned through the San Joaquin and Salinas Valleys, where IFR conditions have developed.
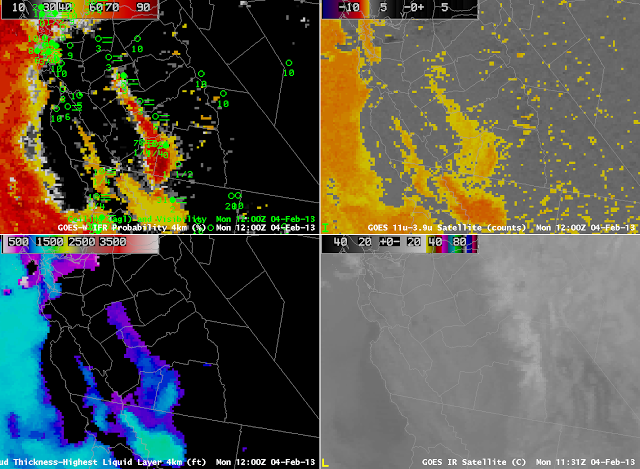
As above, but at 1200 UTC

At 1200 UTC, above, high IFR probabilities extend through the Salinas Valley and in the San Joaquin valley where IFR conditions are noted.  IFR probability is also high over San Francisco Bay where marine stratus has moved inland.
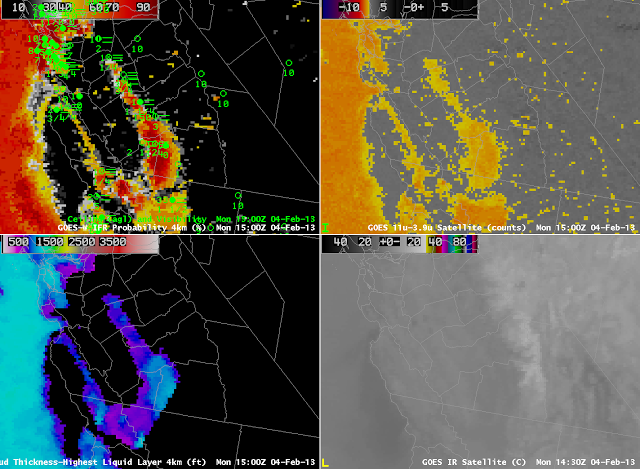
As above, but at 1500 UTC

The regions of reduced visibility continue at 1500 UTC, the last image before twilight conditions disallows computation of Cloud Thickness (indeed, the terminator is apparent in the image).  The cloud thickness of 1100 feet suggests, based on this scatterplot, a dissipation time of around 4 hours.  The animation below shows visible imagery at 1730, 1830 and 1930 UTC that aligns with the predictions.
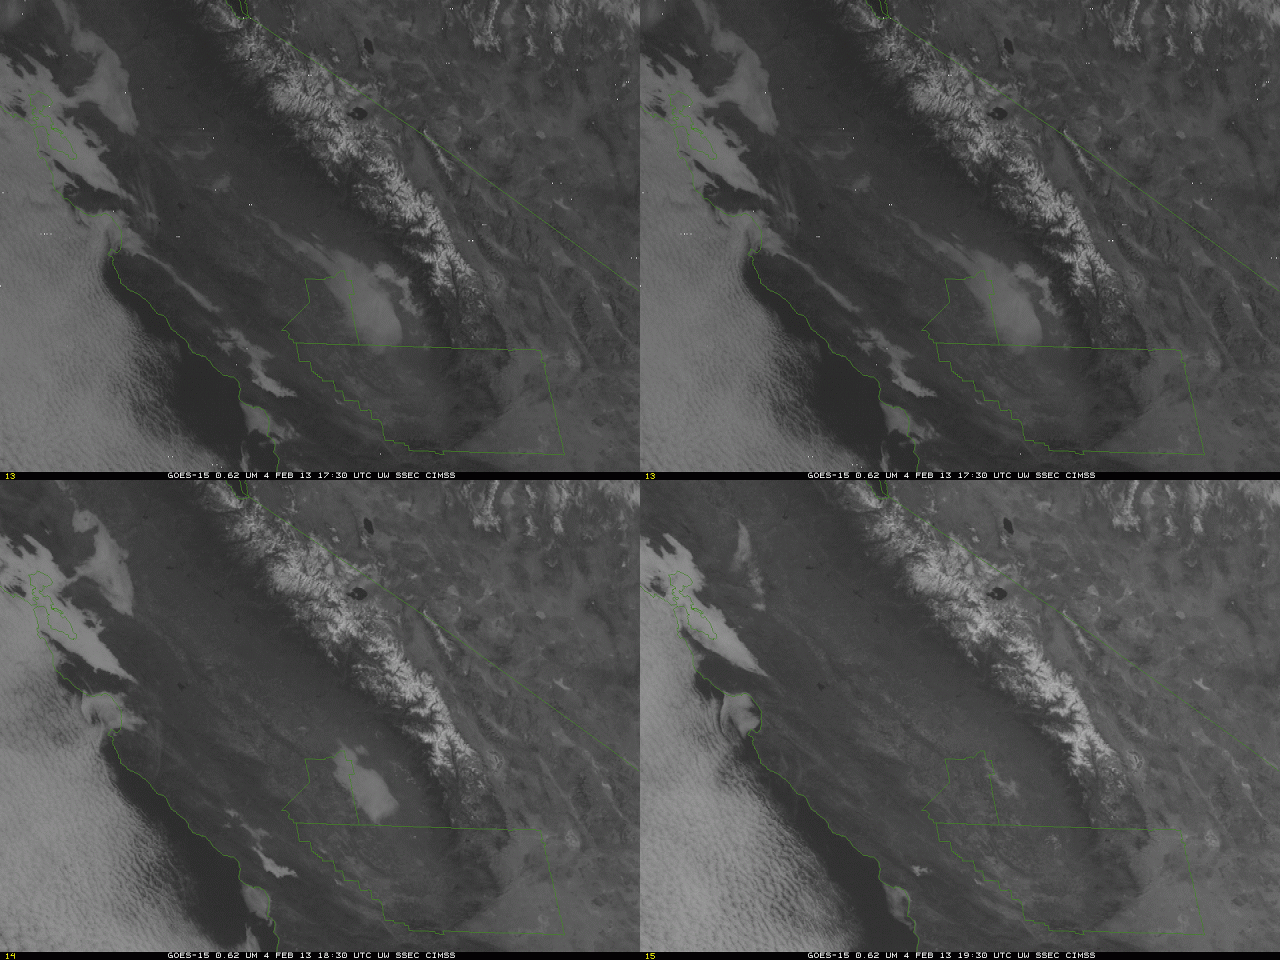
GOES-15 0.62 µm Visible Imagery, times as indicated.

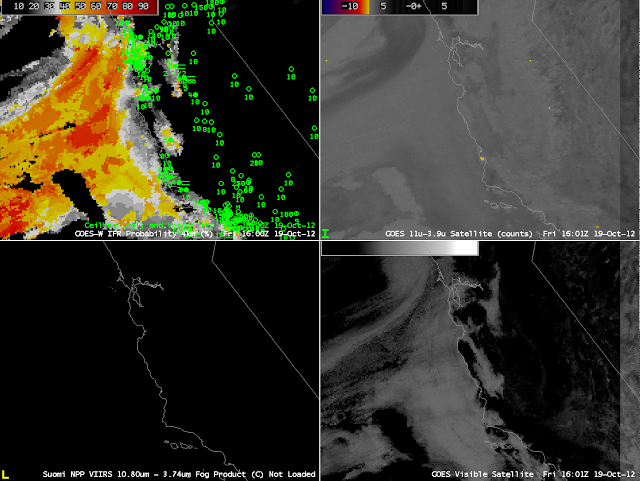
Suomi/NPP VIIRS data overflew this region twice during the night, and provided brightness temperature difference information at high spatial resolution.  The GOES-R IFR algorithm is not yet applied to Suomi/NPP data (like it is to MODIS data) however.
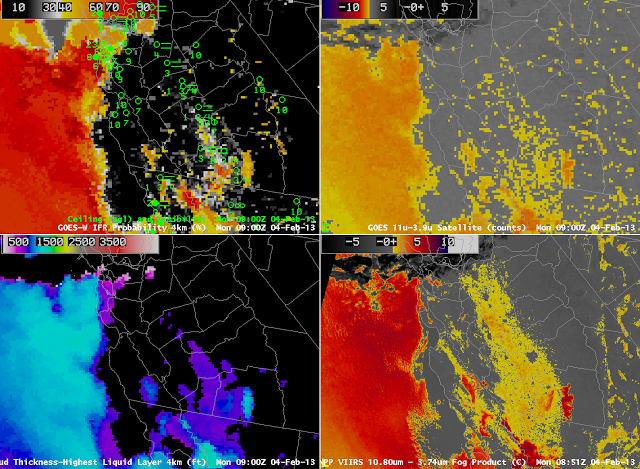
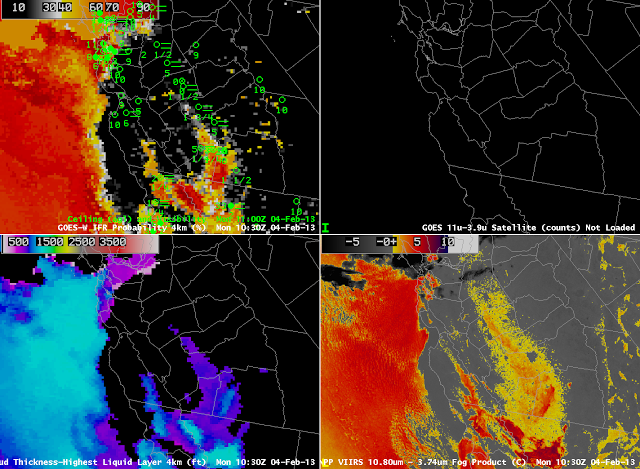
As at top, but with Suomi/NPP Brightness Temperature Difference (10.8 µm – 3.74 µm) in the lower right, at ~0900 UTC.
As above, but at 1030 UTC.

Fog in California’s Central Valley

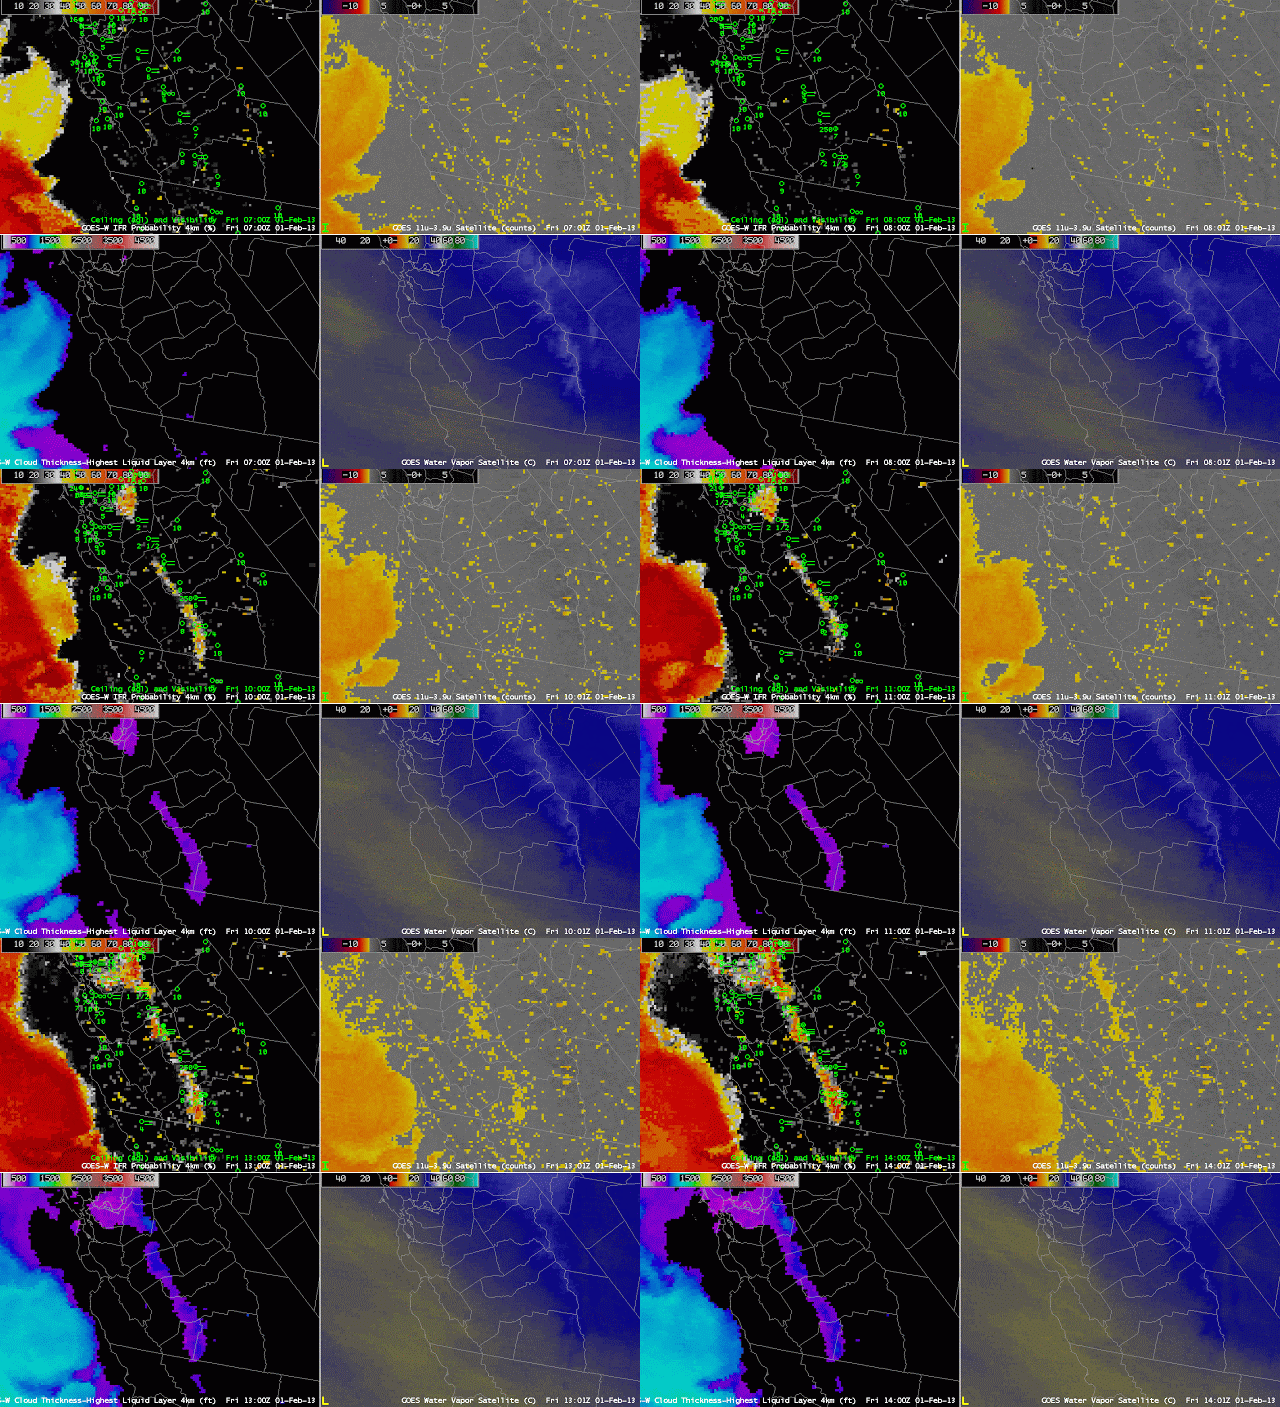
GOES-R IFR Probabilities (Upper Left), GOES-West Brightness Temperature Difference (10.7 µm – 3.9 µm) (Upper Right), GOES-R Cloud Thickness (Lower Left), GOES-West Water Vapor imagery (6.7 µm)

Fog developed in the early morning of February 1, 2013, in California’s Central Valley, the combination of the San Joaquin valley to the south and the Sacramento Valley to the north.  The imagery above shows the GOES-R Fog/Low Stratus product and the traditional fog product, the brightness temperature difference between 10.7 µm and 3.9 µm.  The GOES-R Product (IFR Probability) is first in highlighting the development of fog near the San Joaquin River and reductions in visibility occur in sync with the increase of IFR probabilities. The traditional GOES-West brightness temperature difference product displays considerable signal in the first hours of the animation above, but there is no organization to the signal.  Eventually, however, the brightness temperature difference signal does include the fog and low stratus in the Valley.

IFR Conditions surround California’s Central Valley

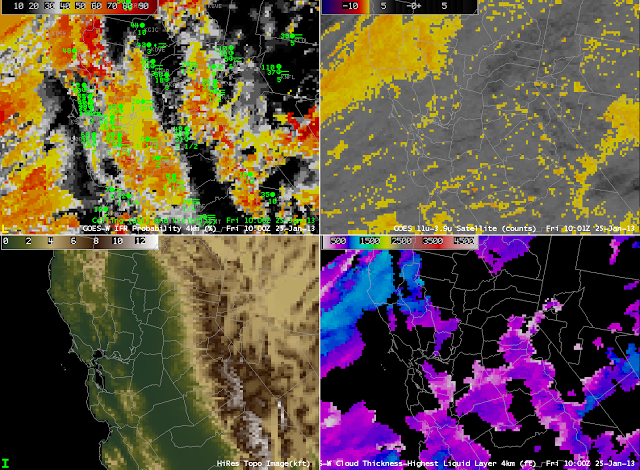
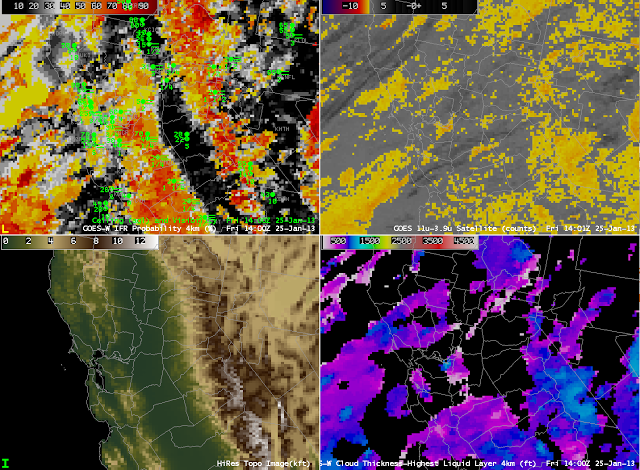
GOES-R IFR Probabilities compted from GOES-West (Upper Left), GOES-West Brightness Temperature Difference (10.7 µm- 3.9 µm) (Upper Right), Central Valley Topography (Lower Left), GOES-R Cloud Thickness of Highest single liquid layer (Lower Right), 1000 UTC on 25 January 2013

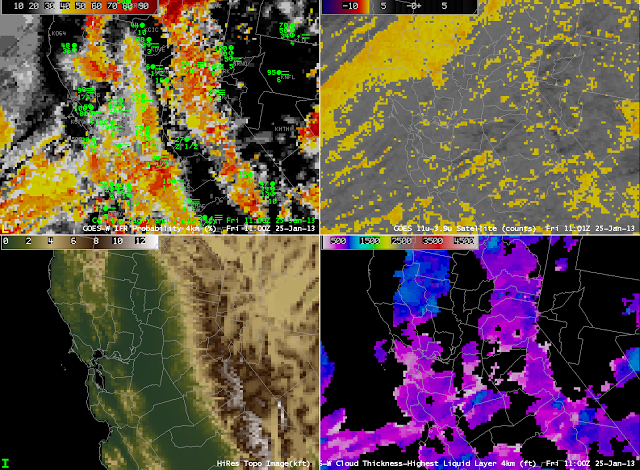
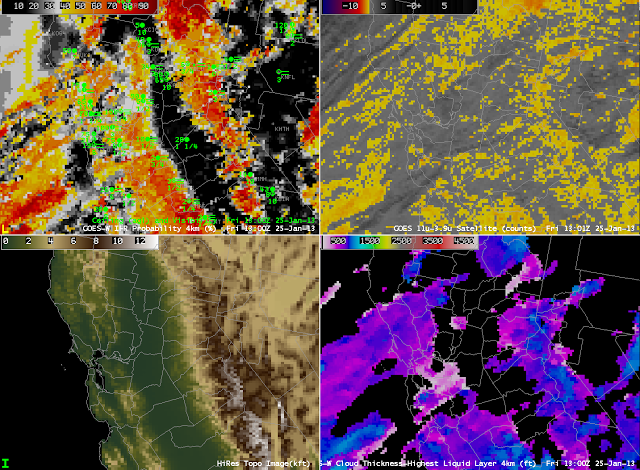
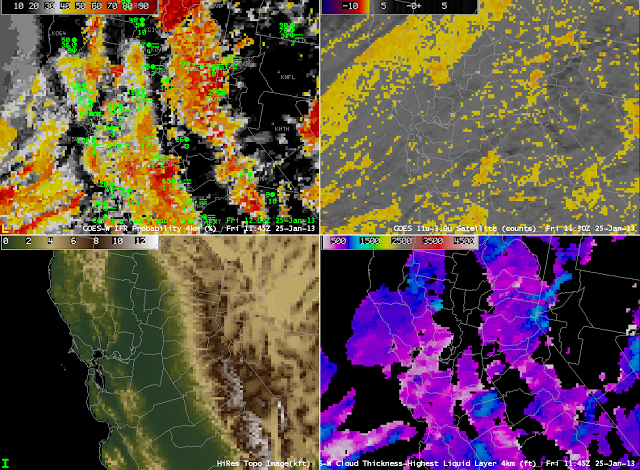
GOES-R IFR Probabilities suggest the presence of IFR conditions both to the west and to the east of California’s San Joaquin Valley, providing a much more coherent signal of IFR conditions than can be discerned from the traditional Brightness Temperature Difference Product.  That traditional product is hamstrung by the multiple cloud layers present over the West Coast as an extratropical cyclone approaches from the Pacific Ocean.  The signal present at 1000 UTC (and earlier) continues through most of the morning.  The synthesis of Satellite Predictors and Model Predictors (Rapid Refresh Model) in the Naive Bayesian Model produces a product that gives better information in this case on exactly where IFR conditions are most likely.

As above, but at 1100 UTC

As above, but at 1145 UTC

As above, but at 1300 UTC

As above, but at 1400 UTC

Fog in California’s San Joaquin Valley

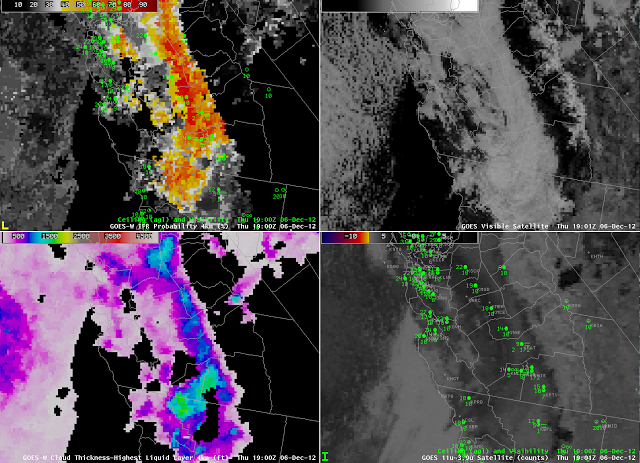
GOES-R IFR Probabilities, computed from GOES-West (Upper Left), GOES-West Visible Imagery (0.62 µm) (Upper Right), GOES-R Cloud Thickness (Lower Left), GOES-West Brightness Temperature Difference (10.7 µm – 3.9 µm) (Lower Right)

Fog is persisting in California’s San Joaquin Valley today, and the GOES-R IFR Probability and Cloud Thickness products both are describing its spatial extent.  The lowest clouds are banked against the western side of the valley, with visibilities lowest, and IFR probabilities highest, from Bakersfield to Fresno to points north.  The Sacramento Valley (not shown) is not showing visibilities near IFR conditions, and the IFR probabilities in that part of California are lower.

Dense fog at LAX

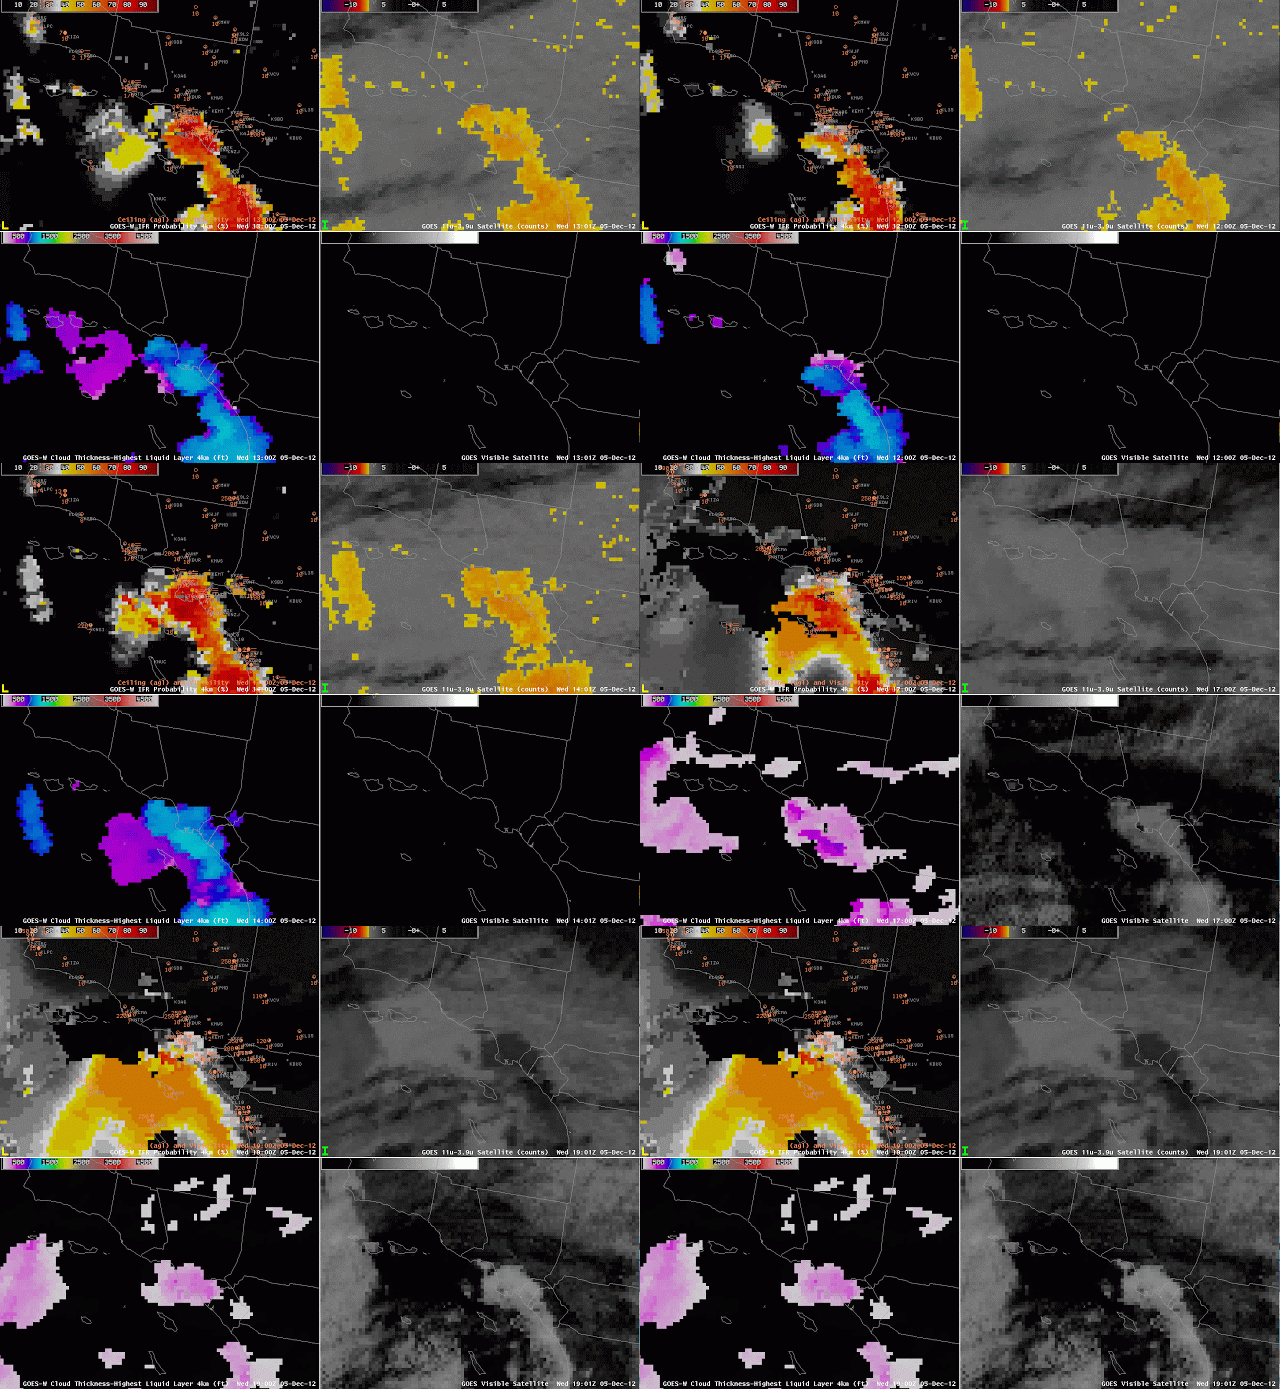
GOES-R IFR Probabilities from GOES-West (Upper Left), Traditional Brightness Temperature Difference (10.7 µm – 3.9 µm) field from GOES-West (Upper Right), GOES-R Cloud Thickness from GOES-West (Lower Left), GOES-West visible imagery (Lower Right)

Dense fog developed over portions of the Los Angeles basin in the morning on 5 December 2012, and regions affected included Los Angeles International Airport.  The GOES-R IFR Probability product, above, shows the fog was most prevalent from Santa Monica to points south, mostly within a couple miles of the coast.   In particular, the GOES-R IFR probability field depicted the sharp edge to the fog field.  Surface visibilities at LAX improved to above 1 mile shortly after 1800 UTC.

From the National Weather Service in Los Angeles:

CAZ041-051700-
/O.CON.KLOX.FG.Y.0020.000000T0000Z-121205T1700Z/
LOS ANGELES COUNTY COAST INCLUDING DOWNTOWN LOS ANGELES-
INCLUDING THE CITIES OF...MALIBU...SANTA MONICA...BEVERLY HILLS...
HOLLYWOOD...LONG BEACH
628 AM PST WED DEC 5 2012

...DENSE FOG ADVISORY REMAINS IN EFFECT UNTIL 9 AM PST THIS
MORNING...

* VISIBILITIES...ONE QUARTER MILE OR LESS AT TIMES.

* TIMING...THROUGH EARLY THIS MORNING...WITH IMPROVING
VISIBILITIES BY MID MORNING.

* IMPACTS...TRAVEL WILL BE HAMPERED BY THE DENSE FOG IN AND
AROUND THE LONG BEACH AREA...TO GARDENA...AND WEST LOS ANGELES
INCLUDING LOS ANGELES AIRPORT.

PRECAUTIONARY/PREPAREDNESS ACTIONS...

A DENSE FOG ADVISORY MEANS VISIBILITY WILL FREQUENTLY BE REDUCED
TO ONE QUARTER MILE OR LESS. IF DRIVING...SLOW DOWN...USE YOUR
HEADLIGHTS...AND LEAVE PLENTY OF DISTANCE AHEAD OF YOU. FOG CAN
ALSO MAKE ROAD SURFACES SLICK SO AVOID USING EXCESSIVE SPEED.

IFR Probabilities during a Big Storm

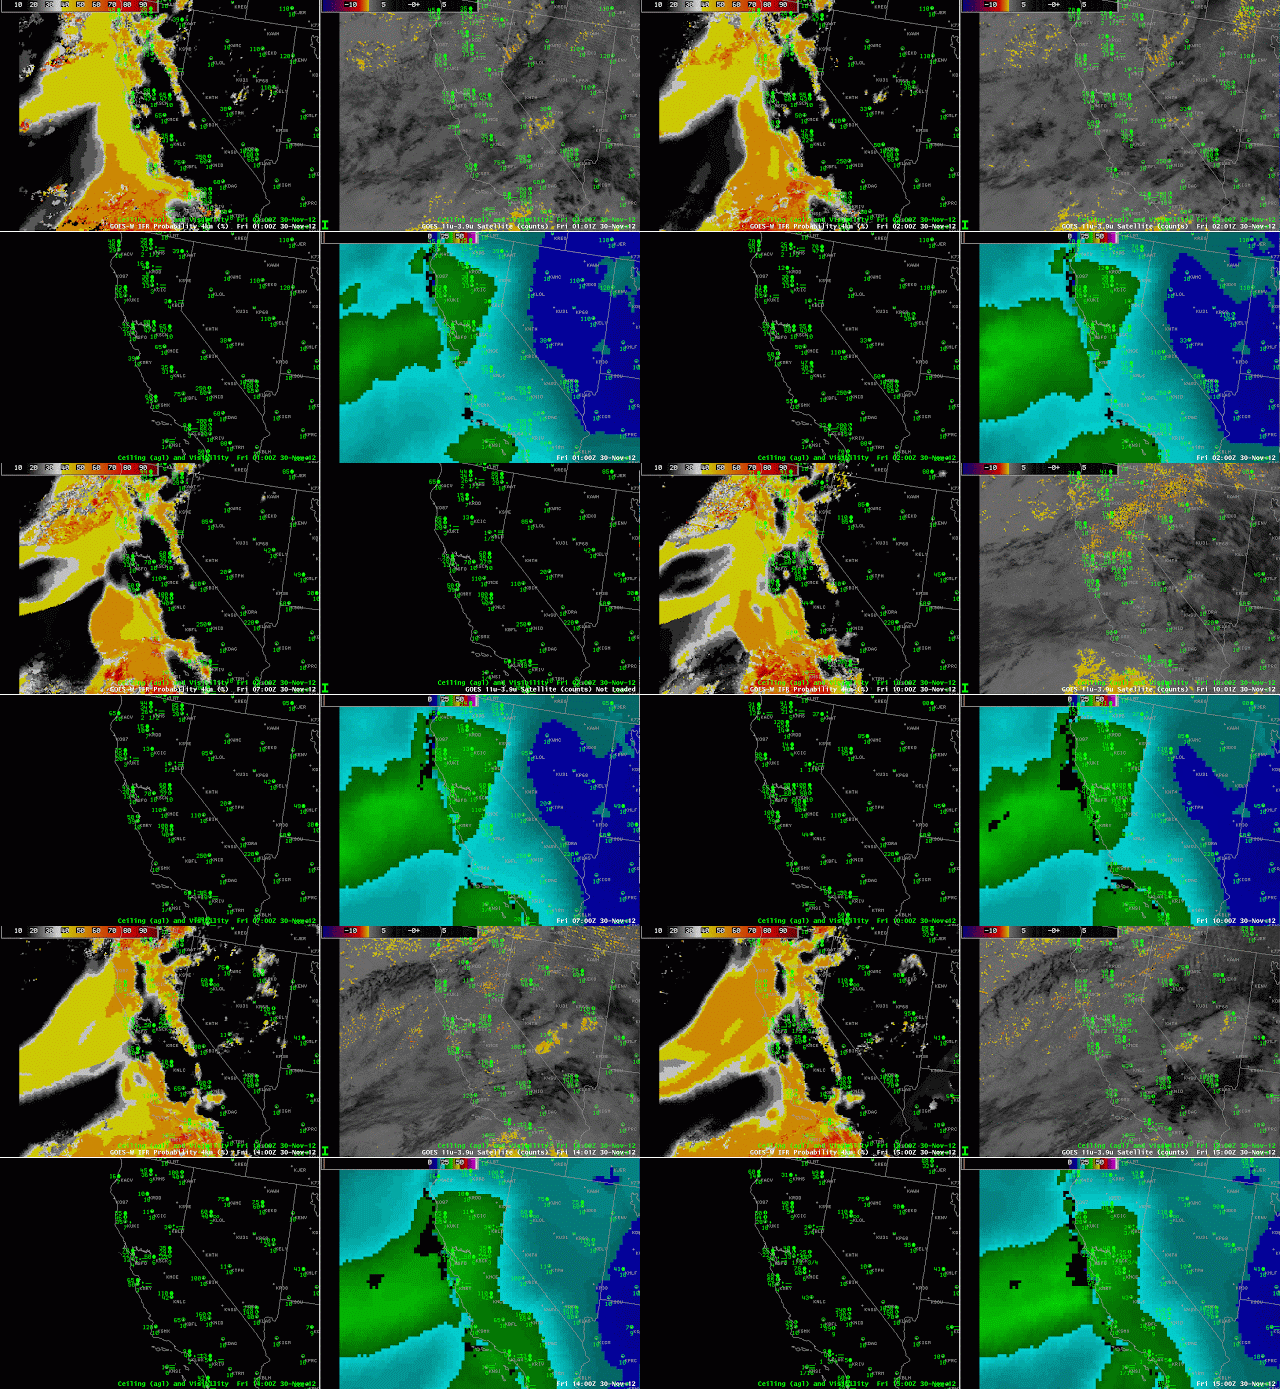
GOES-R IFR Probabilities computed using GOES-West data (upper left), GOES-West traditional brightness temperature difference (10.7 µm – 3.9 µm ) (upper right), surface observations of visibility and ceiling (AGL) (lower left), Blended Total Precipitable Water Product (lower right)

Large extratropical storms are often accompanied by regions of IFR conditions, but the multiple layers of clouds that are produced by the storms make fog/low stratus detection by traditional means — the brightness temperature difference between 10.7µm and 3.9µm microns (at night) — a difficult prospect.  The GOES-R Fog/Low Stratus (FLS) product that fuses satellite data with model (Rapid Refresh) data allows for estimates of IFR probabilities.  The imagery above also includes precipitable water estimates from Sounder, GPS and microwave imagery (bottom right), highlighting the tropospheric river of moisture that is impinging on the West Coast.

Highest IFR probabilities are occurring in several regions in the animation above.  They occur over the Los Angeles basin, for example, where IFR conditions are reported at several airports (San Nicolas and Los Angeles airports, for example).  Reduced visibilities are also occurring in the Sierras — Blue Canyon (at 1500 m above sea level) reports IFR conditions — and IFR probabilities are higher along the spine of the mountains.  IFR probabilities are also higher along the northern California coast, and stations like Ukiah are reporting occasional IFR conditions.  Stations in the central Valley, and along the central coast, are in a region of lower IFR probabilities, and IFR conditions are comparatively rarer there.

Fog/Low stratus in California

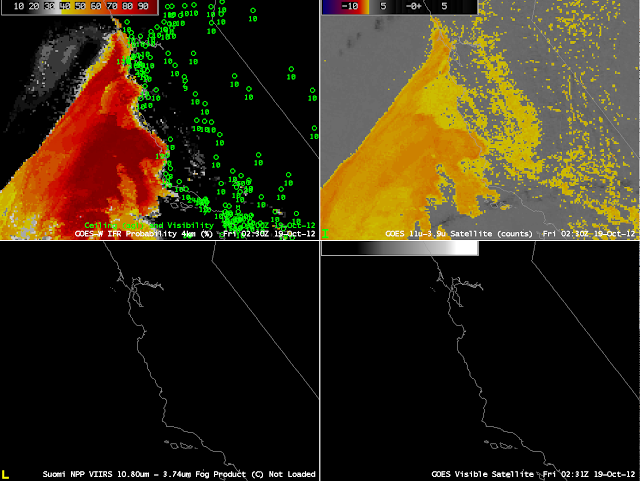
GOES-R IFR Probabilities (Upper left) and GOES-15 brightness temperature difference (10.7 µm – 3.9 µm) (upper right) from 0200 UTC

 GOES-R IFR Probabilities can be used to evaluate and monitor the evolution of marine stratus as it (nightly) moves inland from the Pacific Ocean to adjacent land over California, as well as the evolution of fog and low clouds/haze over the central Valley of California.  At 0200 UTC — near sunset — as shown above, IFR conditions are diagnosed from fused satellite and model data to be most likely offshore, despite a brightness temperature difference signal in California’s Central Valley, where airports are not reporting IFR conditions.  In other words, the GOES-R IFR algorithm is correctly suppressing the satellite signal inland.

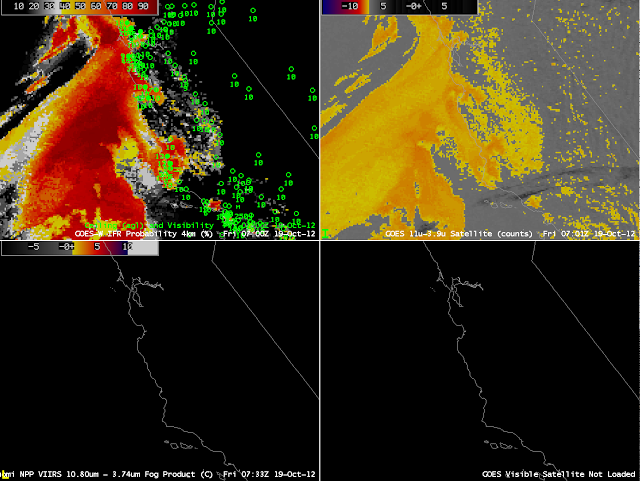
GOES-R IFR Probabilities (Upper left) and GOES-15 brightness temperature difference (10.7 µm – 3.9 µm) (upper right) from 0700 UTC

 By 0700 UTC, ceilings and visibilities in the Salinas and Central Valleys have started to lower as IFR probabilities decrease.

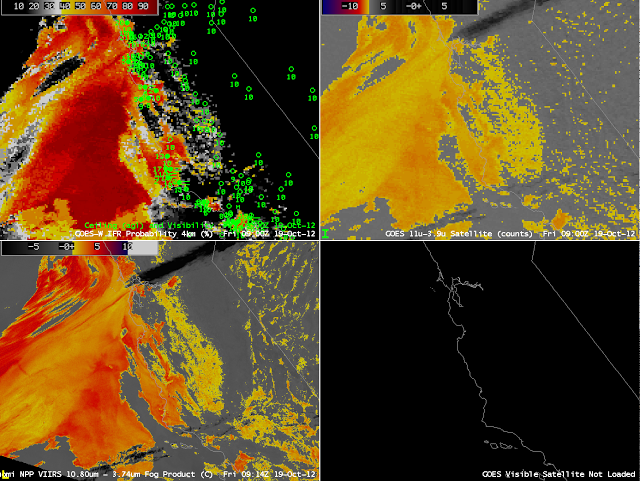
GOES-R IFR Probabilities (Upper left) and GOES-15 brightness temperature difference (10.7 µm – 3.9 µm) (upper right) from 0900 UTC, Suomi NPP Brightness Temperature Difference (10.8 µm – 3.74 µm) (lower left)

 Ceilings and visibilities decrease further by 0900 UTC, as shown above.  Reasons for the difficulty in accurately diagnosing the probabilities over the Salinas Valley can be inferred from the figure above, which includes a (high-resolution) Suomi/NPP Brightness temperature difference plot that has a strong signal all along the Salinas Valley; such a strong signal is not so evident in the GOES brightness temperature difference field that uses data at coarser resolution.  It’s important that the satellite signal is strong in this fused product because the valley is not well-resolved in the Rapid Refresh Model.  When GOES-R is operational, infrared resolution will be 2 km — in between that of Suomi/NPP (1 km) and GOES (4 km).

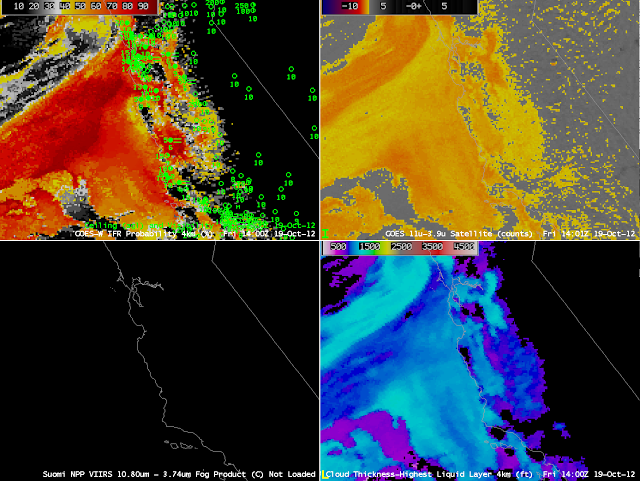
GOES-R IFR Probabilities (Upper left) and GOES-15 brightness temperature difference (10.7 µm – 3.9 µm) (upper right) from 1400 UTC, GOES-R Cloud Thickness (lower left)

 The 1400 UTC image includes cloud thickness as diagnosed by the GOES-R algorithm.  Cloud thickness is well correlated with dissipation time for radiation fog — but not necessarily for advection fog.  Nevertheless, the regions diagnosed with thickest fog above continue to show fog in the visible imagery below, from 1600 UTC.

GOES-R IFR Probabilities (Upper left) and GOES-15 brightness temperature difference (10.7 µm – 3.9 µm) (upper right) from 1400 UTC, GOES-15 Visible Imagery (lower left)

IFR Probabilities in central California

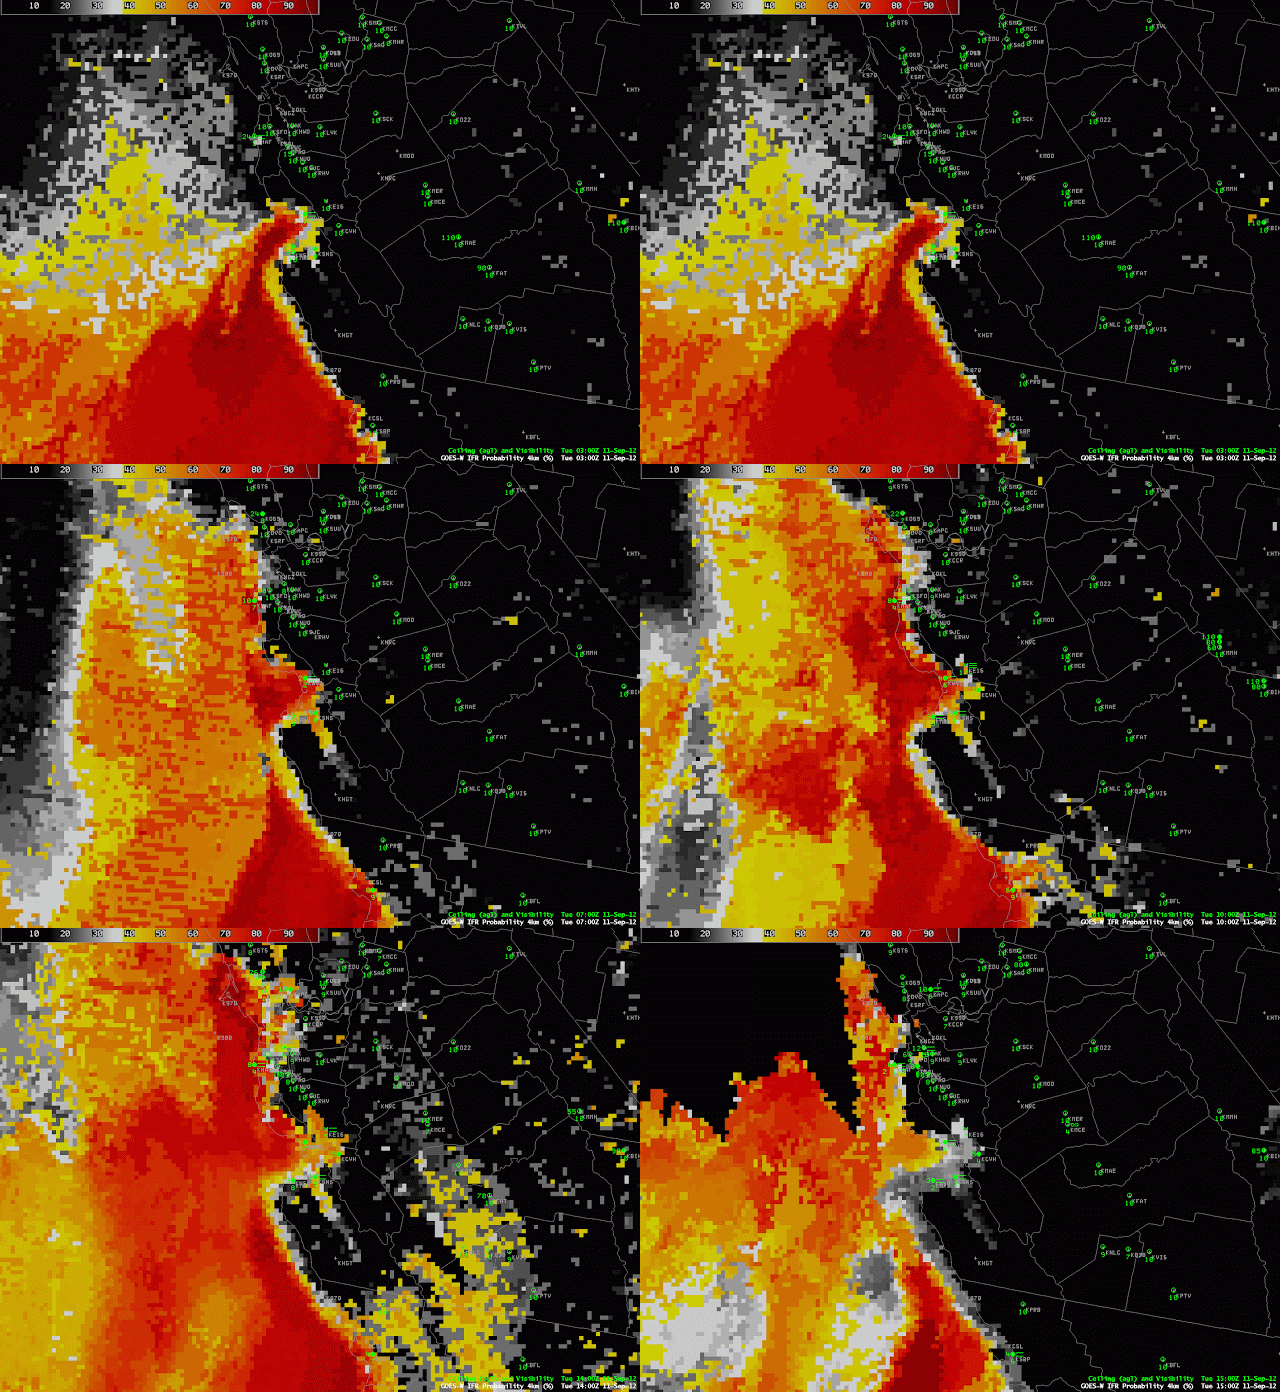
GOES-West GOES-R IFR Probabilities from 0500 UTC through 1400 UTC 11 Sept 2012

Low clouds and fog are a climatologically normal feature of the Pacific Ocean off the coast of California, abetted by the upwelling of cold water there.  It’s also common for those low clouds and fog to spread inland over the course of the night, and the animation above shows how the IFR product handled the evolution of the low clouds during early September.  There are several sites where IFR conditions develop as the IFR probability field values increase:  Hollister, CA (KCVH), South Santa Clara County Airport (KE16), Hanford (KHAF) and San Francisco International (KSFO).  Monterey, Salinas and Watsonville (KMRY, KSNS, KWVI) spend the night in IFR conditions, and a tongue of higher probabilities extends down that Salinas Valley as well.  At 1500 UTC, the sun has risen, and cloud detection allows the elimination of many IFR Probabilities in regions where — at 1500 UTC — any fog/low clouds that developed over night have dissipated.