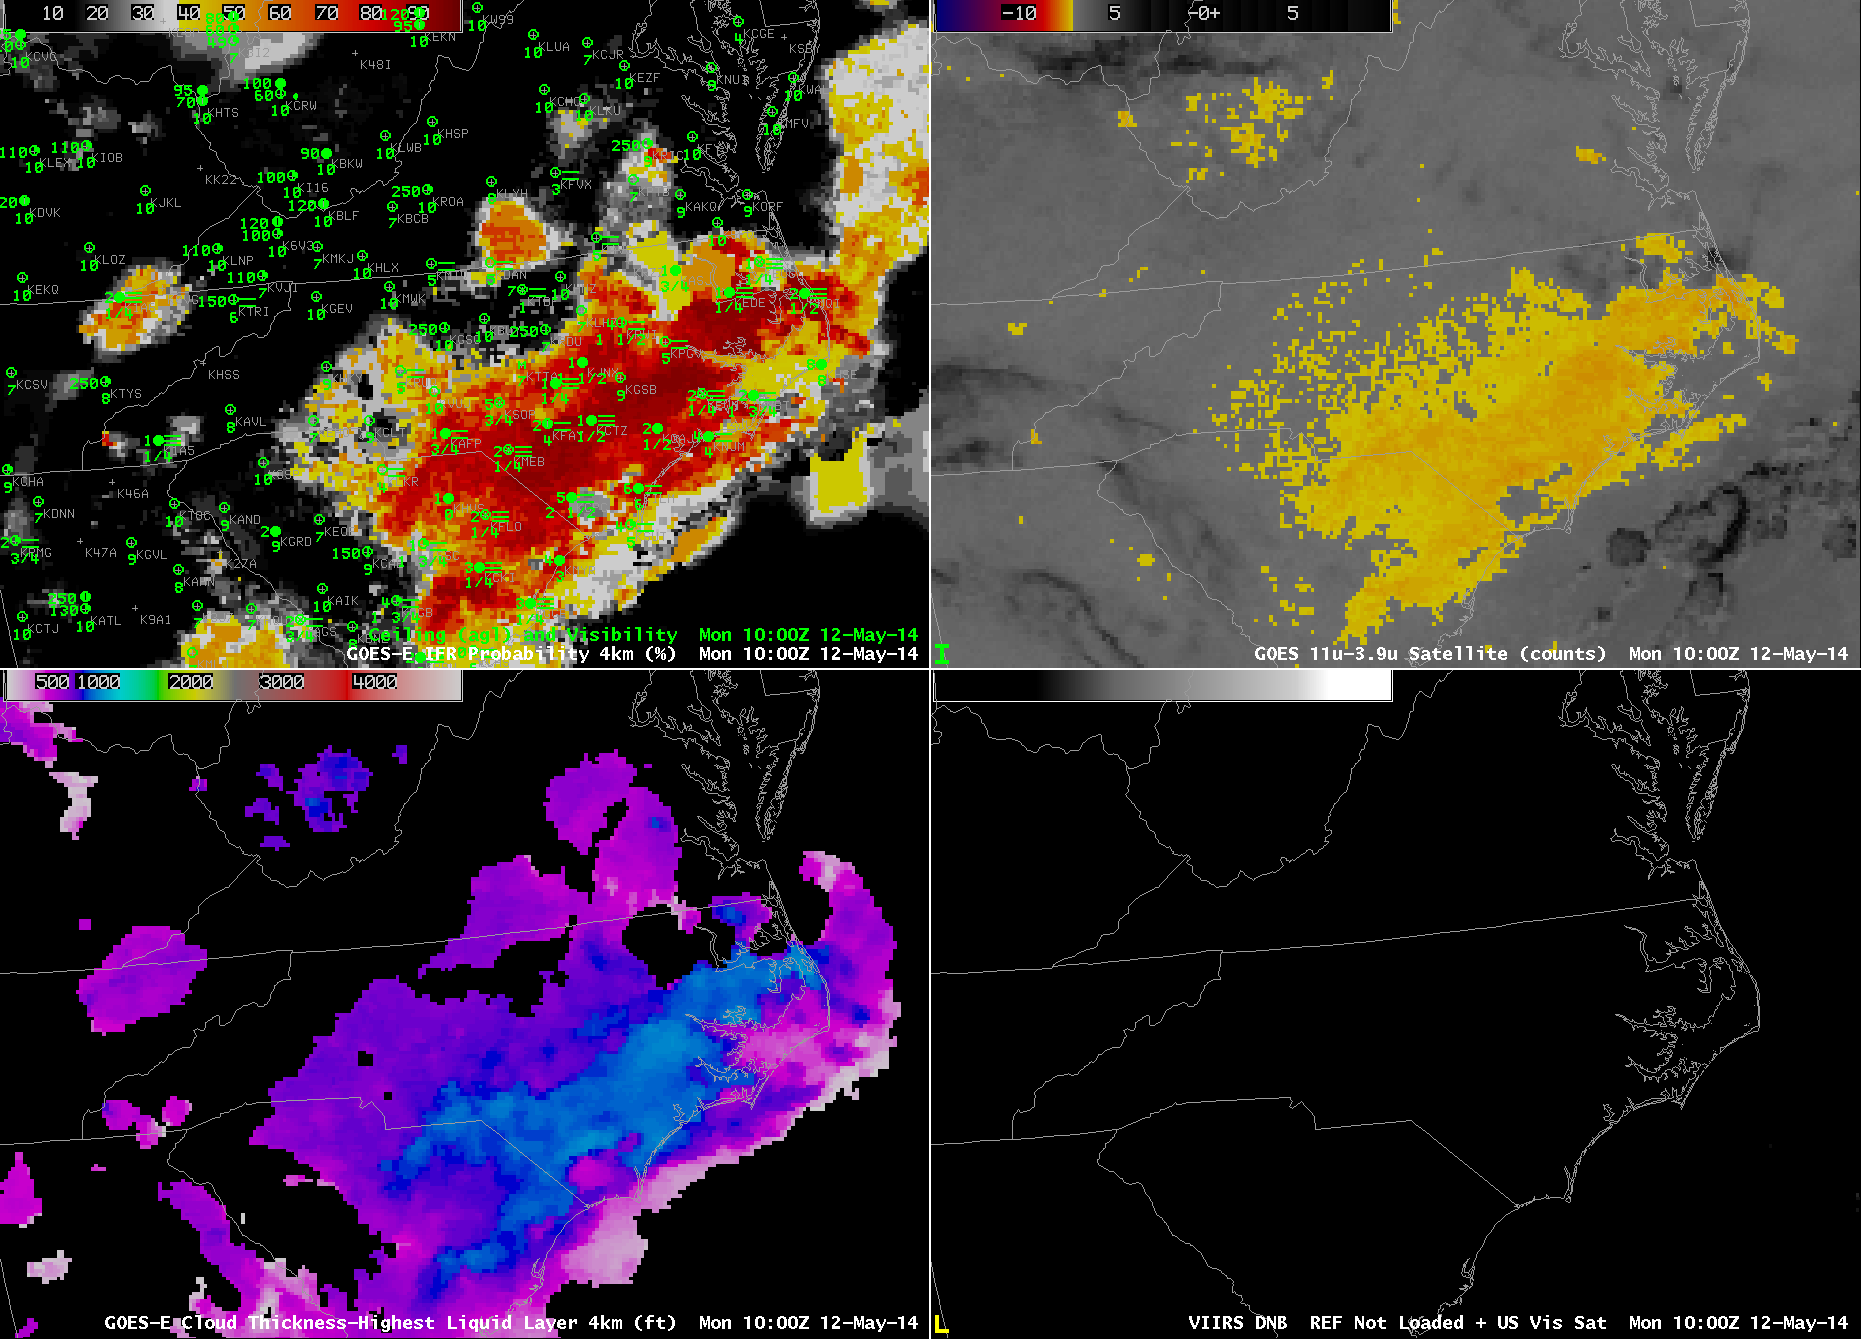
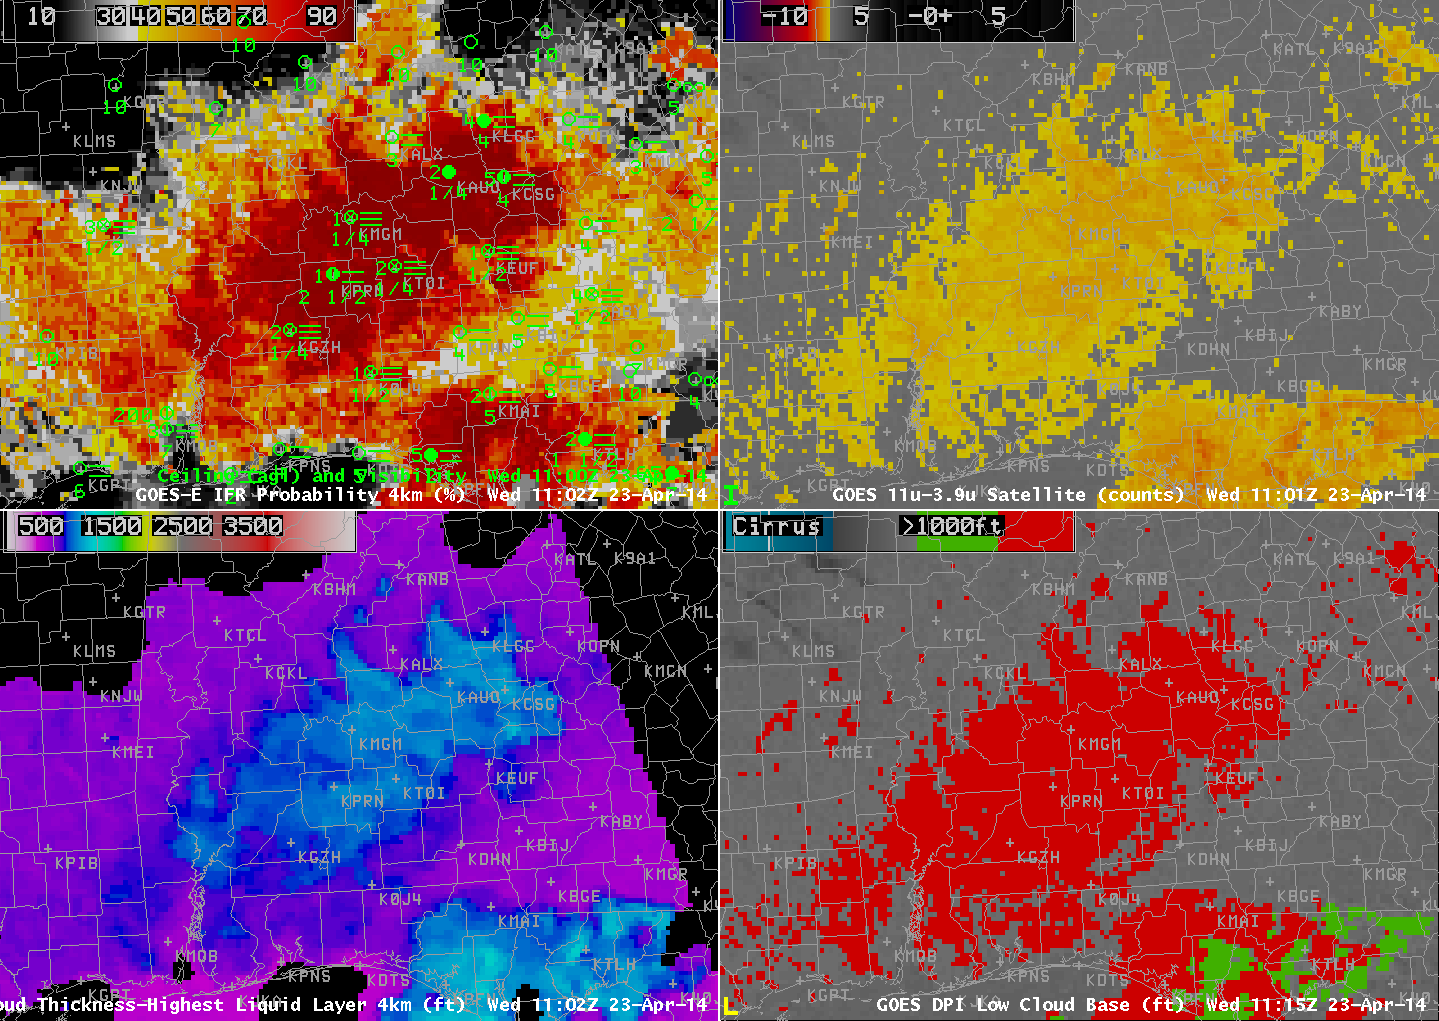
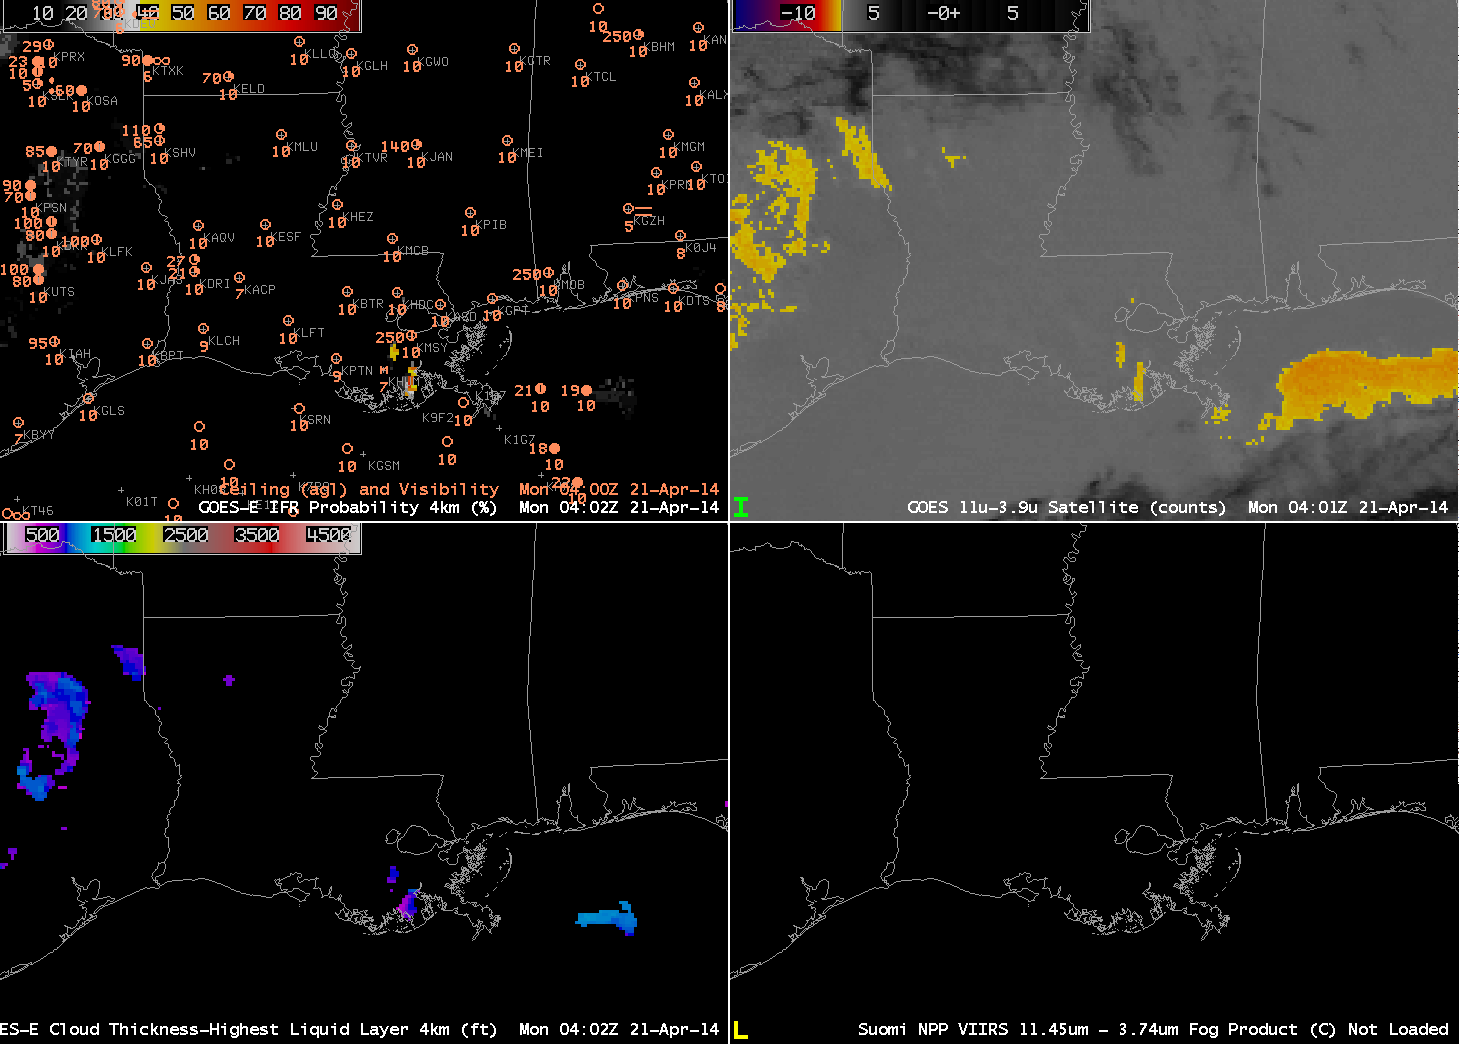
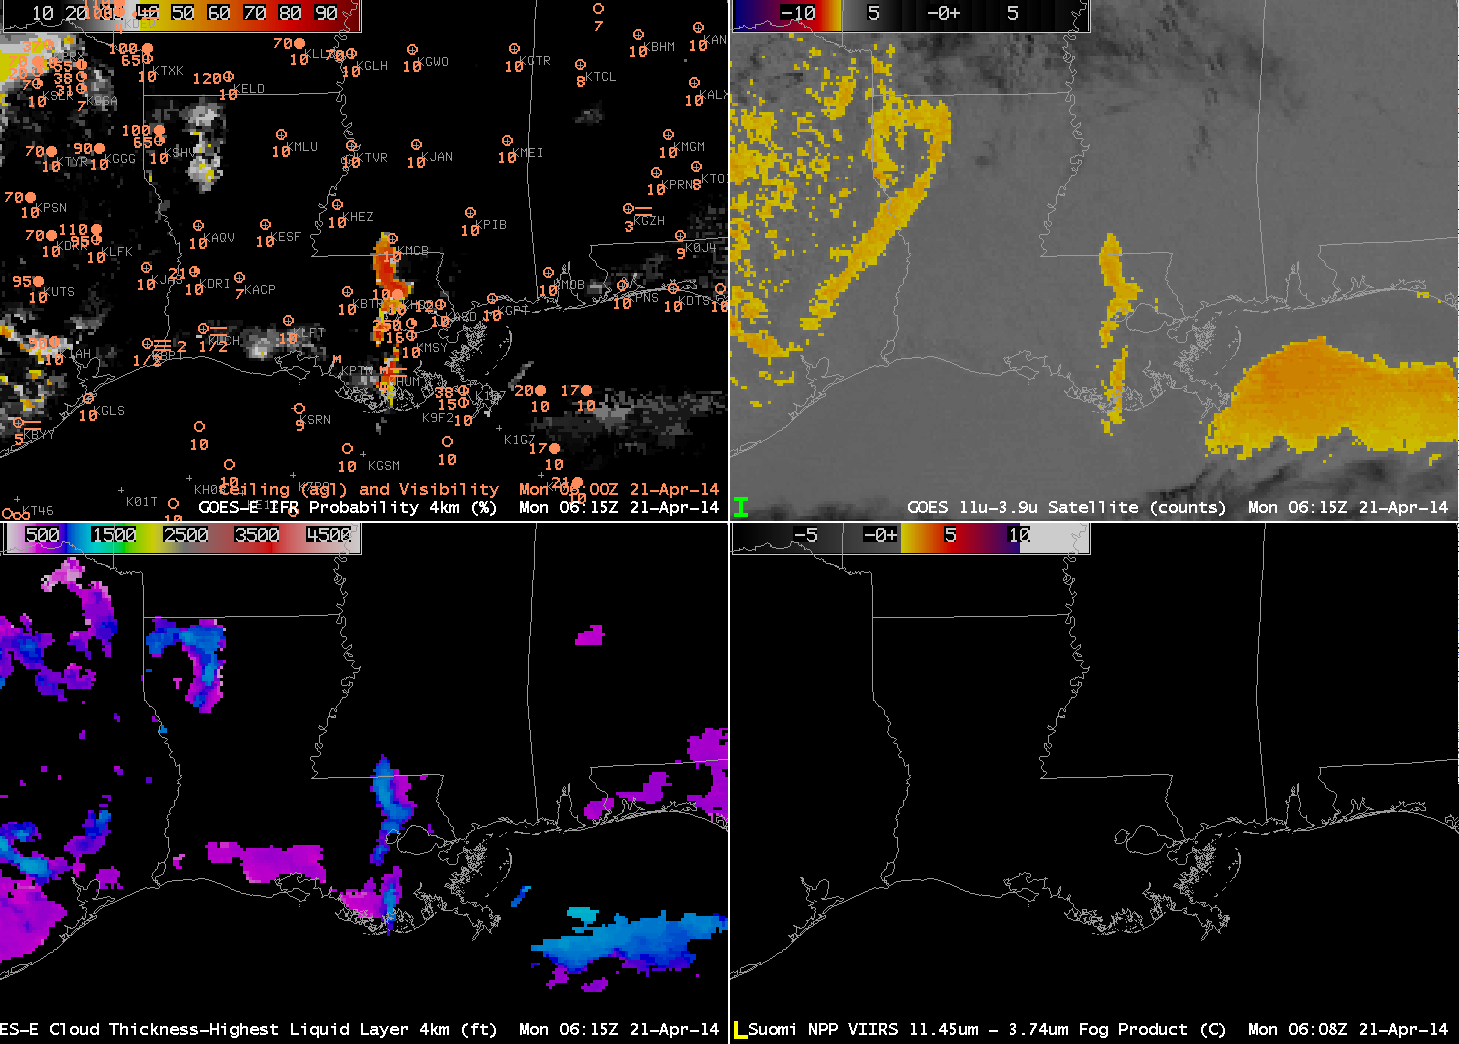
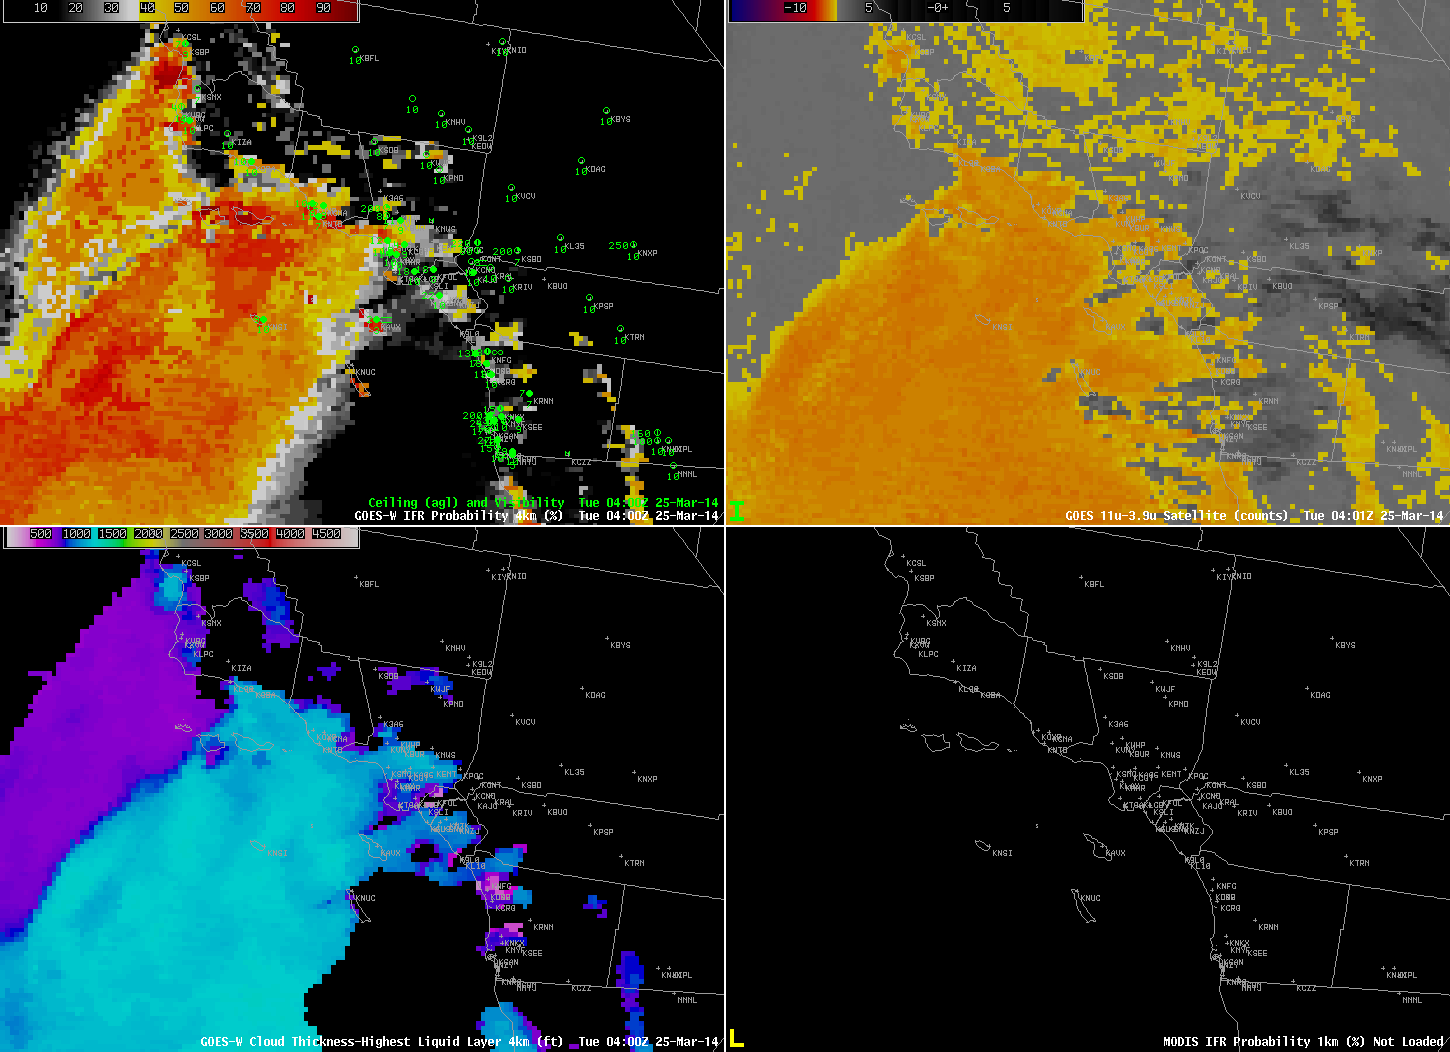
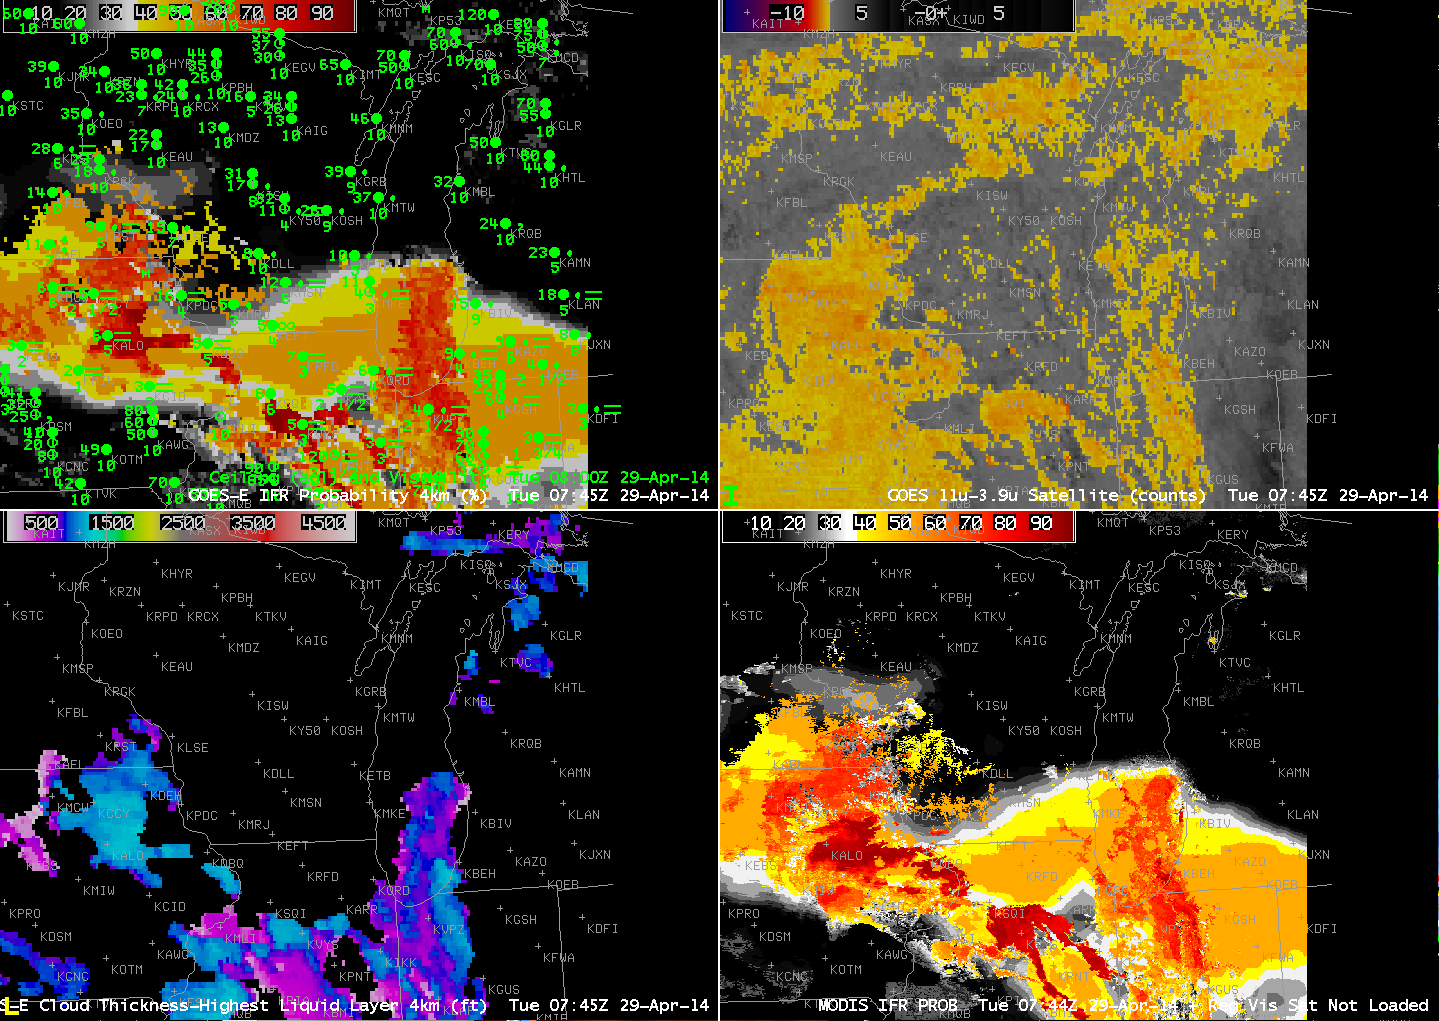
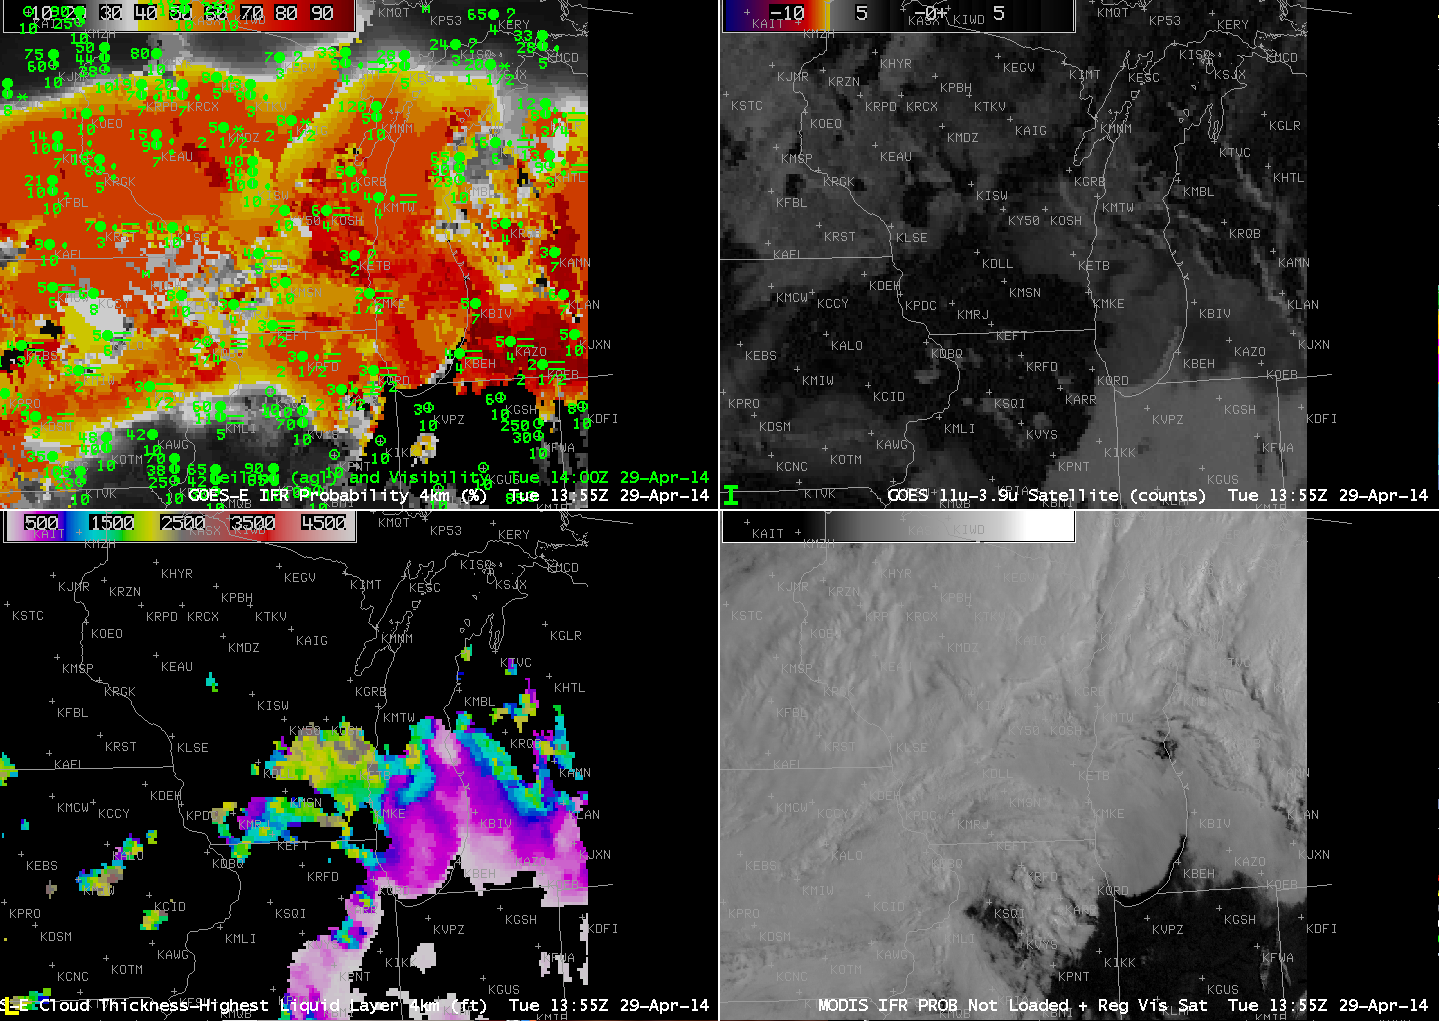
GOES-R IFR Probabilities with observations of ceilings/visibilities (Upper Left), GOES-East Brightness Temperature Difference (10.7µm – 3.9µm) (Upper Right), GOES-R Cloud Thickness (Lower Left), Suomi/NPP VIIRS Day/Night Band (0.70 µm, at night) or GOES-East Visible imagery (0.63 µm, during day), Times as indicated (Click to enlarge)
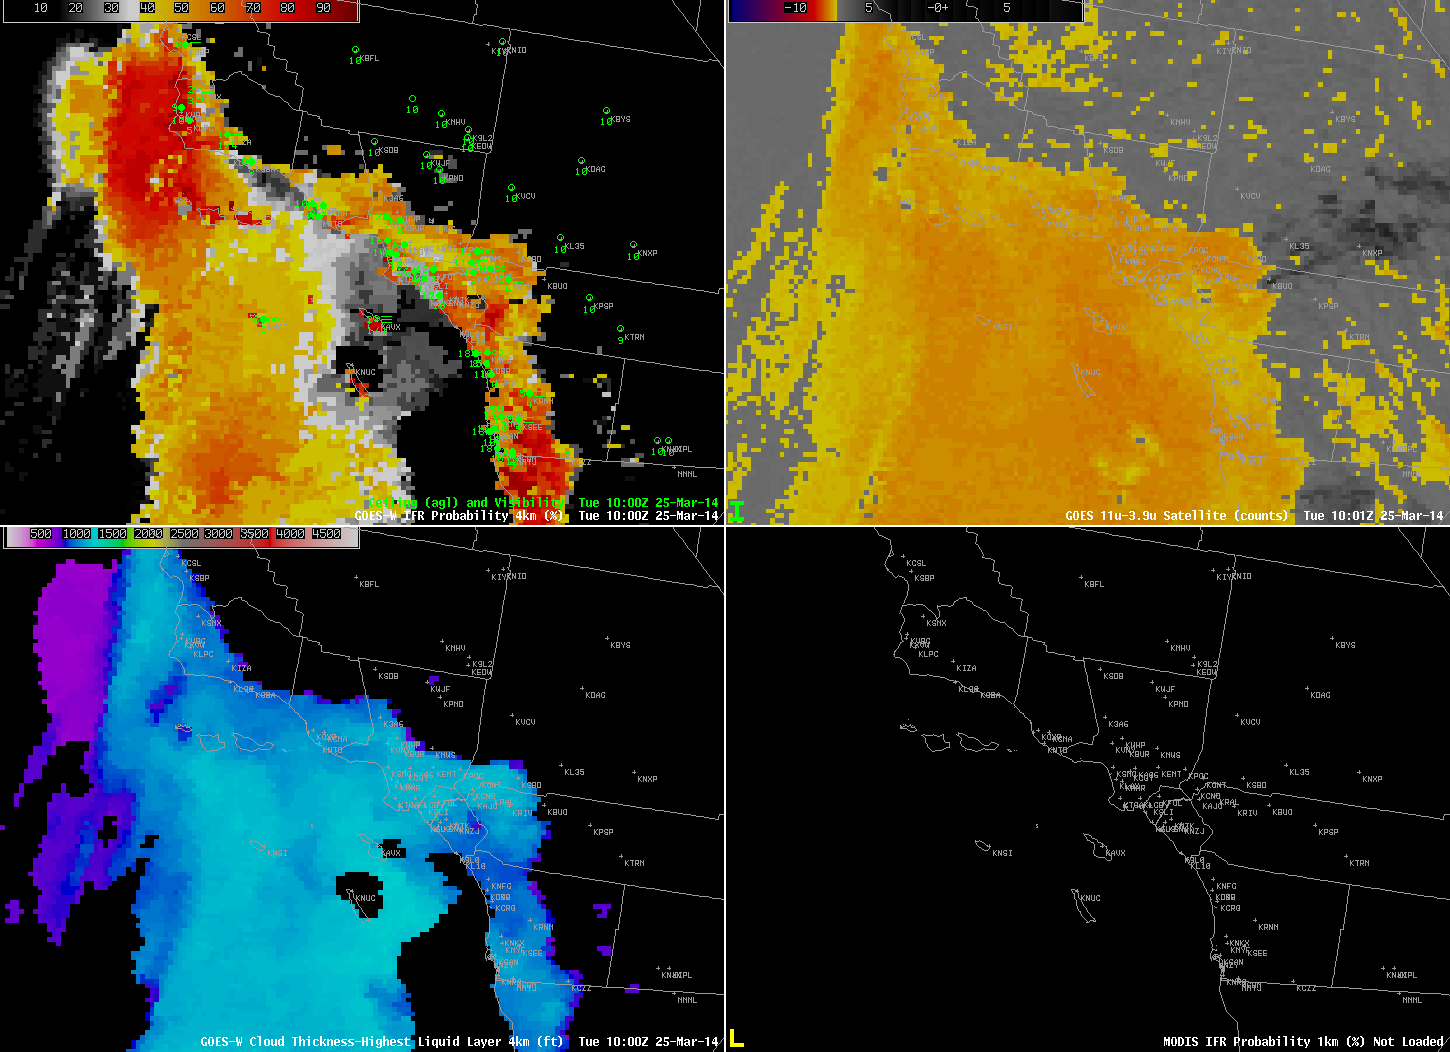
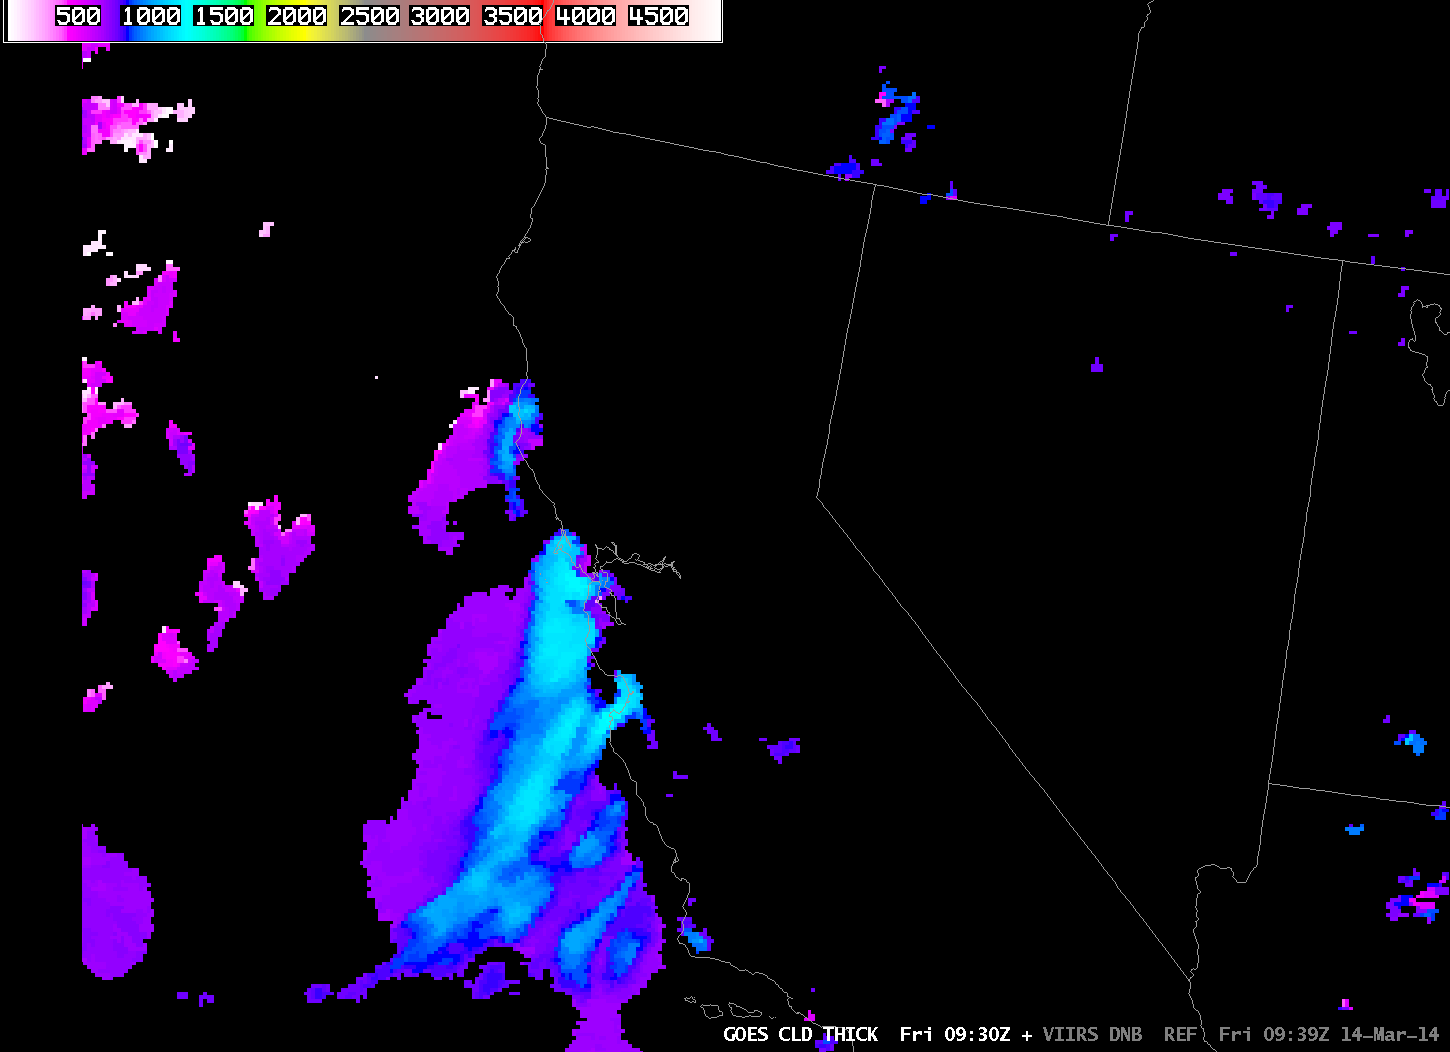
Clear skies allowed for radiation fog with IFR conditions to develop over eastern North Carolina overnight. GOES-R Cloud Thickness as observed at the last time before twilight conditions begin — in this case at 1000 UTC (6 AM EDT) — can be used as a predictor for fog dissipation time using this chart. At 1000 UTC, maximum cloud thickness was 1000 feet, which suggests a dissipation time around 1300-1330 UTC.
The visible animation, below, is in agreement with the prediction from the cloud thickness field.

GOES-East Visible Imagery (0.62 µm) Times as indicated (Click to enlarge)
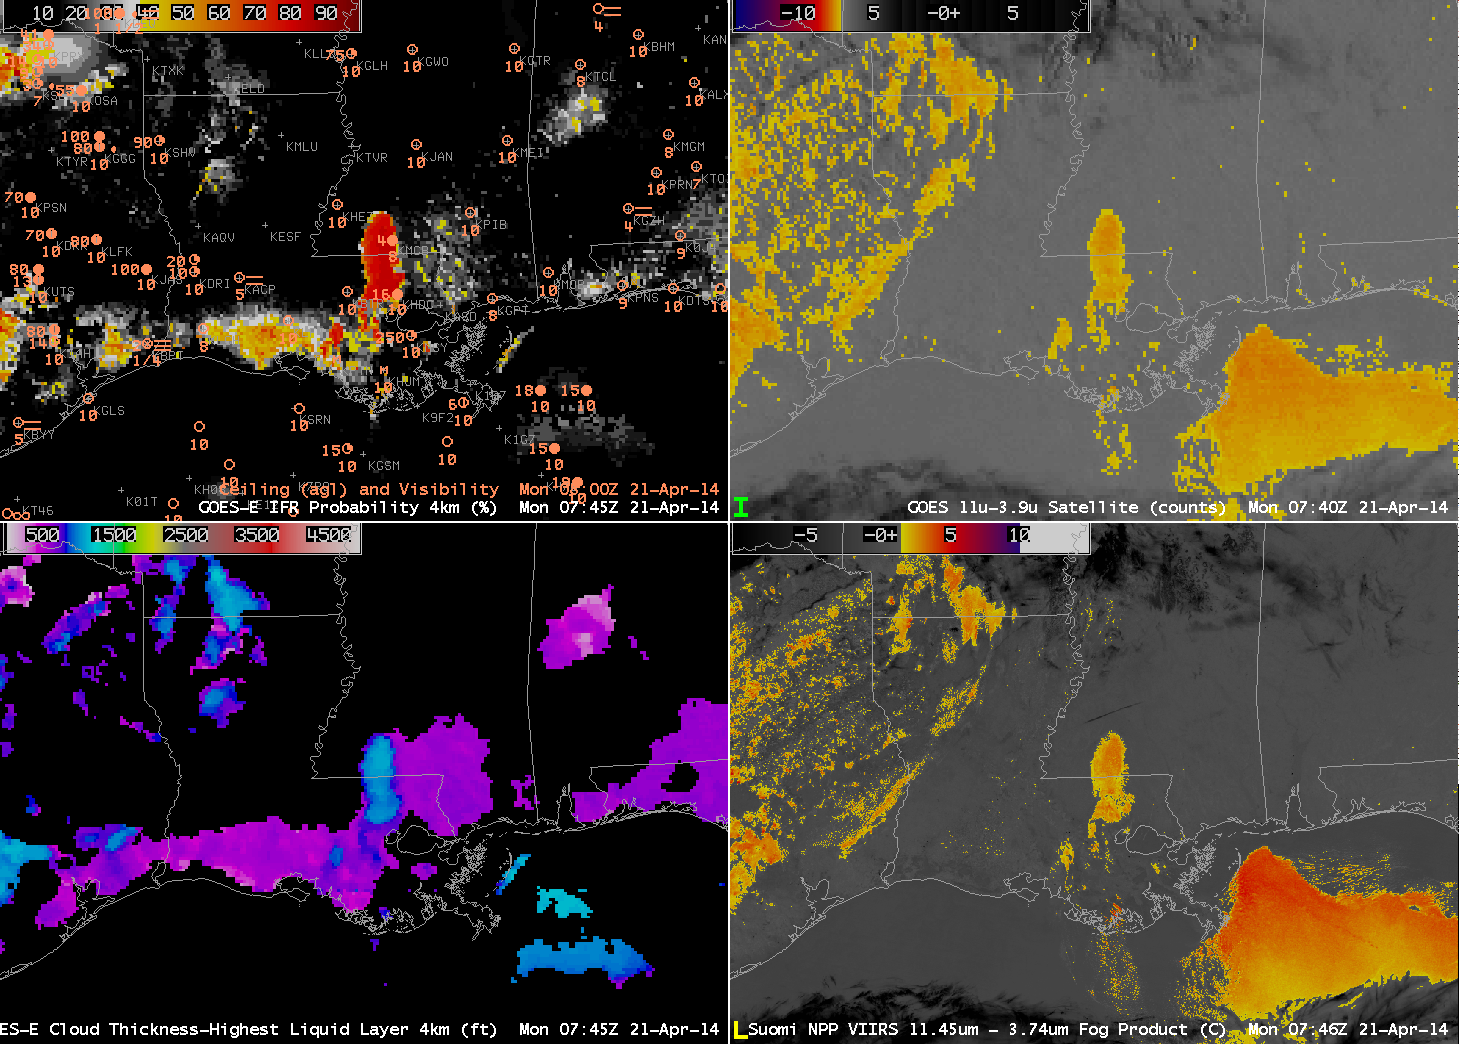
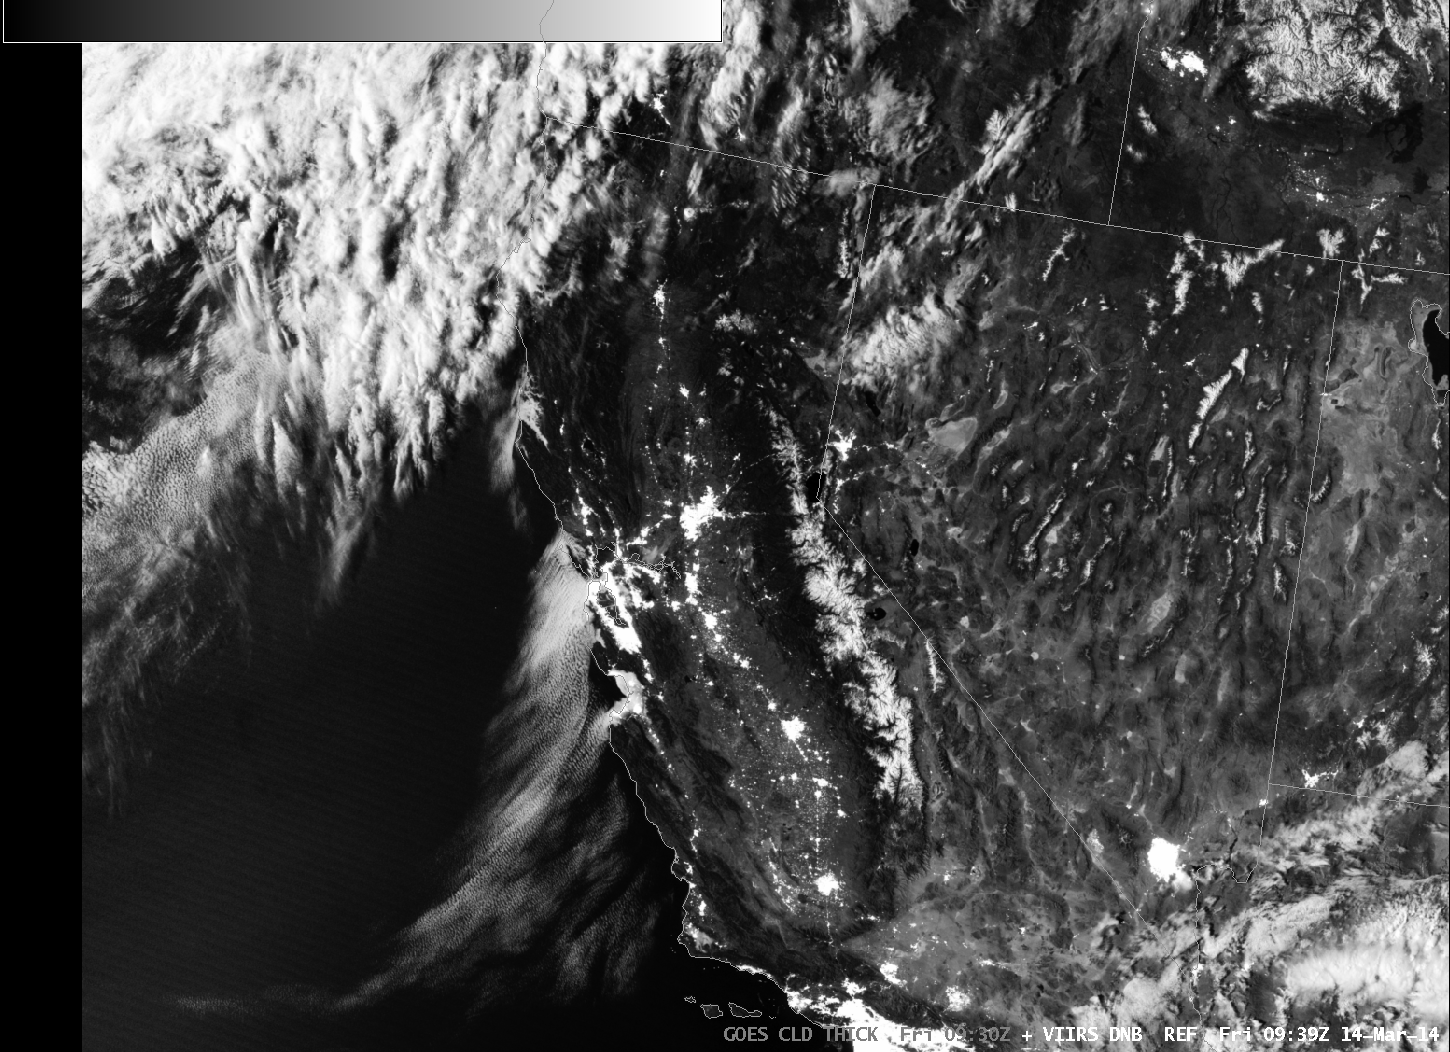
A toggle of two images with Day/Night band imagery, below, shows the difficulty in using the Day/Night band to identify regions of fog/low clouds consistently. In the 0615 UTC image, the developing low clouds show up well (Of course, it’s hard to tell if the clouds are low stratus or mid-level stratus), but the picture at 0745 UTC is a lot less distinct.
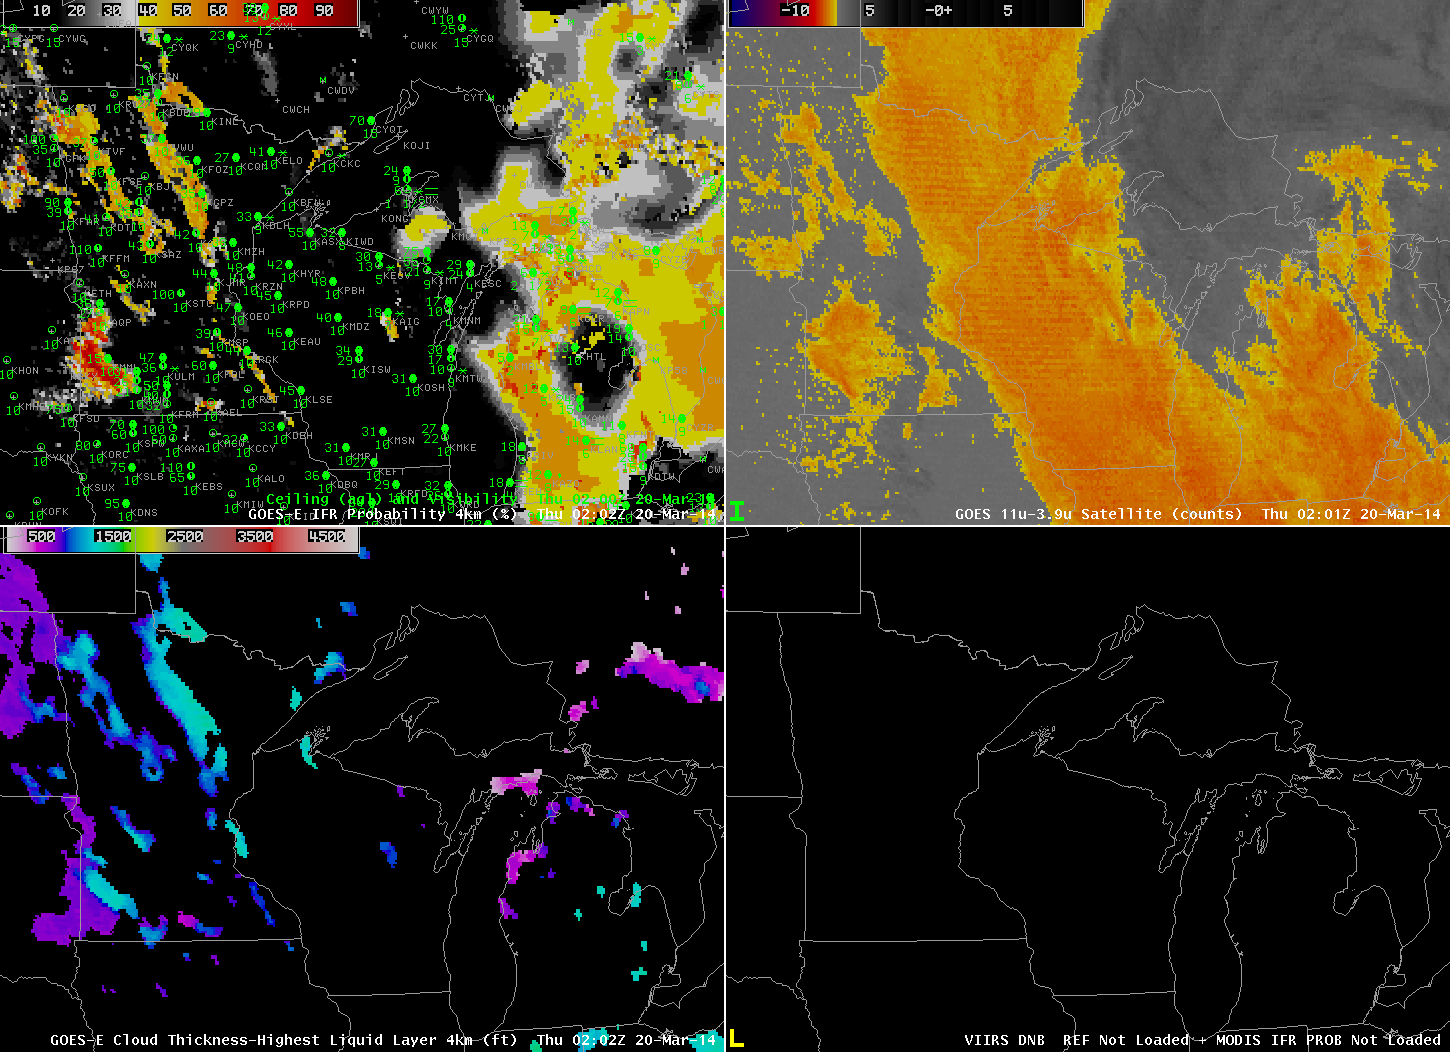
GOES-R IFR Probabilities with observations of ceilings/visibilities (Upper Left), GOES-East Brightness Temperature Difference (10.7µm – 3.9µm) (Upper Right), GOES-R Cloud Thickness (Lower Left), Suomi/NPP VIIRS Day/Night Band (0.70 µm), Times as indicated (Click to enlarge)
A toggle of two images with Day/Night band imagery, below, shows the difficulty in using the Day/Night band to identify regions of fog/low clouds consistently. In the 0615 UTC image, the developing low clouds show up well (Of course, it’s hard to tell if the clouds are low stratus or mid-level stratus), but the picture at 0745 UTC is a lot less distinct.
