Author Archives: Scott Lindstrom

Multiple Cloud Layers and Topography

IFR_1315_22Apr2016

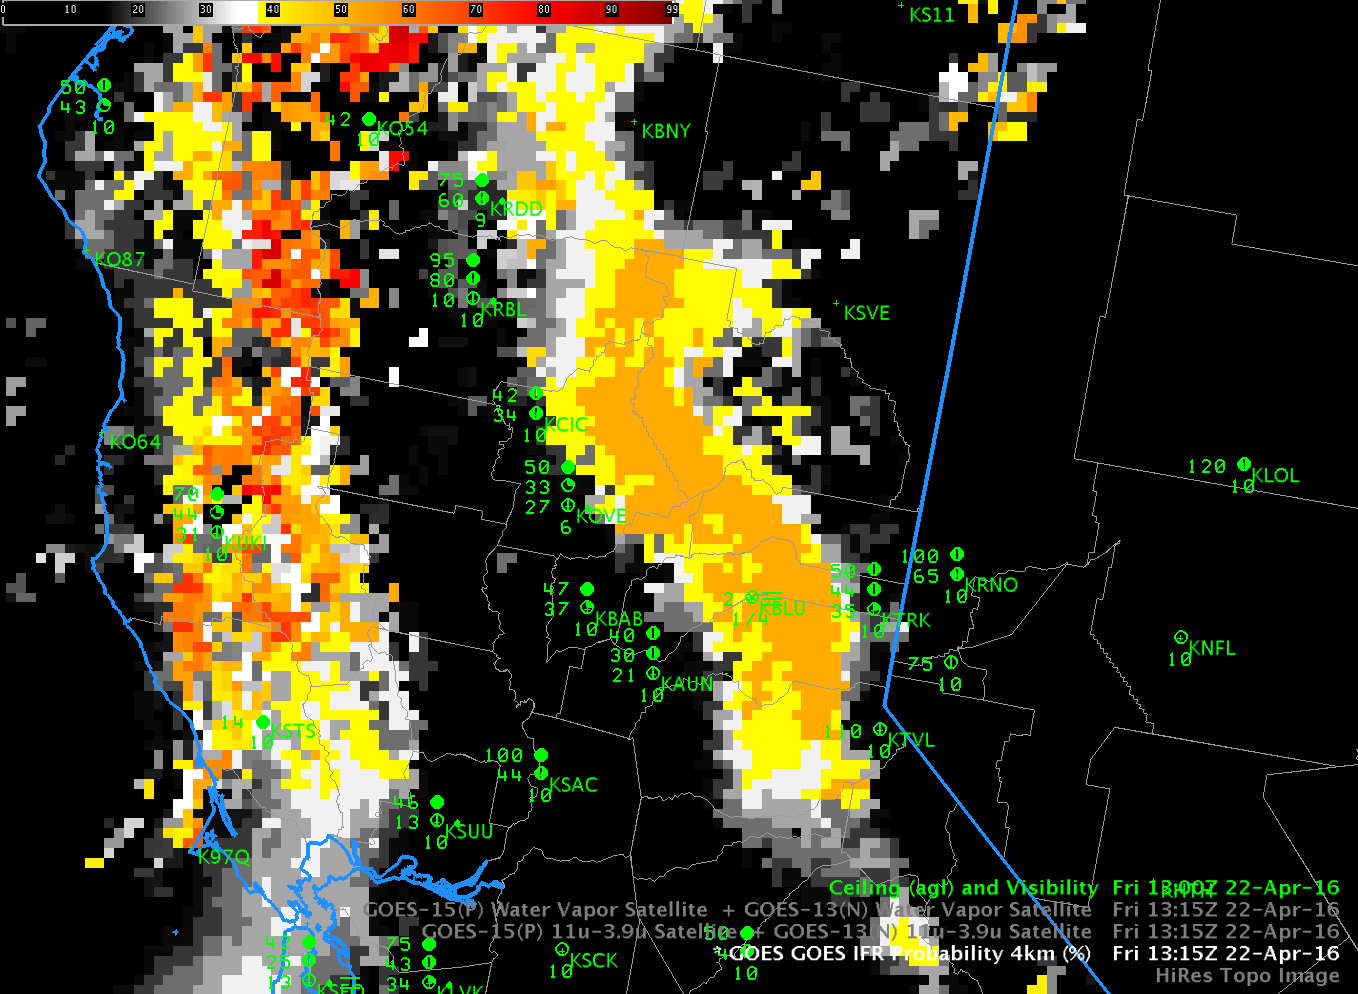
GOES-R IFR Probability Fields, 1315 UTC on 22 April 2016, along with surface observations of ceilings and visibilities (Click to enlarge)

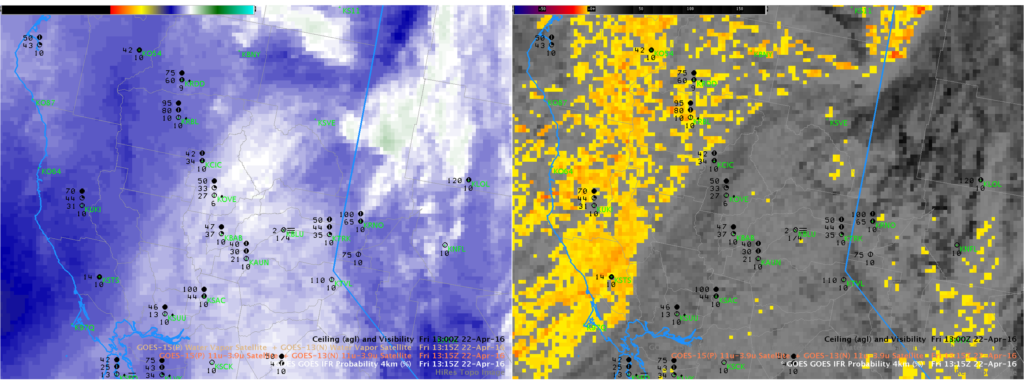
The 1315 UTC image of GOES-R IFR Probabilities, above, shows an axis of higher probabilities aligned with the topography of the Sierra Nevada. Note that Blue Canyon (KBLU) is the sole station reporting IFR Conditions. Did conventional satellite data capture this event? The Water Vapor (6.5µm) and Brightness Temperature Difference fields (10.7µm – 3.9µm), below, do not show evidence of low clouds;  indeed, the cirrus signature in the water vapor must mask any satellite observation of low clouds banked along the Sierra Nevada. Thus a fused product that combines model data and satellite data (such as IFR Probability fields) must be used, and the relatively flat nature of the IFR Probability field above confirms that Rapid Refresh information on low-level saturation is the reason why IFR Probability values are elevated along the mountains.
WV_BTD_1315_22Apr2016

GOES-15 Water Vapor (6.5 µm), left, and GOES-15 Brightness Temperature Difference Field (10.7 µm – 3.9 µm), right, at 1315 UTC 22 April 2016 (Click to enlarge)

IFR Probability Fields earlier in the night did have a satellite component to them. The values at 0300 and 0600, below, show the gradual encroachment of cirrus from the south and west over the low clouds along the Sierra Nevada. After 0600 UTC, only model data were used over the Sierra as high-level cirrus blocked the satellite view.

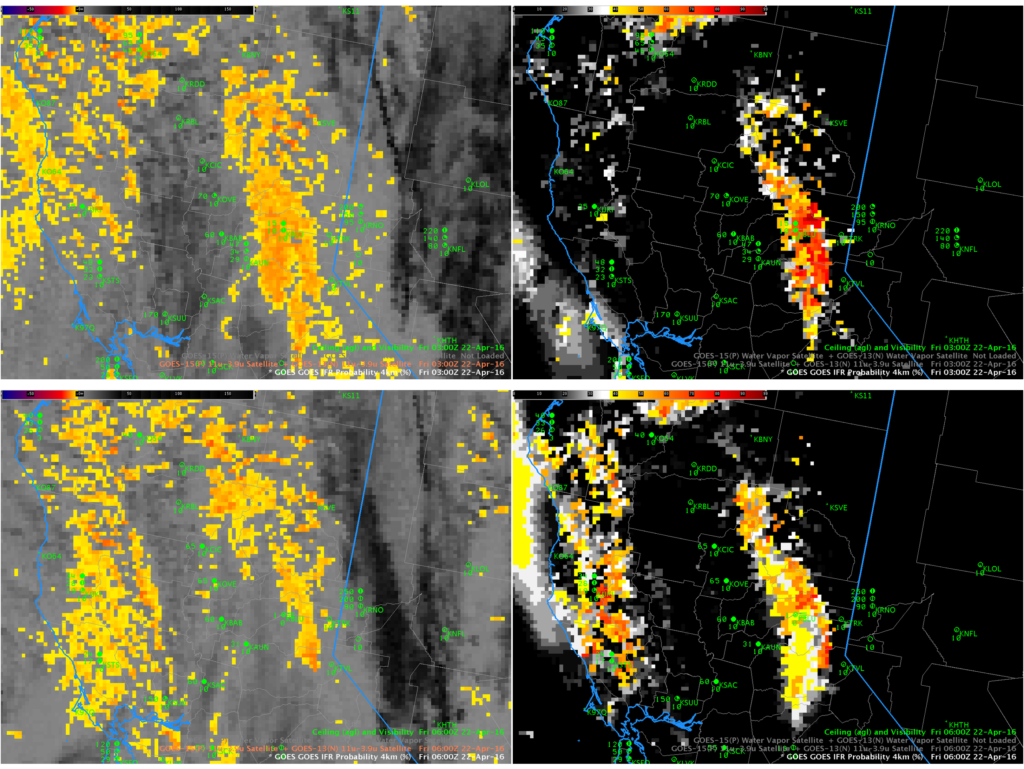
IFR_BTD_03_06_22Apr2016

Brightness Temperature Difference (10.7µm – 3.9µm) Fields (Left) and GOES-R IFR Probaility Fields (Right) from 0300 (Top) and 0600 (Bottom) on 22 April 2016 (Click to enlarge)

Reduced Visibilities under multiple cloud layers in the Northern Plains

GIFR_P_1115_18Apr2016

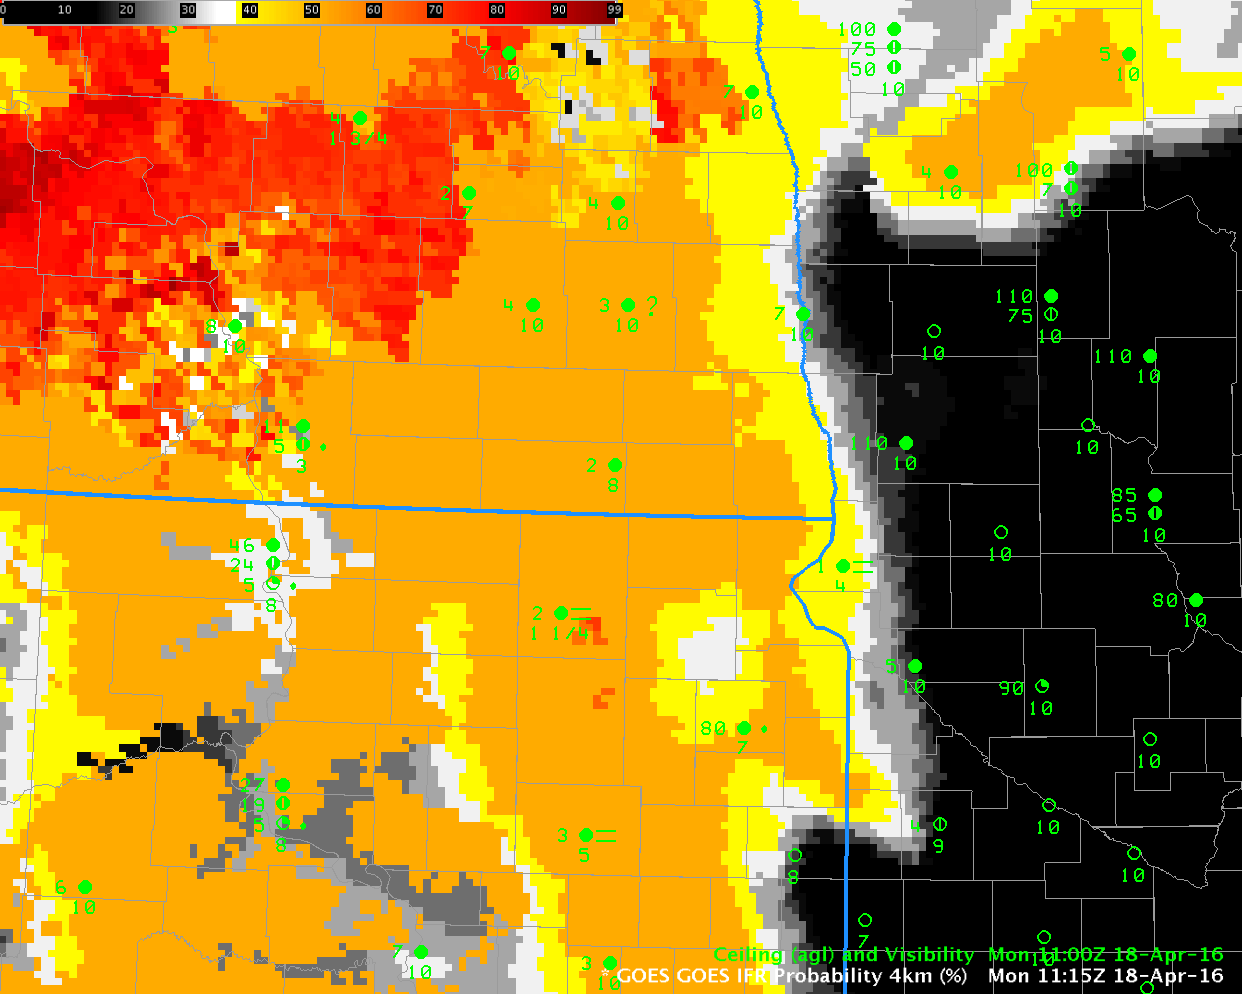
GOES-R IFR Probabilities at 1115 UTC and 1100 UTC surface observations of ceiling and visibility (Click to enlarge)

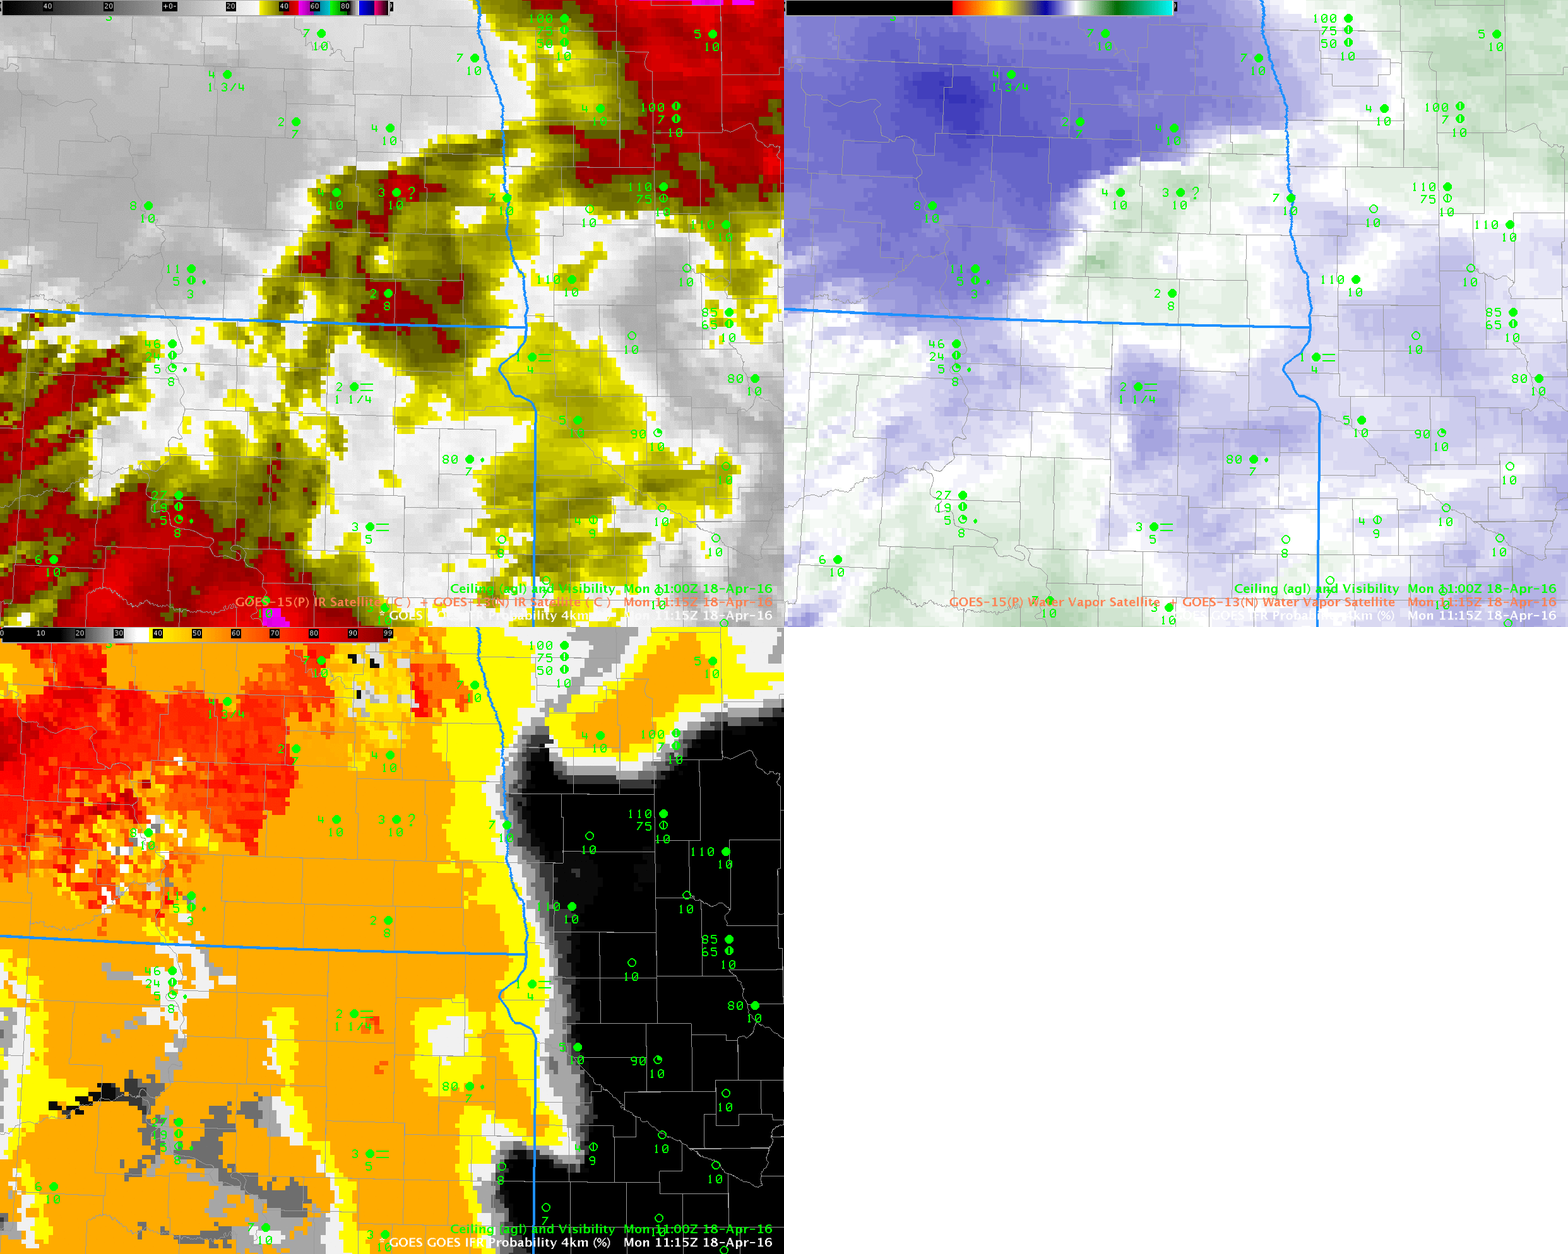
The image above shows GOES-R IFR Probabilities over North/South Dakota and Minnesota shortly before sunrise on Monday April 18 2016.  There is a distinct difference in the field between western Minnesota and eastern North and South Dakota that occurs because Rapid Refresh model fields (low-level saturation) are used as a predictor of IFR Probability.  Reduced visibilities and ceilings are reported where IFR Probabilities exceed 50% (the orange shading).  In contrast, the window channel and water vapor imagery for the same time, below, gives little indication that fog and low ceilings are present over eastern North and South Dakota:  satellite views of the lowest levels are blocked by mid- and upper-level clouds.   Fusing model data and satellite data into one predictor yields a superior product for detection of low ceilings and reduced visibilities.

3PanelToggle_1115anim.IR4IR3IFRP

GOES Infrared imagery (10.7 µm and 6.5 µm) and GOES-R IFR Probability fields, 1115 UTC on 18 April (Click to enlarge)

Fog along the Gulf Coast in Louisiana

GOESBTD_0245_1245anim_05Apr2016

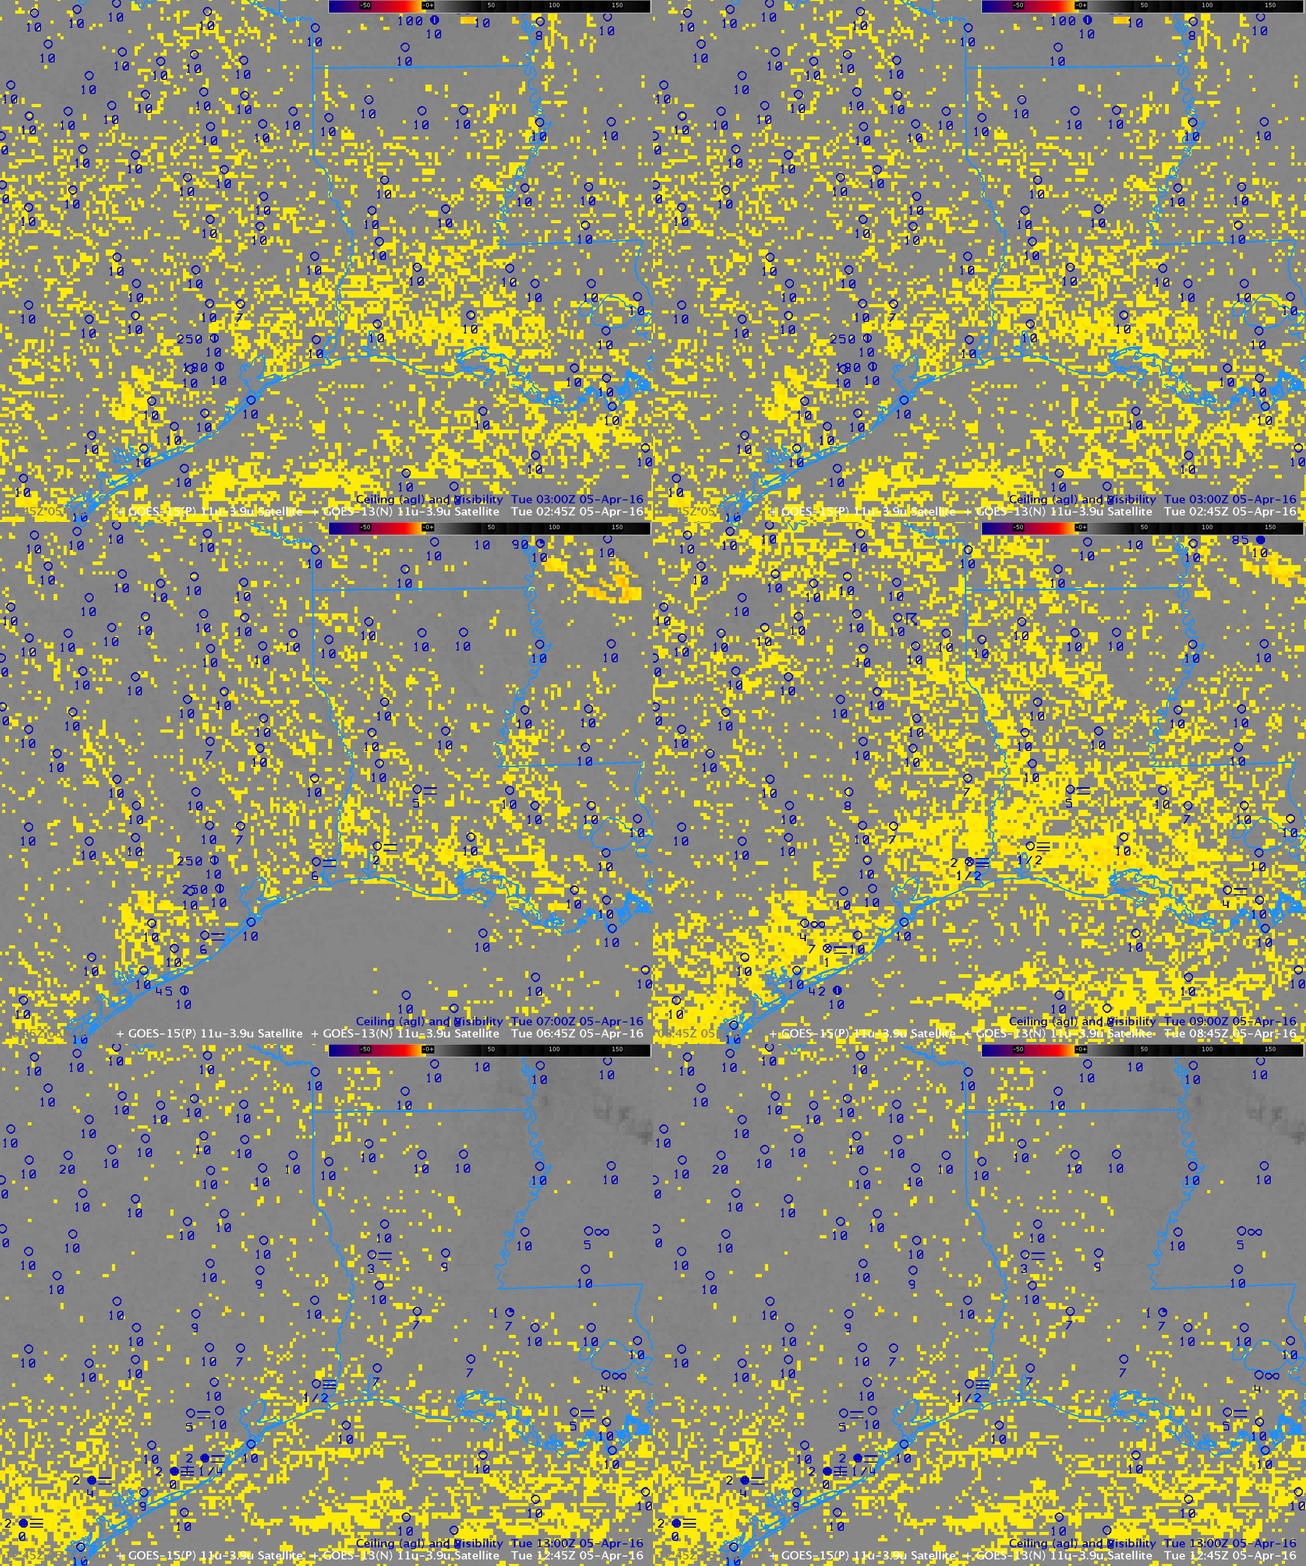
GOES-13 Brightness Temperature Difference Fields, every two hours from 0245 to 1245 UTC, 5 April 2016 (Click to enlarge)

Fog developed along the Gulf Coast of western Louisiana overnight. Brightness temperature difference fields have been used in the past to diagnose the development of fog. This capability exists because water-based clouds, such as stratus, have different emissivity properties at 3.9 µm and 10.7 µm. A water-based clouds does not emit 3.9 µm radiation as a blackbody (but it does emit 10.7 µm radiation as a blackbody). Consequently, the computed temperature of the cloud based on the detected 3.9 radiation is cooler than the temperature computed based on the detected 10.7 radiation. The animation above shows the evolution of the brightness temperature difference field, and the field is characterized by a lot of scattershot signal. Some river valley can be inferred in the signal, but the region of fog over southwestern Louisiana does not stand out.

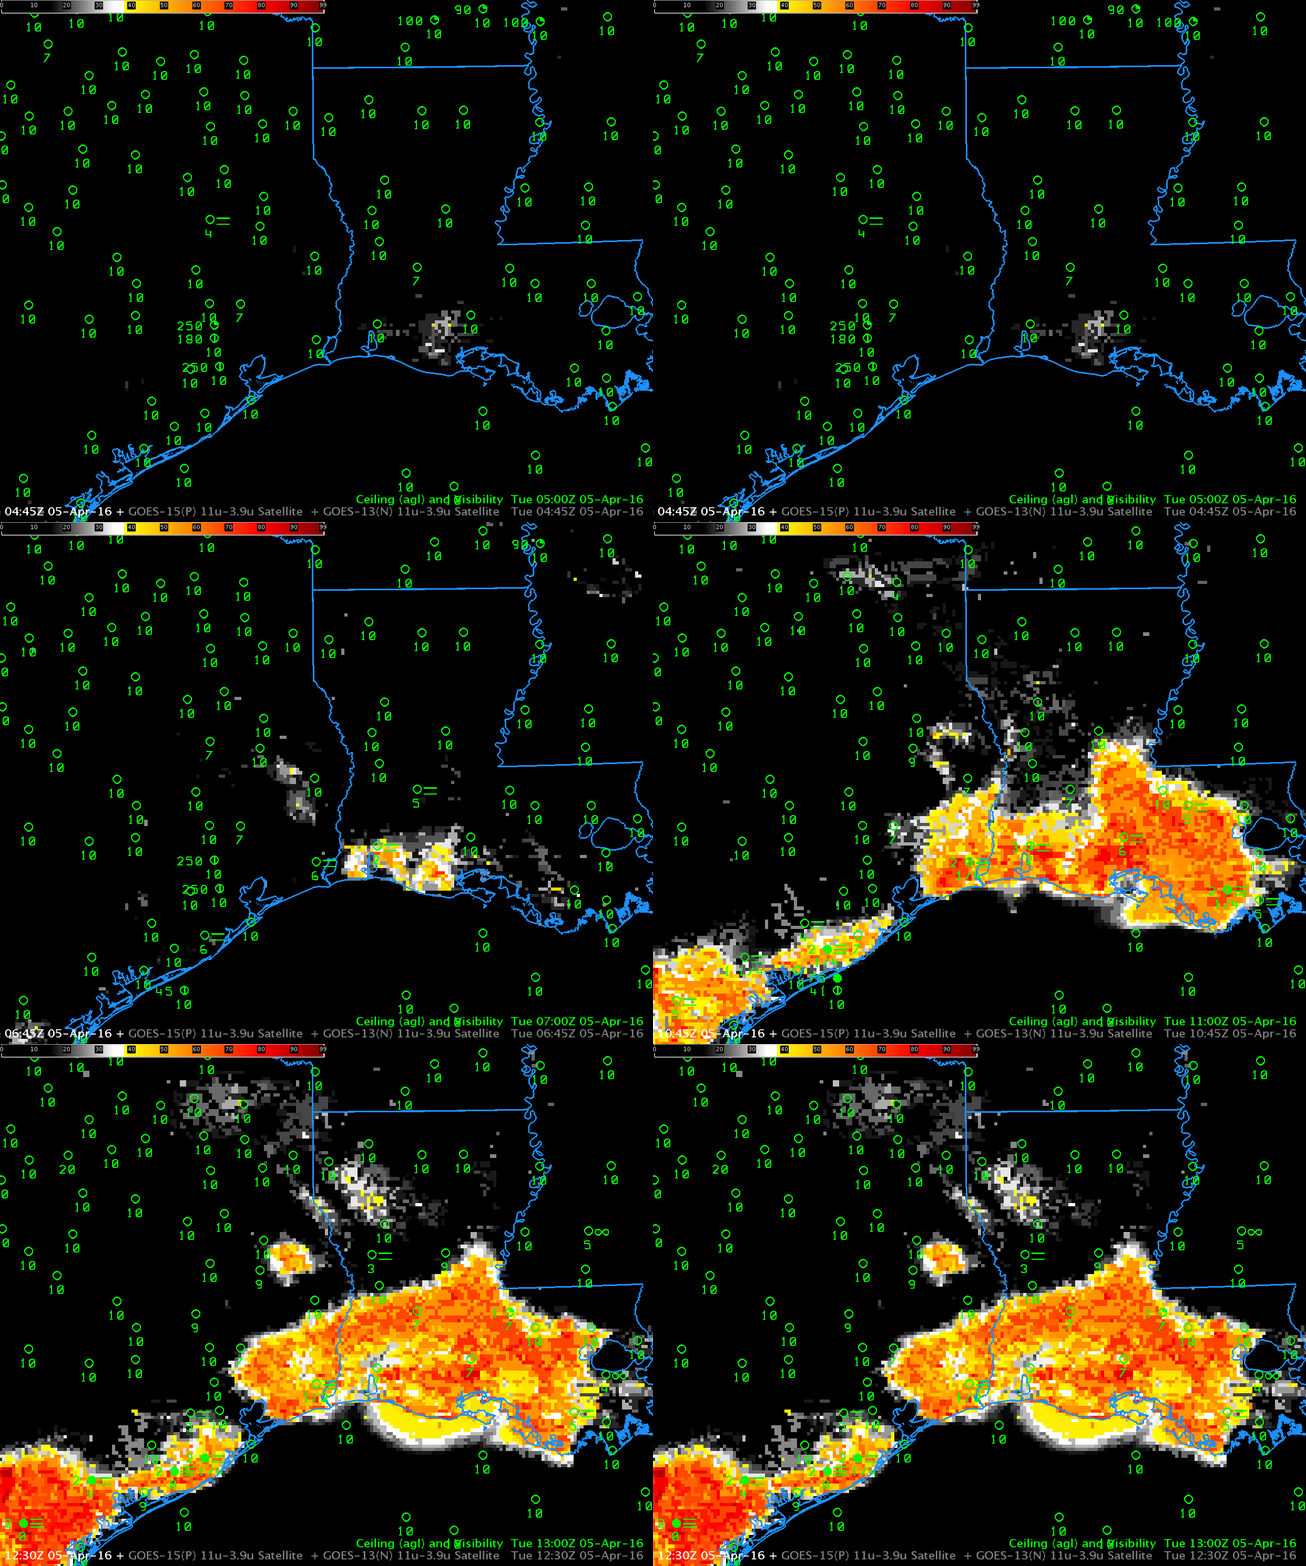
In contrast, the GOES-R IFR Probability field, below, diagnoses an initially isolated region of enhanced IFR probabilities near stations that are reporting reduced ceilings/visibilities.  The enhanced IFR Probabilities develop over southwestern Louisiana and expand outward from there (a second region develops south of Houston TX).  Regions where IFR conditions do not develop have very low IFR Probabilities that persist with time.

GOESIFR_0445_1230anim_05Apr2016

GOES-R IFR Probability Fields, every 2 hours from 0445 to 1230 UTC, 5 April 2016 (Click to enlarge)

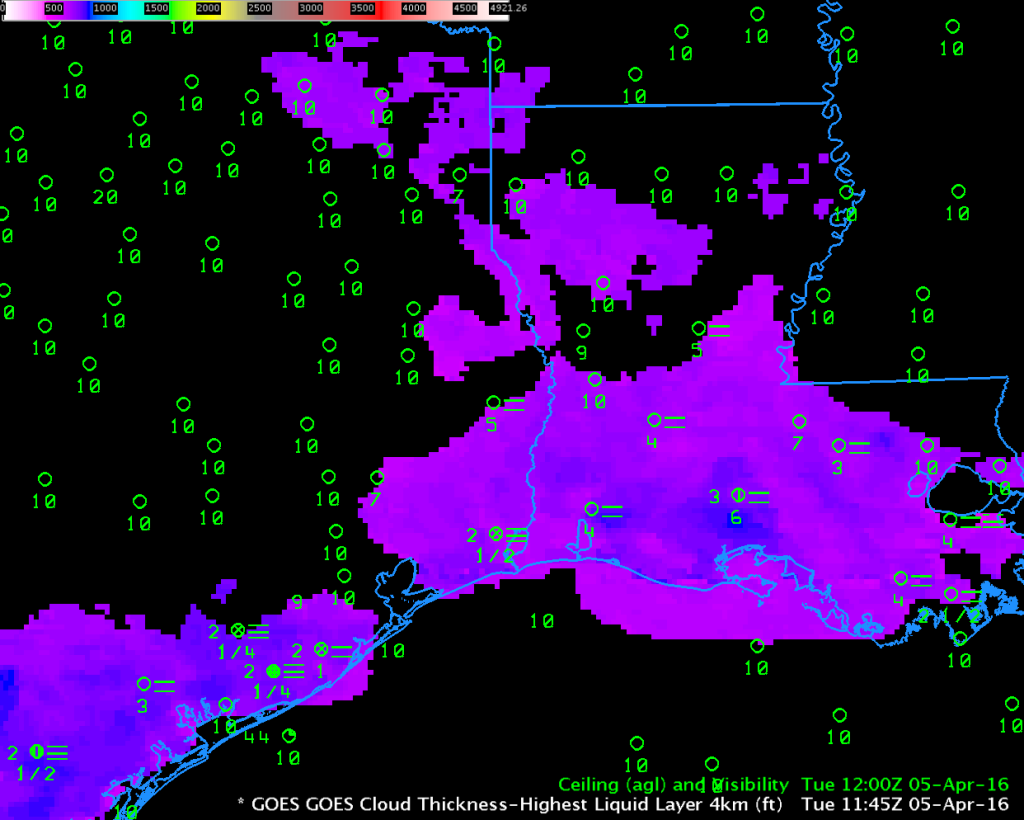
GOES-R Cloud Thickness relates 3.9 µm emissivity to cloud thickness based on historical relationships between that value and sodar observations off the west coast of the USA. The value is not computed during twilight conditions on either side of sunrise and sunset, but  the last observation taken before sunrise, shown below, is related to dissipation time according to this scatterplot. Cloud Thickness on the morning of 5 April 2016 was at most 830 feet, suggesting rapid dissipation after sunrise. This is what occurred.

GOESCLDTH_1145_05Apr2016

GOES-R Cloud Thickness, 1145 UTC on 5 April 2016 (Click to enlarge)

GOES-R IFR Probability screens out mid-level stratus

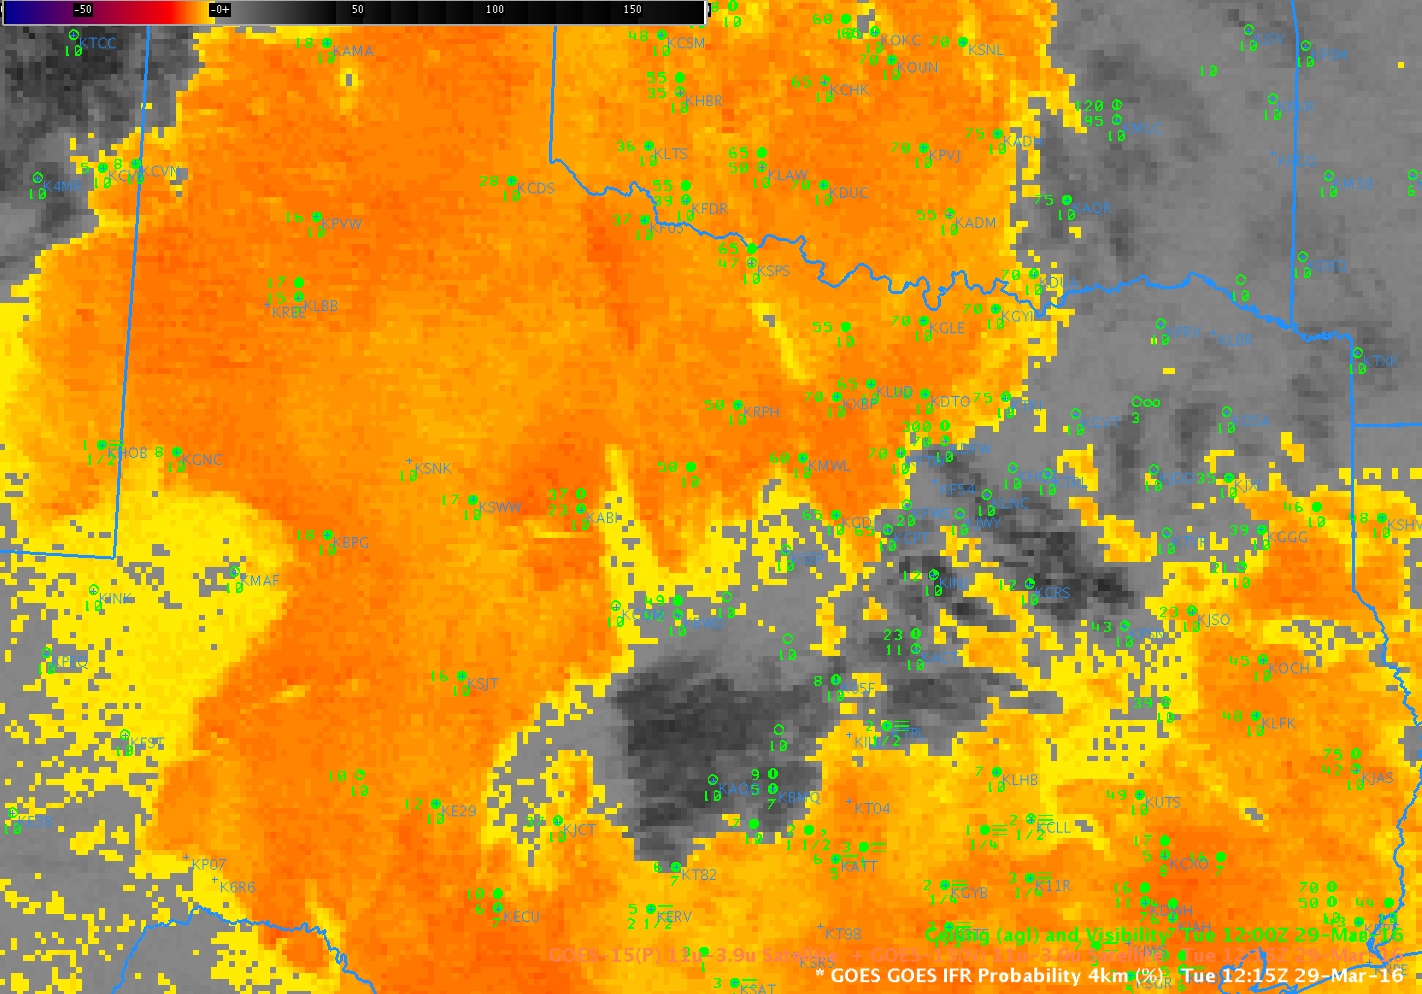
BTD_1215_29March2016

GOES-13 Brightness Temperature Difference (10.7 µm – 3.9 µm) at 1215 UTC on 29 March 2016 (Click to enlarge)

Consider the brightness temperature difference field above, from 1215 UTC on 29 March 2016. A strong signal that indicates water-based clouds extends from central Oklahoma to west Texas, and also from south Texas to west Texas. Are these water-based clouds obscuring visibilities at the surface? Over much of the region they are not. The Brightness Temperature Difference field gives information about the top of the cloud, but not the cloud base.

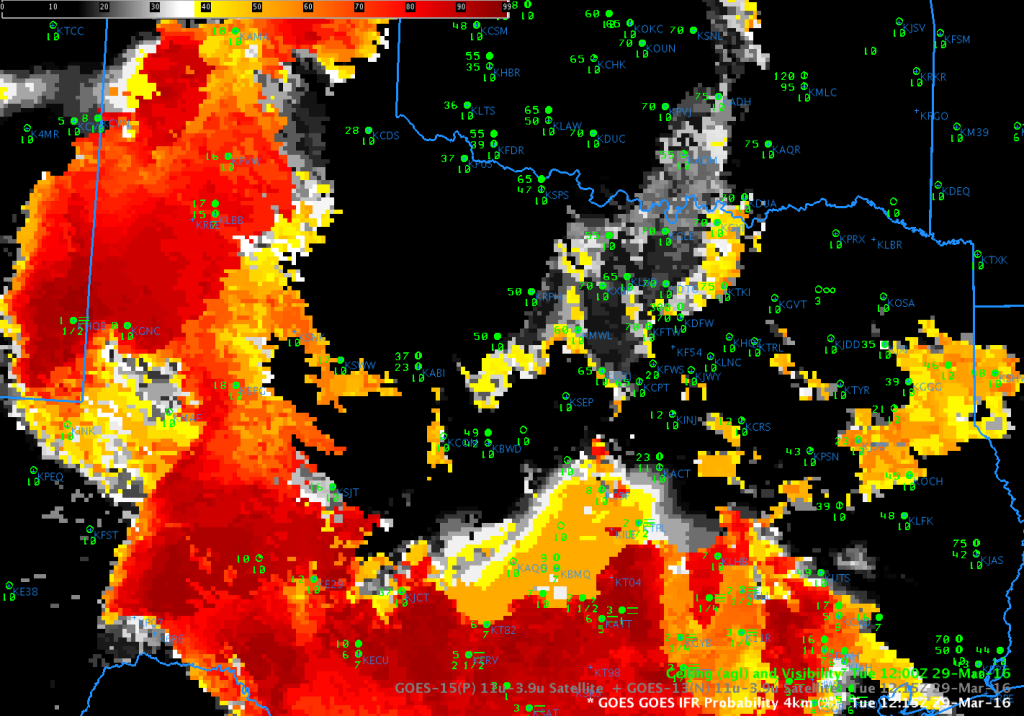
The GOES-R IFR Probability field for the same time, below, has screened out much of the region of mid-level stratus over Oklahoma and Texas. This can occur because IFR Probability fields include information from the Rapid Refresh Model. If that model does not indicated low-level saturation, IFR Probabilities will not be large. In the example shown, large values of IFR Probabilities are restricted to regions where IFR or near-IFR conditions are occurring.

IFRP_1215_29March2016

GOES-R IFR Probability Fields at 1215 UTC on 29 March 2016 (Click to enlarge)

Coastal Stratus/Fog along the East Coast

GOES_IFRP_0215_1400anim_17March2016

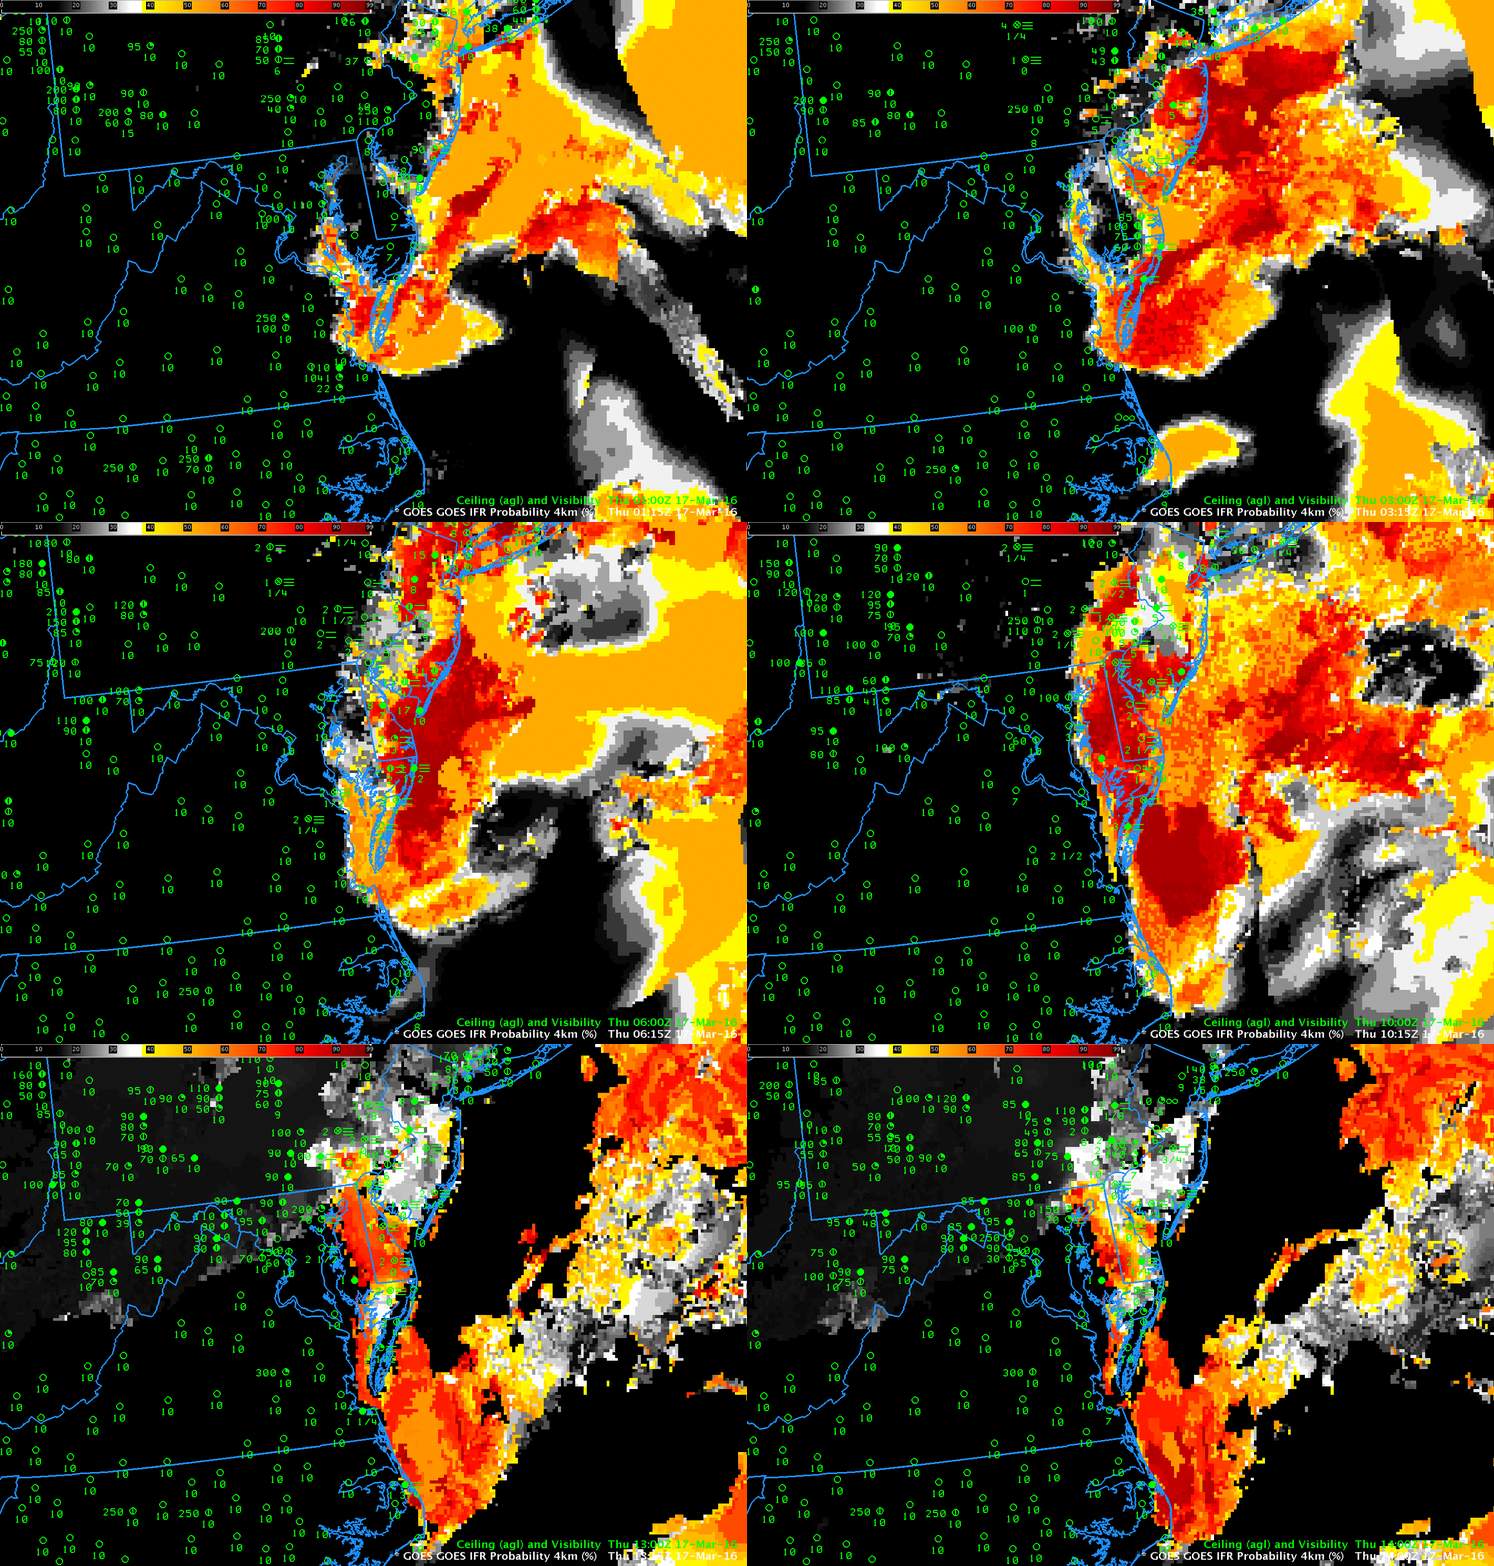
GOES-R IFR Probabilities, Hourly from 0215-1415 UTC 17 March 2016 (Click to enlarge)

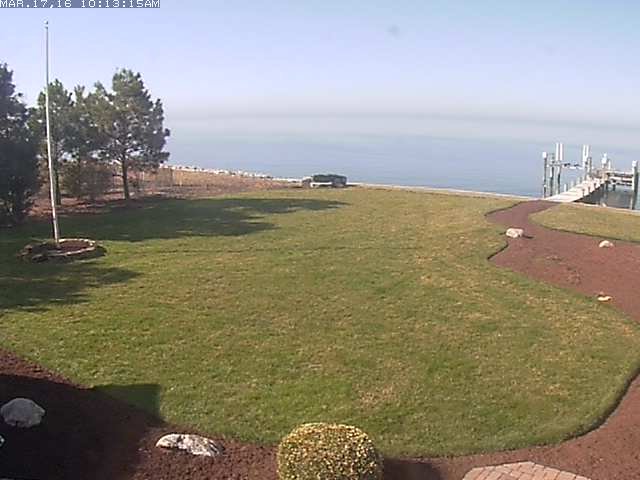
GOES-R IFR Probabilities captured the development of coastal fog over coast of the Atlantic Ocean from Long Island south to North Carolina on the morning of March 17 2016 behind a weak cold front. IFR Conditions penetrated into the Delaware and Lehigh River Valleys over Pennsylvania. In general, GOES-R IFR Probability fields captured the region of IFR conditions as it developed and expanded. Note that the IFR Probabilities remained elevated through 1400 UTC along the eastern shore of Chesapeake Bay. The 1413 UTC webcam image from Tilghman Island, below, (source), shows an offshore fogbank.

TilghmanMDViewOverBay

Widespread IFR conditions over the Upper Midwest

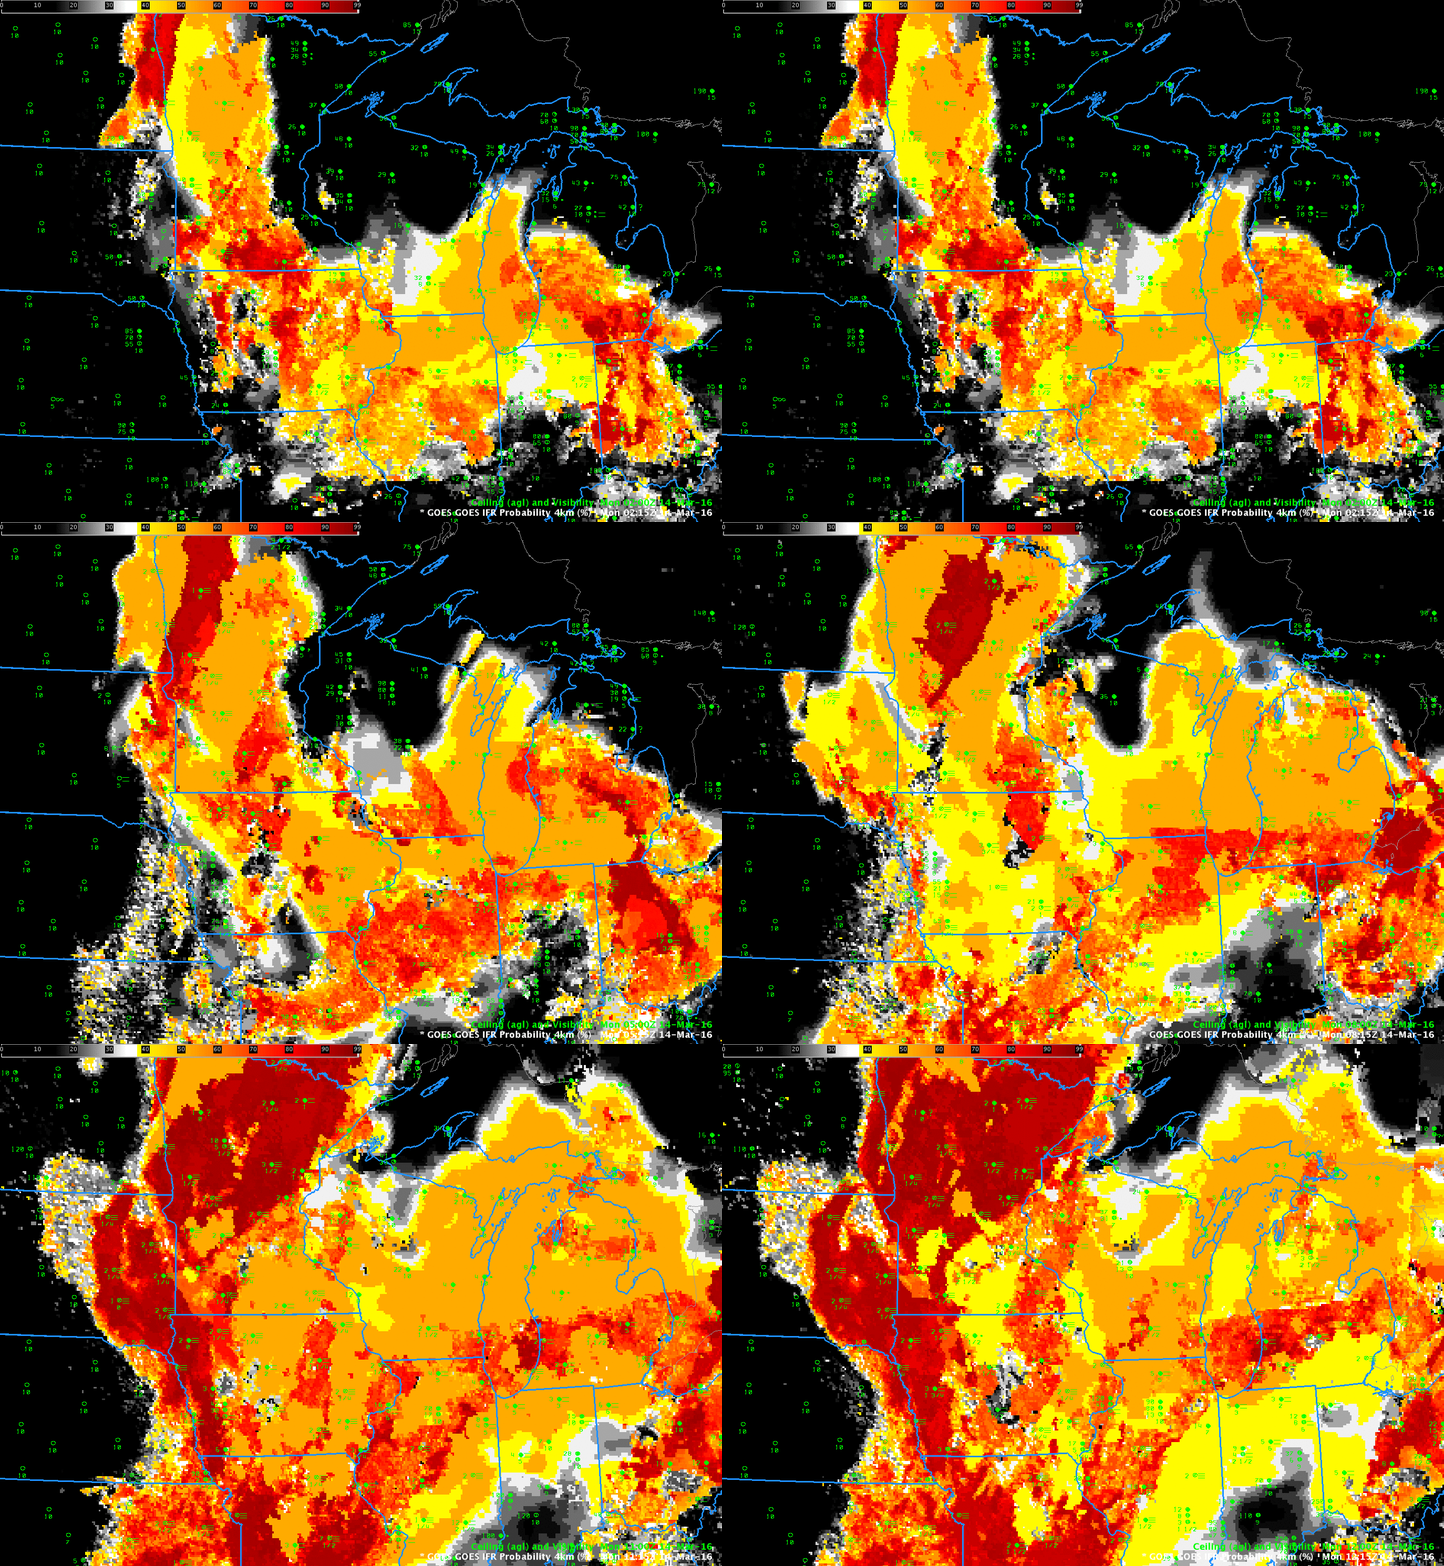
GOESR_IFRP_0215_1215stepanim

GOES-R IFR Probability Fields, hourly from 0215-1215, 14 March 2016 (Click to enlarge)

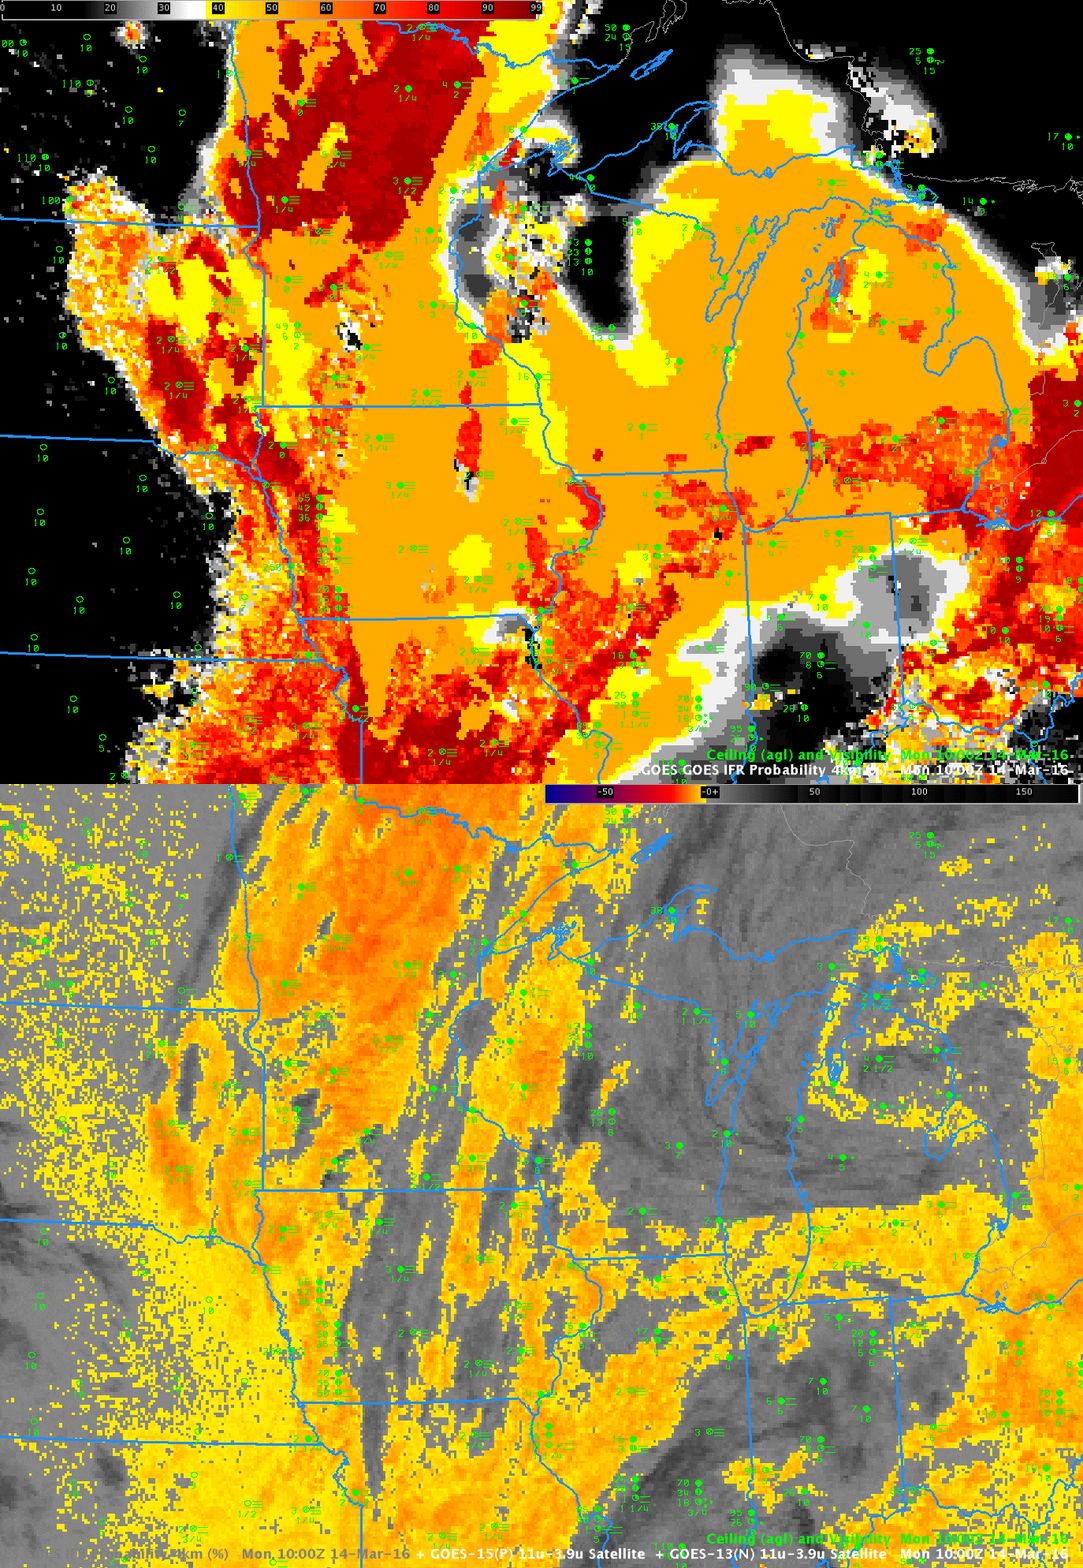
A rain-dampened boundary layer allowed fog to form over much of the upper midwest on early Monday March 14 2016 (as a baggy low pressure system moved eastward). GOES-R IFR Probability fields, above, captured the slow expansion of the region of IFR conditions.  The character of the IFR Probability Field varies from smooth (over northern Illinois at 0215 UTC, for example (link)) to pixelated (over southern Minnesota at the same time).  This is related to whether the model only is used as a predictor (over northern Illinois) because of high clouds that prevent the satellite from viewing low clouds or whether model and satellite data are both used as predictors (over southern Minnesota).  The toggle below, of IFR Probability Fields and Brightness Temperature Difference fields at 1000 UTC on 14 March, underscores this relationship between IFR Probability and Brightness Temperature Difference fields.

In the animation above, IFR conditions are in general observed where IFR Probability fields suggest their presence.

GOES_IFR_BTD_14March2016_1000ztoggle

GOES-R IFR Probability and GOES-13 Brightness Temperature Difference Field, 1000 UTC on 14 March 2016 (Click to enlarge)

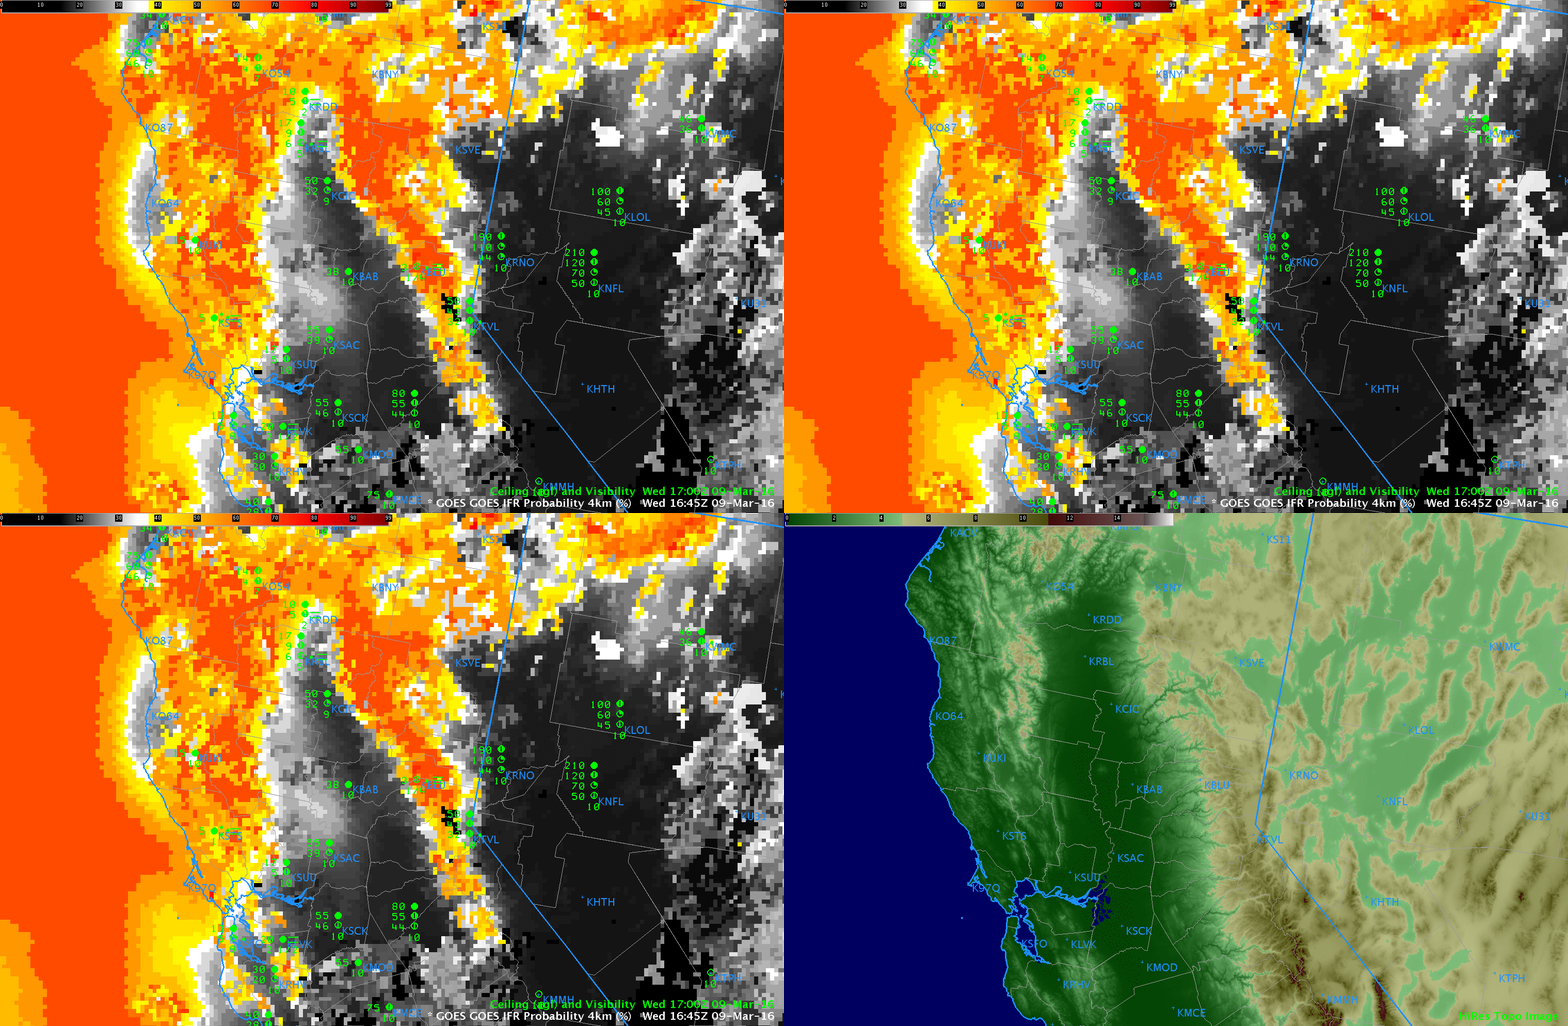
IFR Probability and Topography

GOES_IFR_15z_9March_Topo.toggle

It is not unusual for land to ascend into the clouds in regions where Moutains abut large valleys or gently sloping plains.  This is especially apparent in California on either side of the Central Valley.  The toggle above shows IFR Probability fields at 1645 UTC on 9 March, and a high-resolution topographic image.  High IFR Probabilities are well correlated with high terrain. This is something a user must consider when using the product.

Fog over ArkLaTex

IFRP-02

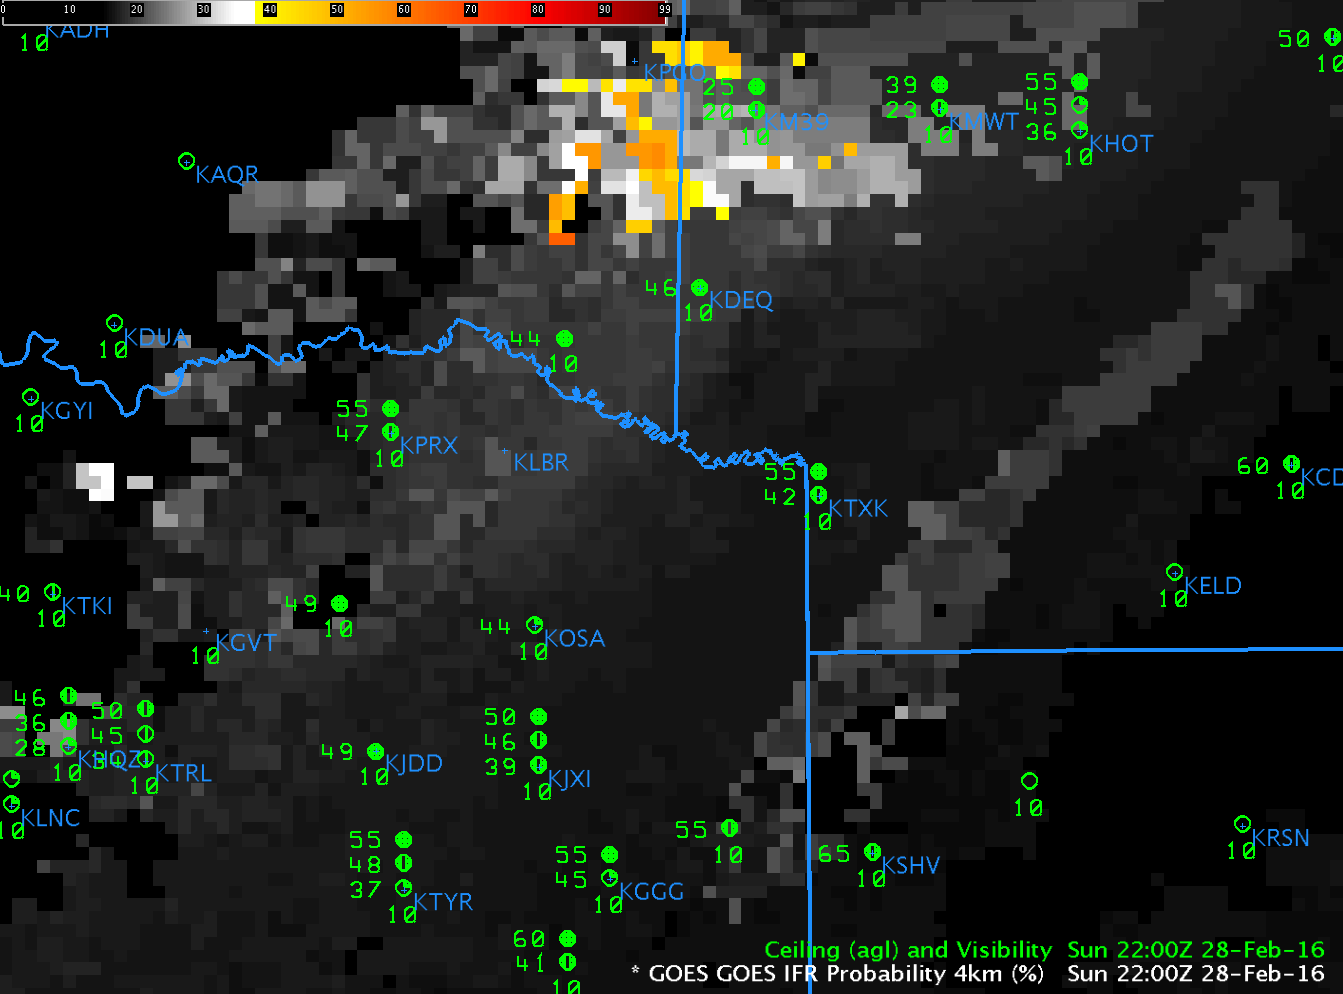
GOES-R IFR Probabilities, 2200 UTC on 28 February 2016 as well as surface observations of ceilings and visibilities (click to enlarge)

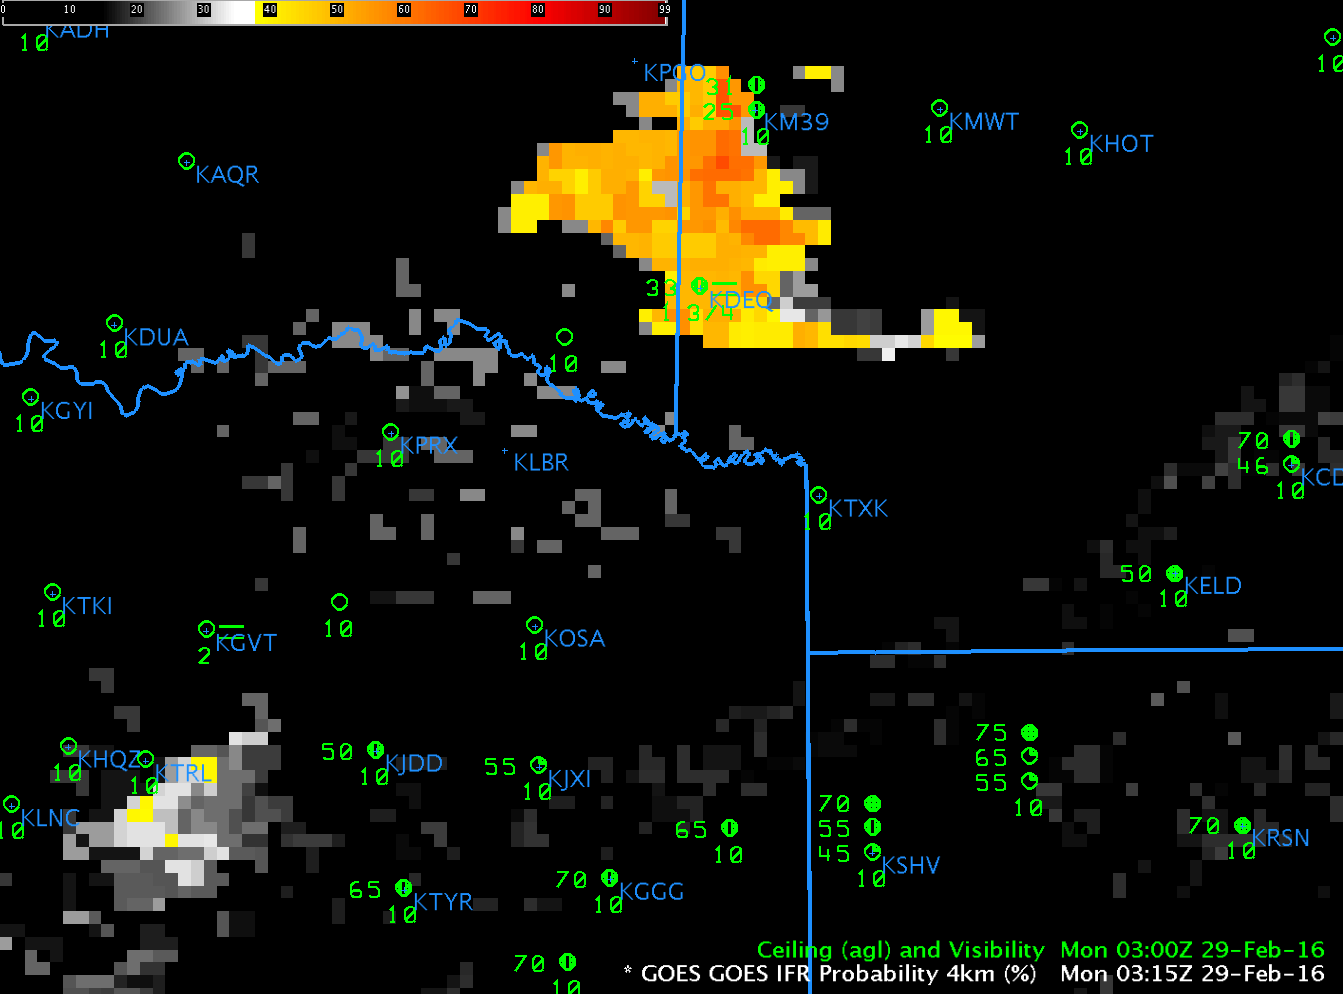
Late in the day on 28 February, as shown above, GOES-R IFR Probability fields included a small region of enhancement over west-central Arkansas and east-central Oklahoma. In this case, that field heralded the development of more widespread IFR conditions over northeast Texas (and surroundings). By 0300 on 29 February, below, IFR probailities in the region over east-central Oklahoma/west-central Arkansas had increased, and there is a suggestion of increasing IFR Probabilities over northeast Texas as well.  This is a case where IFR Probabilities can alert a forecaster to pay attention to a region long before a hazard develops.

IFRP-19

GOES-R IFR Probabilities, 0315 UTC on 29 February 2016 as well as surface observations of ceilings and visibilities (click to enlarge)

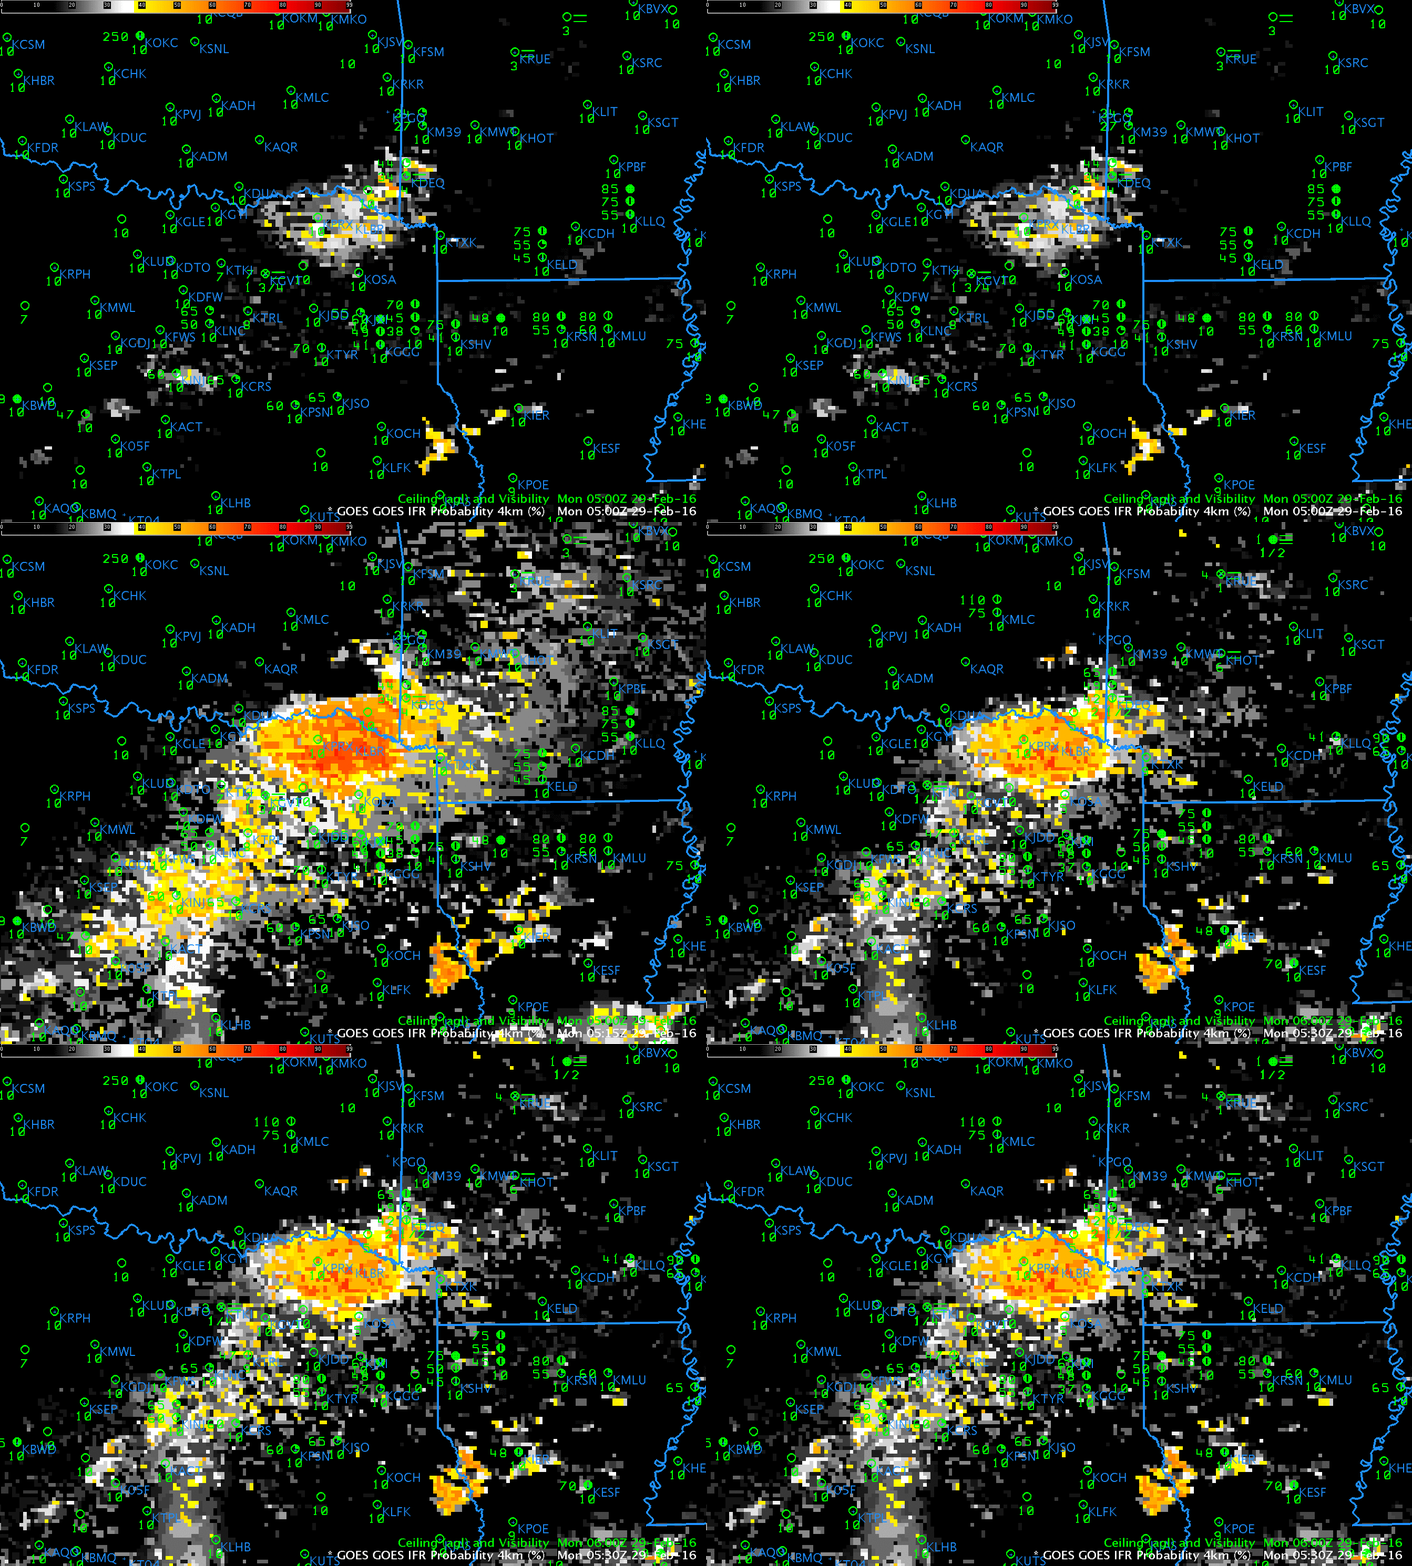
Late February starts the time when GOES-13 is near enough to eclipse season that stray light can creep into imagery. In this case, a large signal increase between 0500 and 0515, below, is in part related to stray light, and in part to low cloud development. By 0530, IFR Probability fields show less affect from stray light. (Click here for an animation of brightness temperature difference fields alone; Stray Light has an obvious impact at 0515 UTC).

IFR_P_0500_0530_29feb2106anim

GOES-R IFR Probability fields, 0500-0530 UTC, 29 February 2016, showing Stray Light Effects (Click to enlarge)

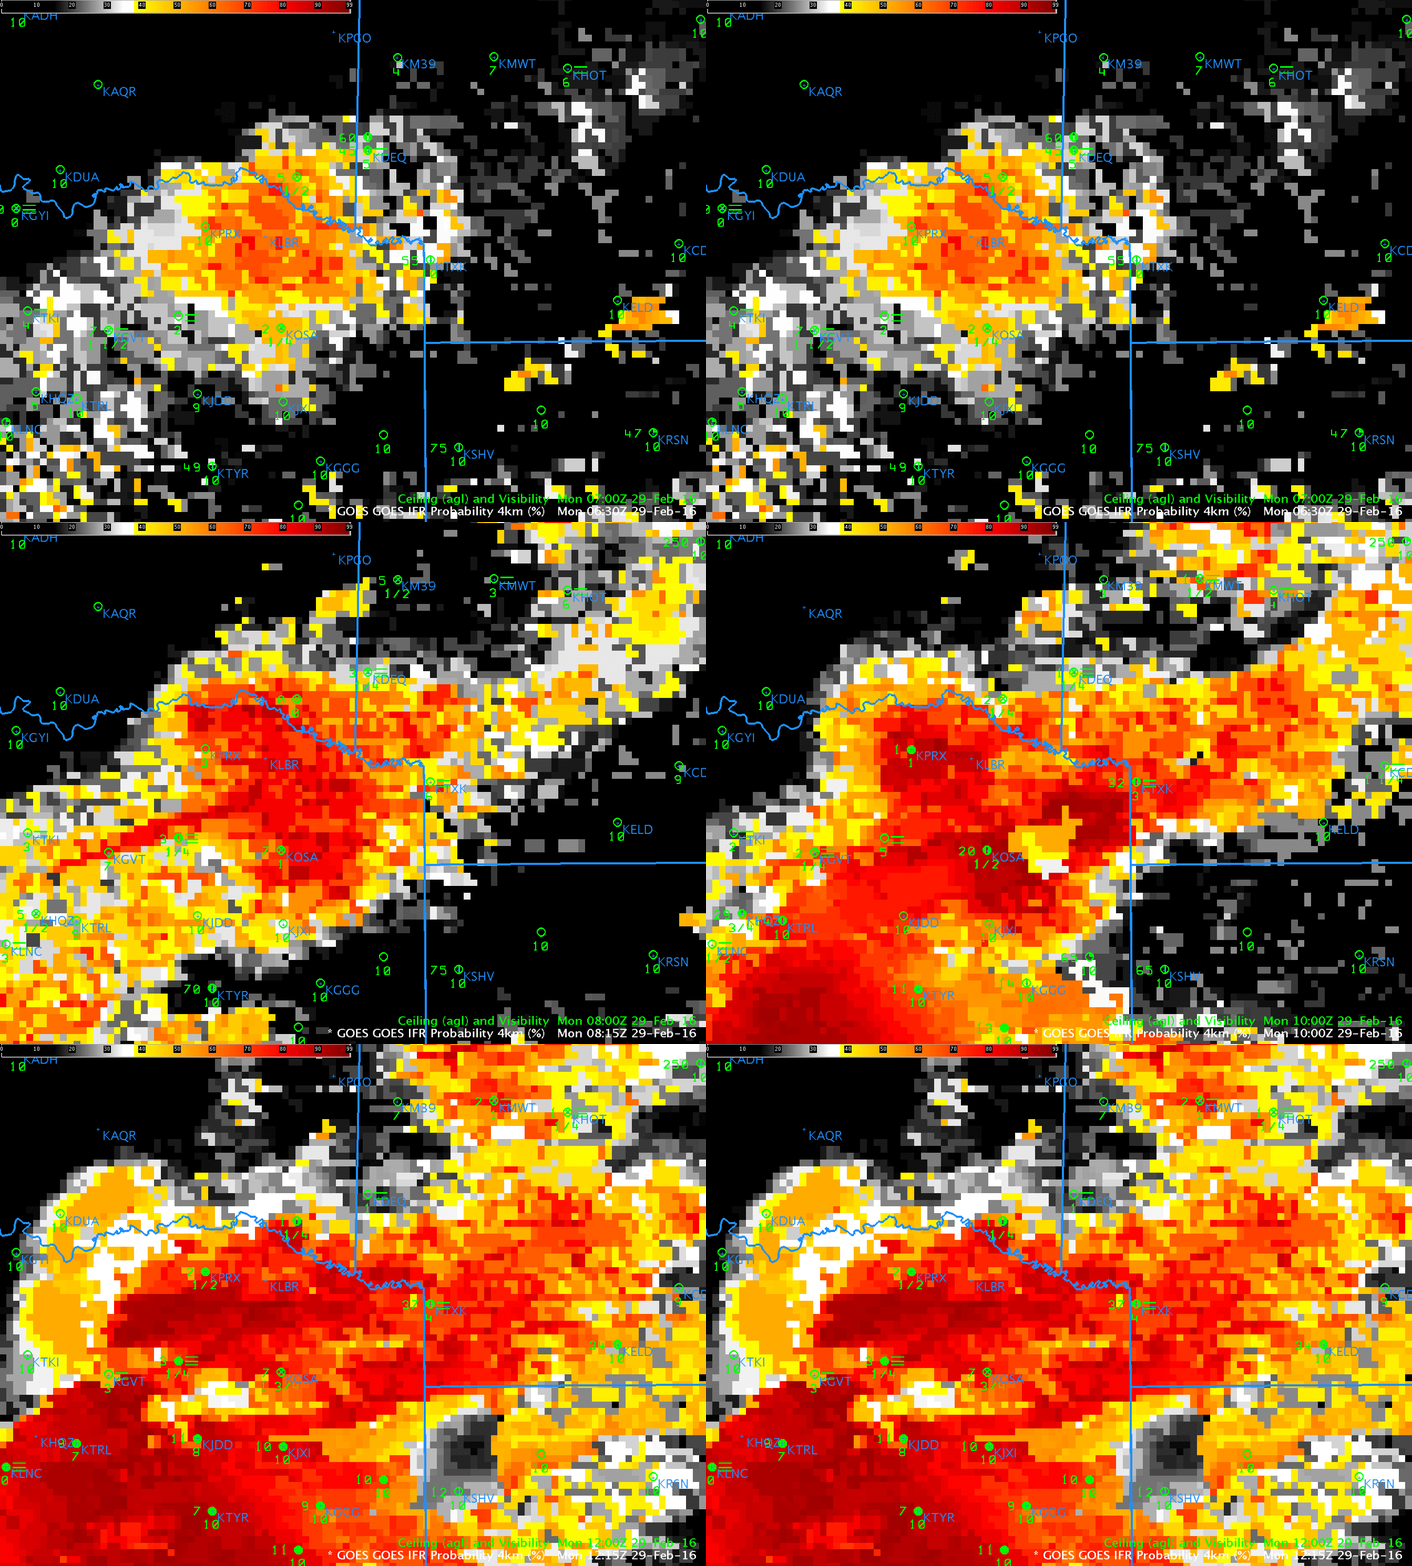
IFR Probability fields from 0615 through 1215 UTC are shown below. Very high IFR Probabilities (and IFR conditions) were widespread in the early morning over northeast Texas and surrounding states.

IFRPanim_0615_1215_29February

GOES-R IFR Probabilities fields, hourly from 0615-1215 UTC, and surface reports of ceilings and observations (Click to enlarge)

Nebraska Fog

IFRP-0415_1515anim_22feb2016

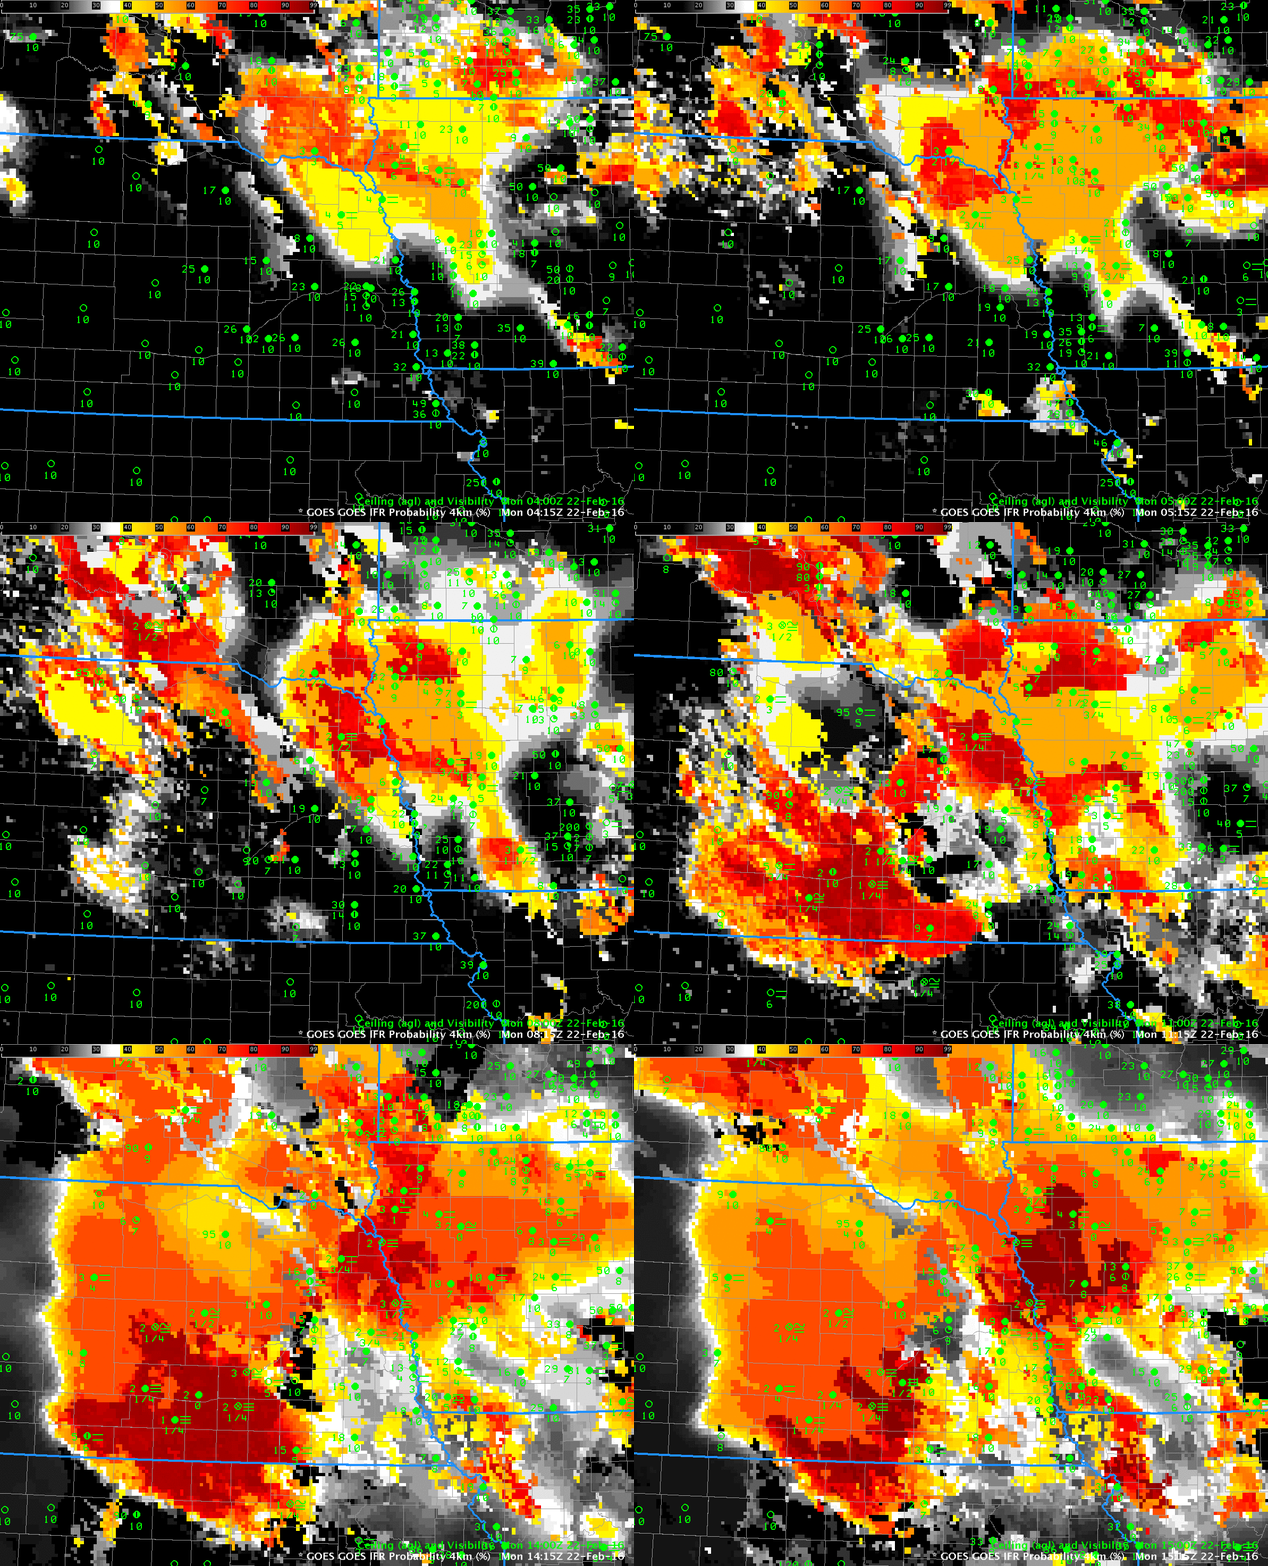
GOES-R IFR Probability fields, hourly from 0415 to 1515 UTC on 22 February, along with surface observations of ceilings and visibilities (Click to enlarge)

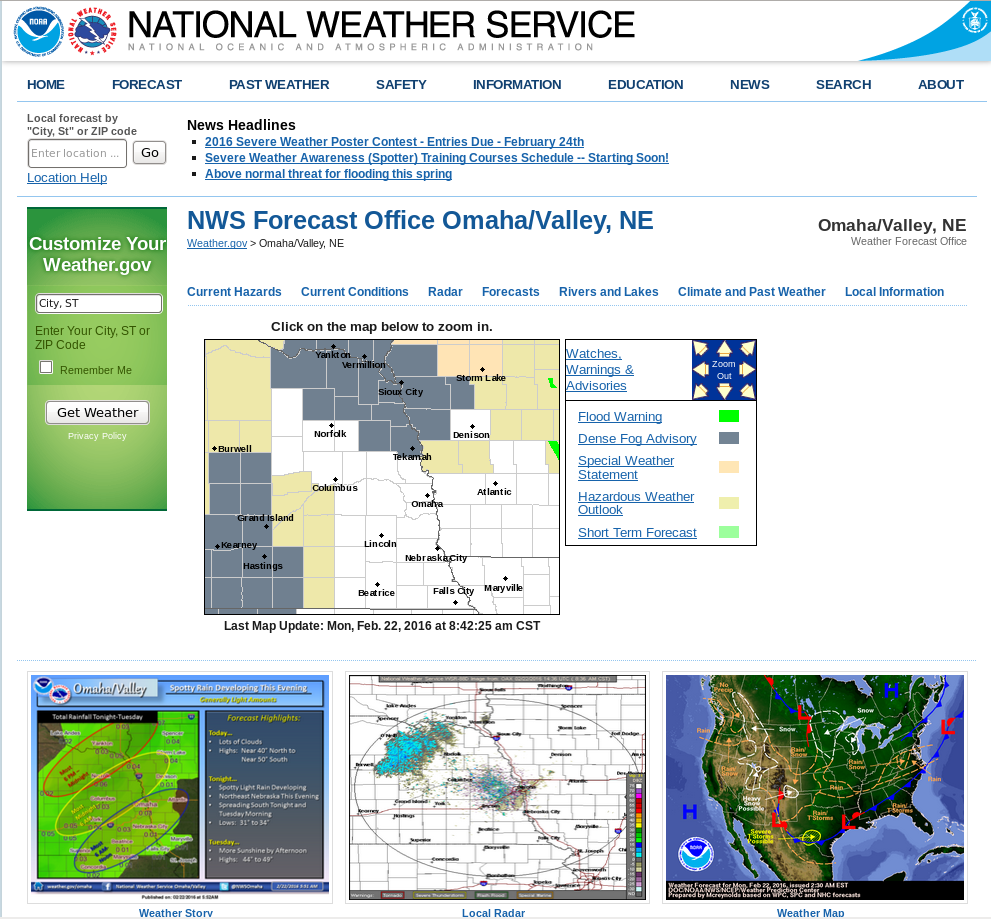
Dense Fog developed in two regions over Nebraska overnight, as shown in the screen capture below (from 1445 UTC) showing Dense Fog Advisories. GOES-R IFR Probabilities discerned the differences between the two regions, as shown in the animation above. The fog feature near the Missouri River (the boundary between Iowa and Nebraska) developed first in a region where high clouds were also present. That high clouds are present is apparent from the flat nature (that is, not pixelated) of the IFR Probability field at, say, 0415 and 0515 over western Iowa. The second region of fog, over south-central Nebraska, develops under clear skies as evidences by the (initially) very pixelated field. Towards the end of the animation high clouds overspread that region also. When that happens, IFR Probability values drop (because only model predictors can be used in the computation of IFR Probability in regions where high clouds exist). At the end of the animation, largest IFR Probabilities overlap the two regions where Dense Fog Advisories were issued. The region in between the advisories has lower Probabilities.

NWSFronPage

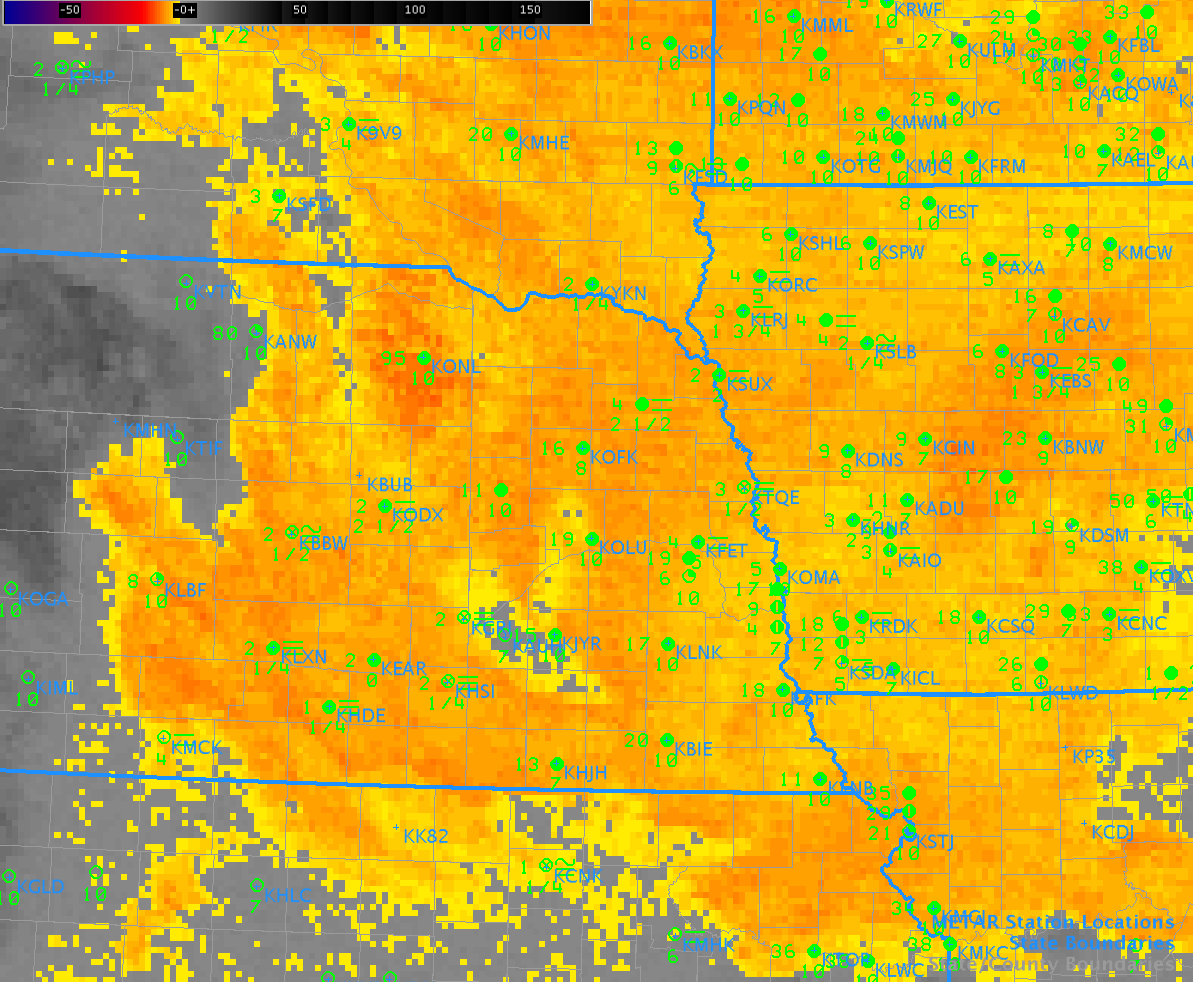
Compare the IFR Probability field, above, to Brightness Temperature Difference, below. Brightness Temperature Difference fields identify regions of Fog and Stratus, but near-surface information cannot be extrapolated (consistently) from cloud-top information. Thus, many stations with ceilings and visibilities far better than IFR conditions are in regions where a strong Brightness Temperature Difference signal exists (for example, KONL in northeastern Nebraska), The incorporation of surface information via Rapid Refresh model predictions of near-surface saturation allows the IFR Probability fields to better outline regions of IFR conditions only.

BTD_1300UTC_22feb2016

GOES-13 Brightness Temperature Difference (10.7 µm – 3.9 µm), 1300 UTC on 22 February 2016 (click to enlarge)

Fog over the Tennessee River Valley

IFRP_0115_1315stepanim_17Feb2016

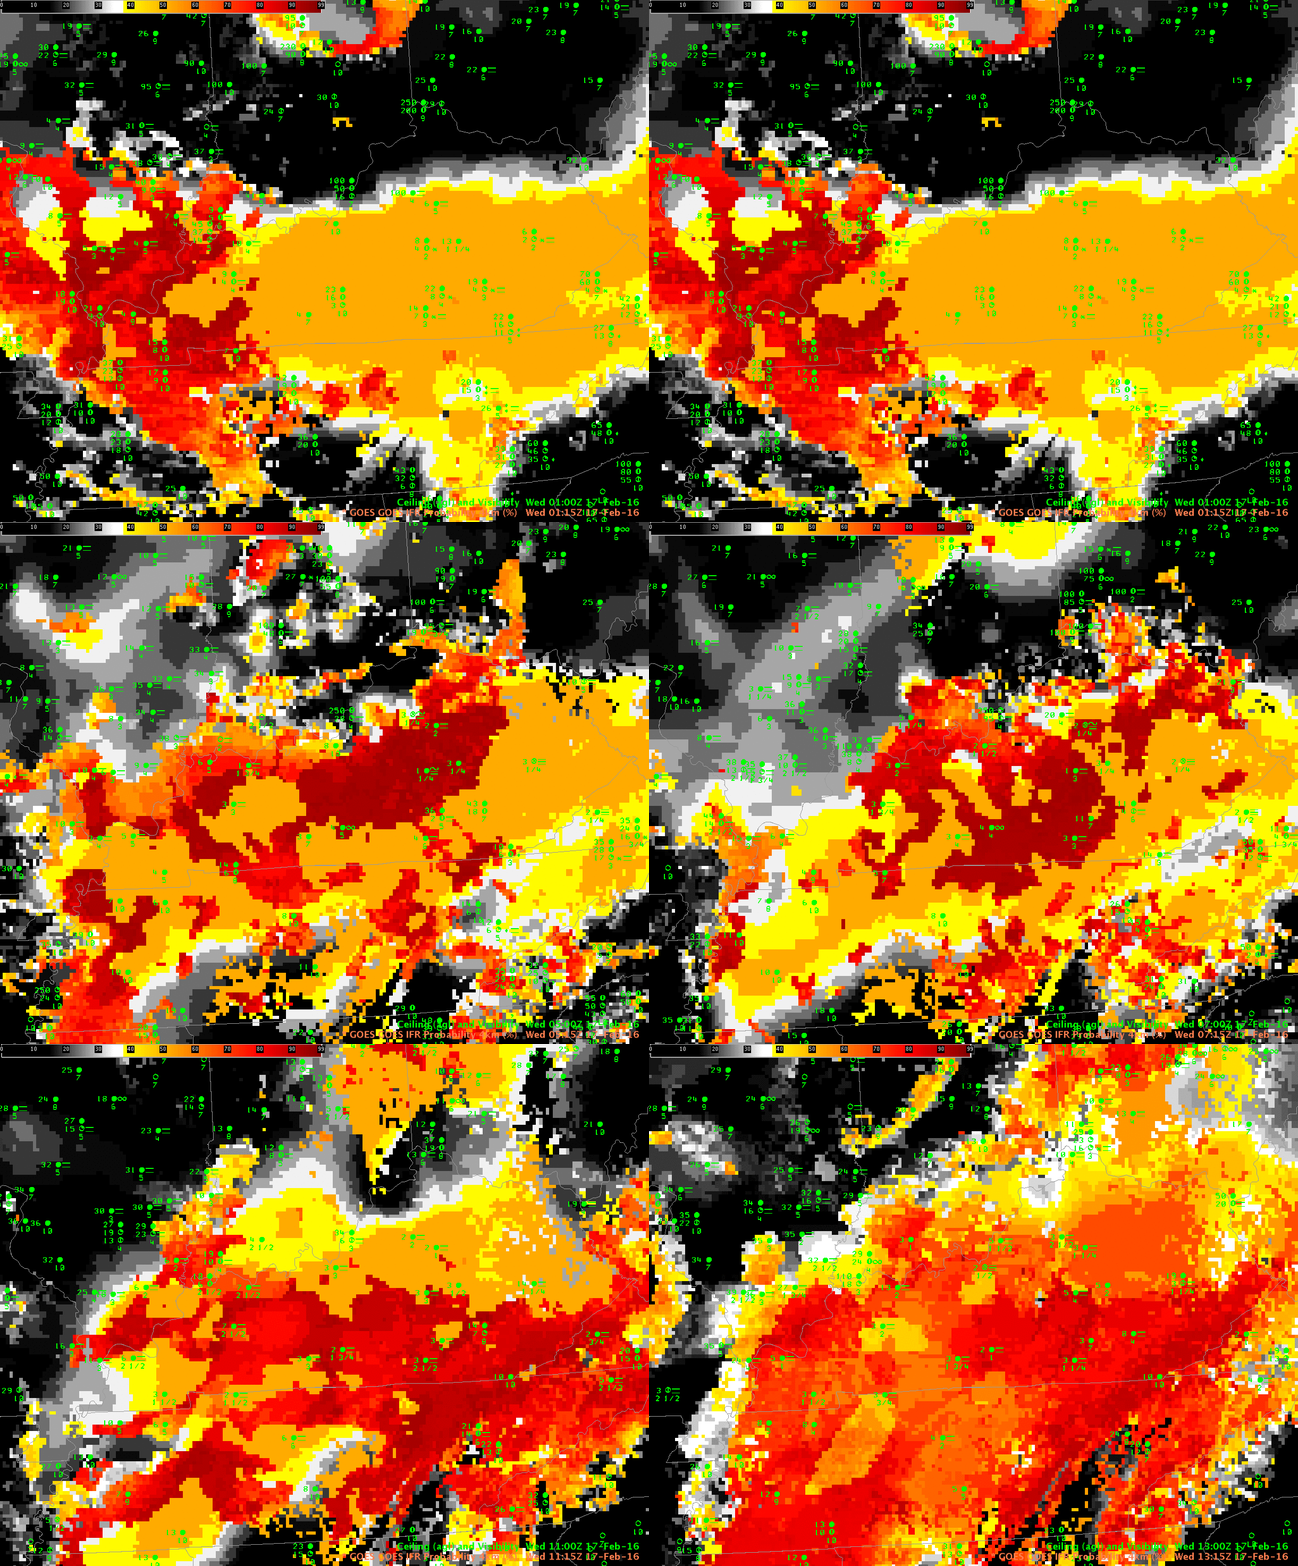
GOES-R IFR Probability fields, every two hours from 0115 through 1315 UTC on 17 February 2016 (Click to enlarge)

GOES-R IFR Probability fields showed large values over parts of Kentucky and Tennessee during the overnight hours on 16-17 February 2016, as shown in the animation above (every 2 hours from 0115 through 1315 UTC). (IFR or near-IFR Conditions were present over the region of enhanced IFR Probabilities) For much of the overnight hours, mid-level and high clouds prevented an unobstructed satellite view of low clouds, so Rapid Refresh model output was the principle driver in IFR Probabilities. When that happens, the character of the IFR Probability field is less pixelated (it’s a flatter field) and values are smaller. At the end of the animation — 1315 UTC — satellite observations of low clouds have improved and the GOES-R IFR Probability field is (1) more pixelated, as expected when satellite data are used and (2) showing higher values because Satellite Predictors can be used in the computation of IFR Probability.

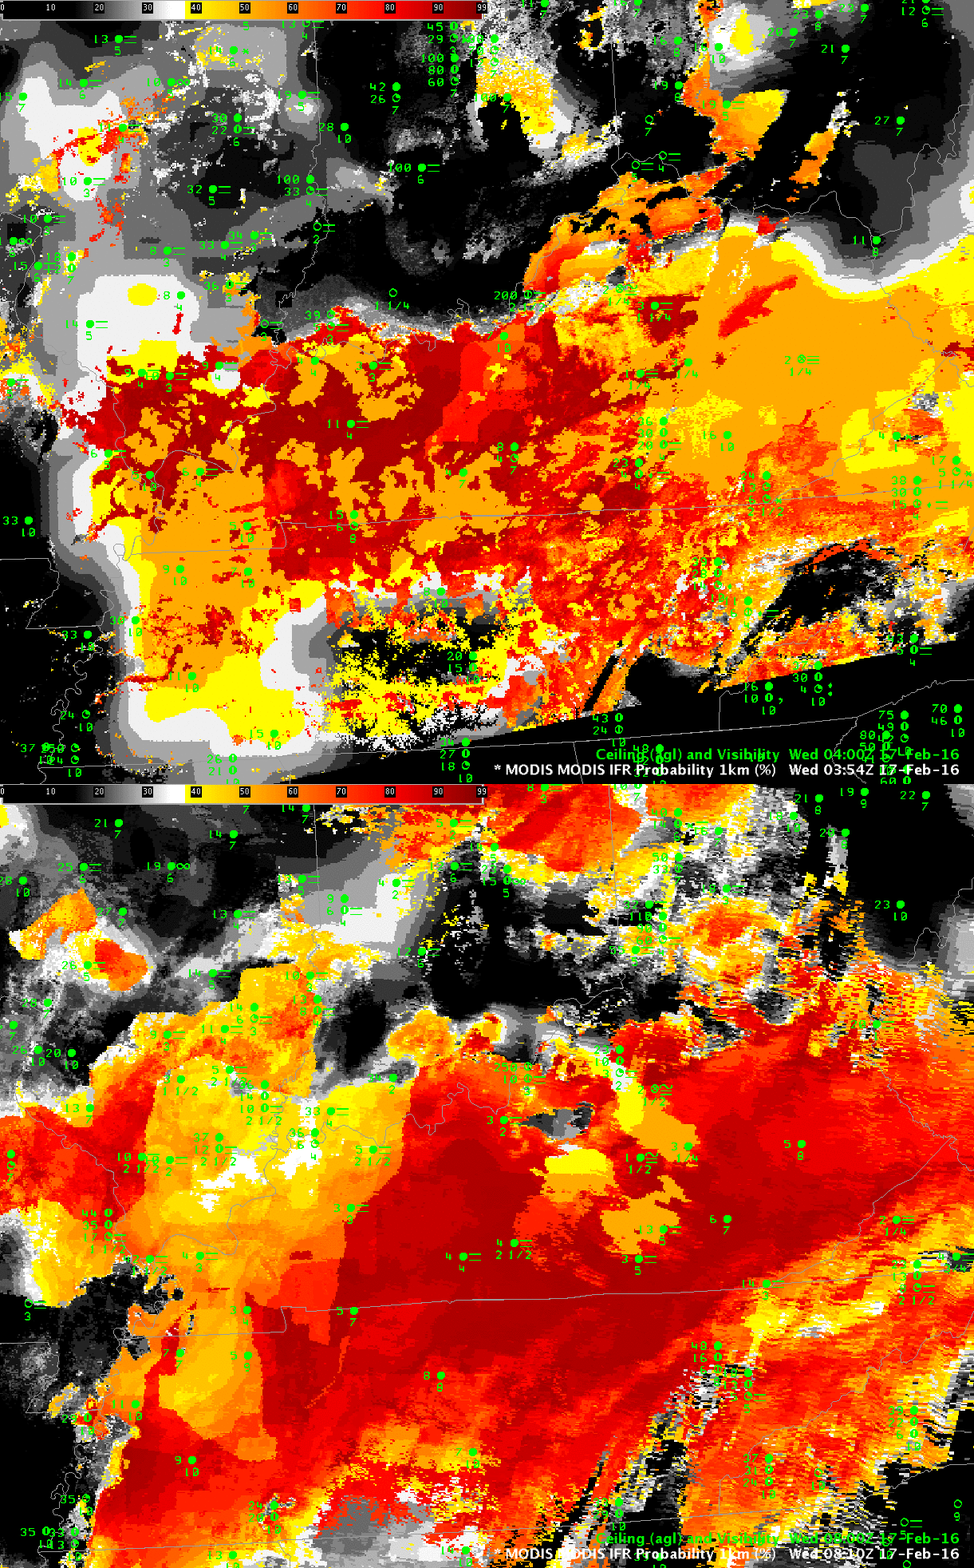
MODIS data from Terra and Aqua satellites can also be used to compute IFR Probability fields, and the high spatial resolution of the MODIS instrument (1-km vs. nominal 4-km on GOES) can yield superior results for valley fogs, for example (The effects of some rivers are apparent in the 0354 UTC image over western Tennessee, for example). For a large-scale event as above, however, GOES-based resolutions can be adequate. The toggle of MODIS-based GOES-R IFR Probabilities at 0354 UTC and 0810 UTC is shown below. Patchy clouds (that prevent MODIS from viewing low clouds) are more apparent in the 0354 UTC image than in the 0810 UTC image.

MODIS_IFRP_0354_0810UTC_17Feb2016toggle

MODIS-based GOES-R IFR Probabilities, 0354 and 0810 UTC on 17 February 2016 (Click to enlarge)

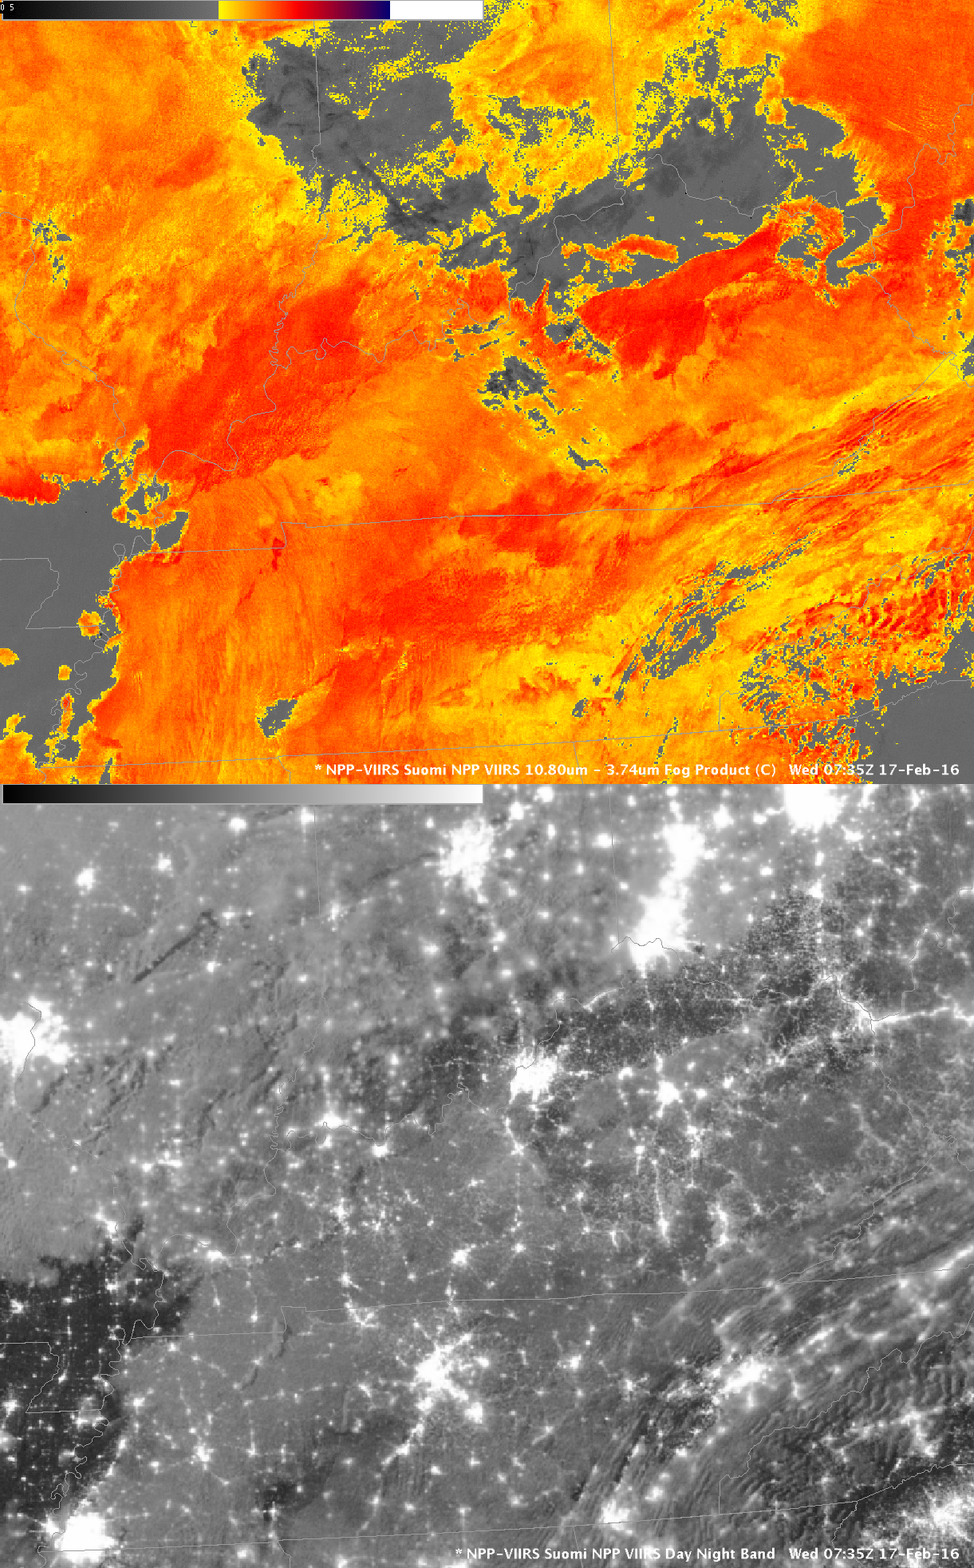
Suomi NPP Overflew the Tennessee River valley just after midnight local time, and the toggle of the Day Night band and the Brightness Temperature Difference field (11.45 – 3.74) is shown below. Extensive cloud cover is apparent. The importance of the IFR Probability fields is that it incorporates surface information (from the Rapid Refresh predictions of saturation in the lowest 1000 feet of the model atmosphere) so that fog and low stratus that impacts transportation by reducing visibilities can be distinguished from mid-level stratus that has a smaller impact.

SNPP_DNB_BTD_0735UTC_17Feb2016toggle

Suomi NPP Brightness Temperature Difference fields (10.8 µm – 3.74 µm) and Day Night band visible imagery (0.70 µm) at 0735 UTC on 17 Feburary 2016 (Click to enlarge)