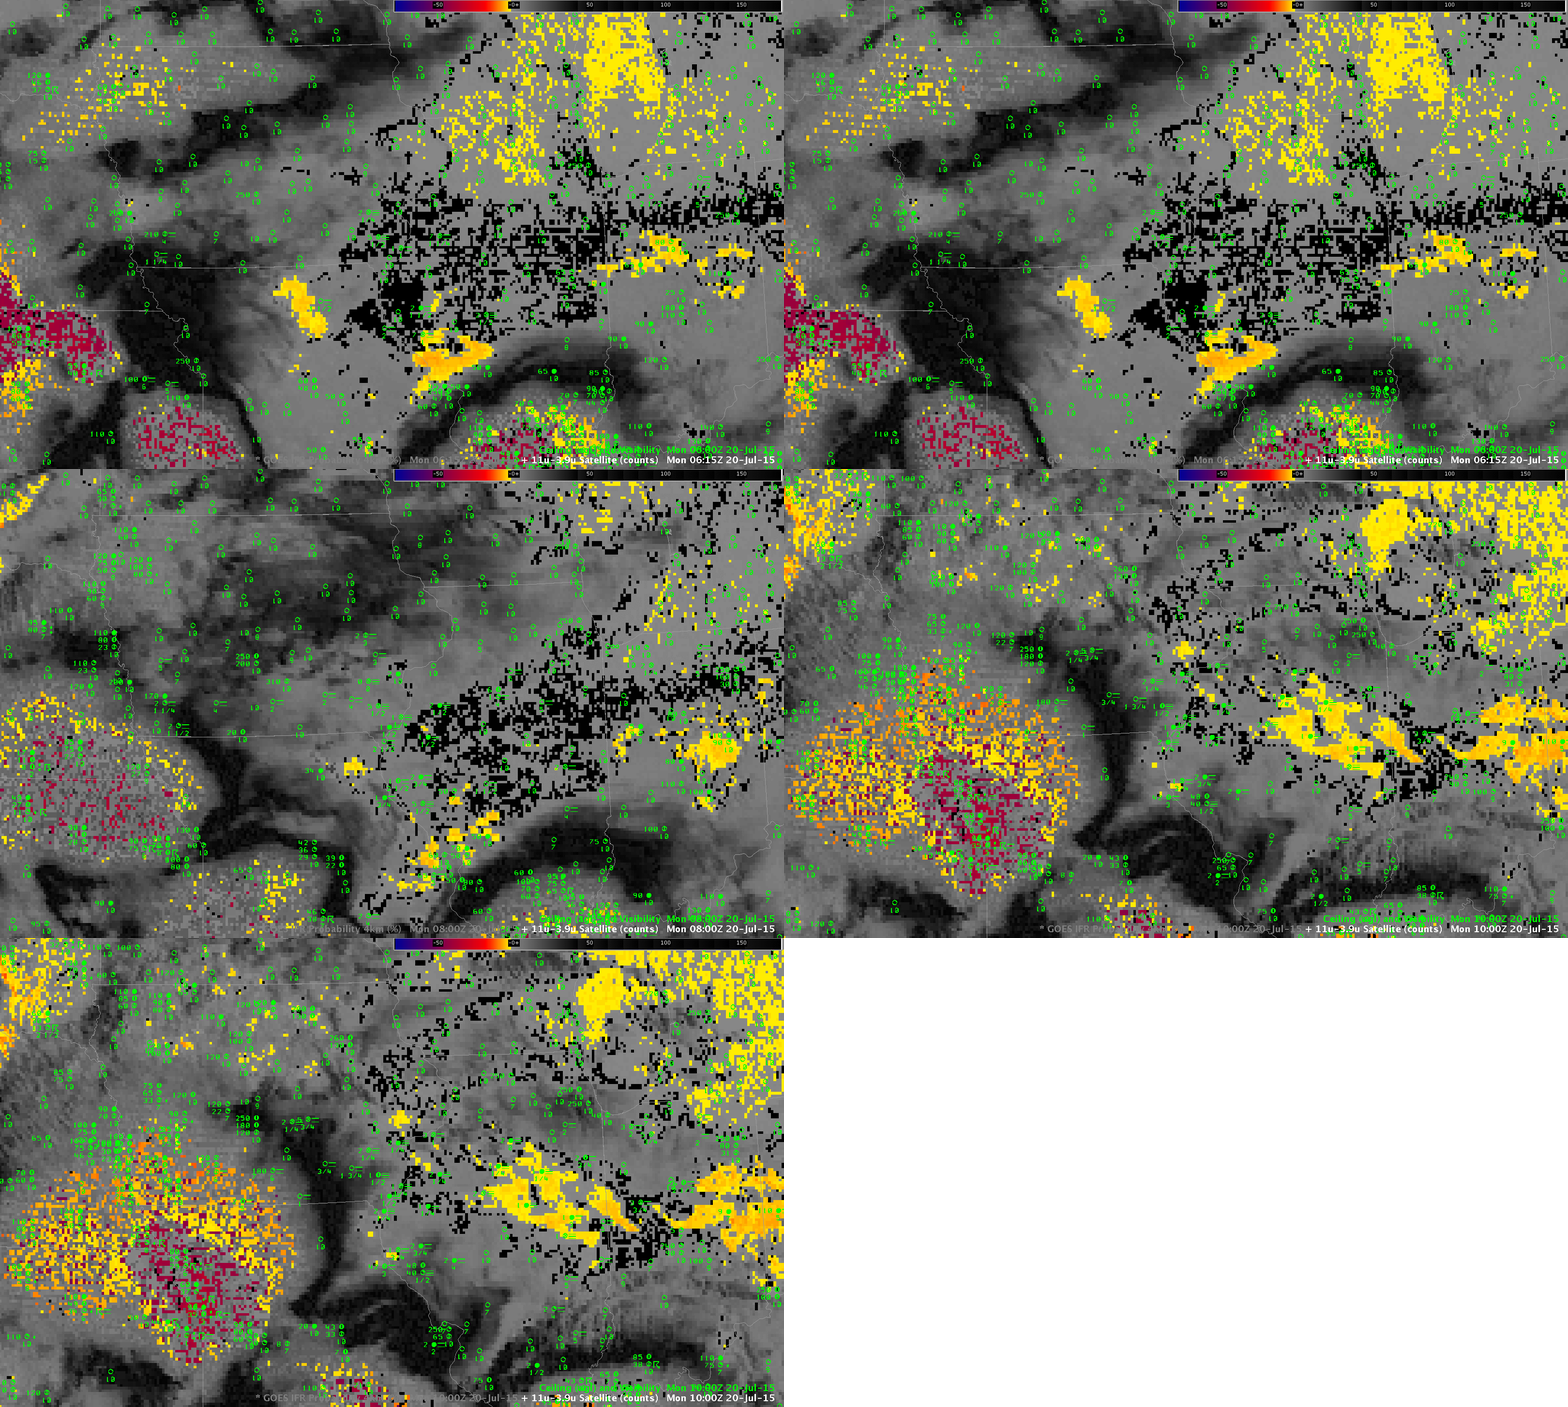
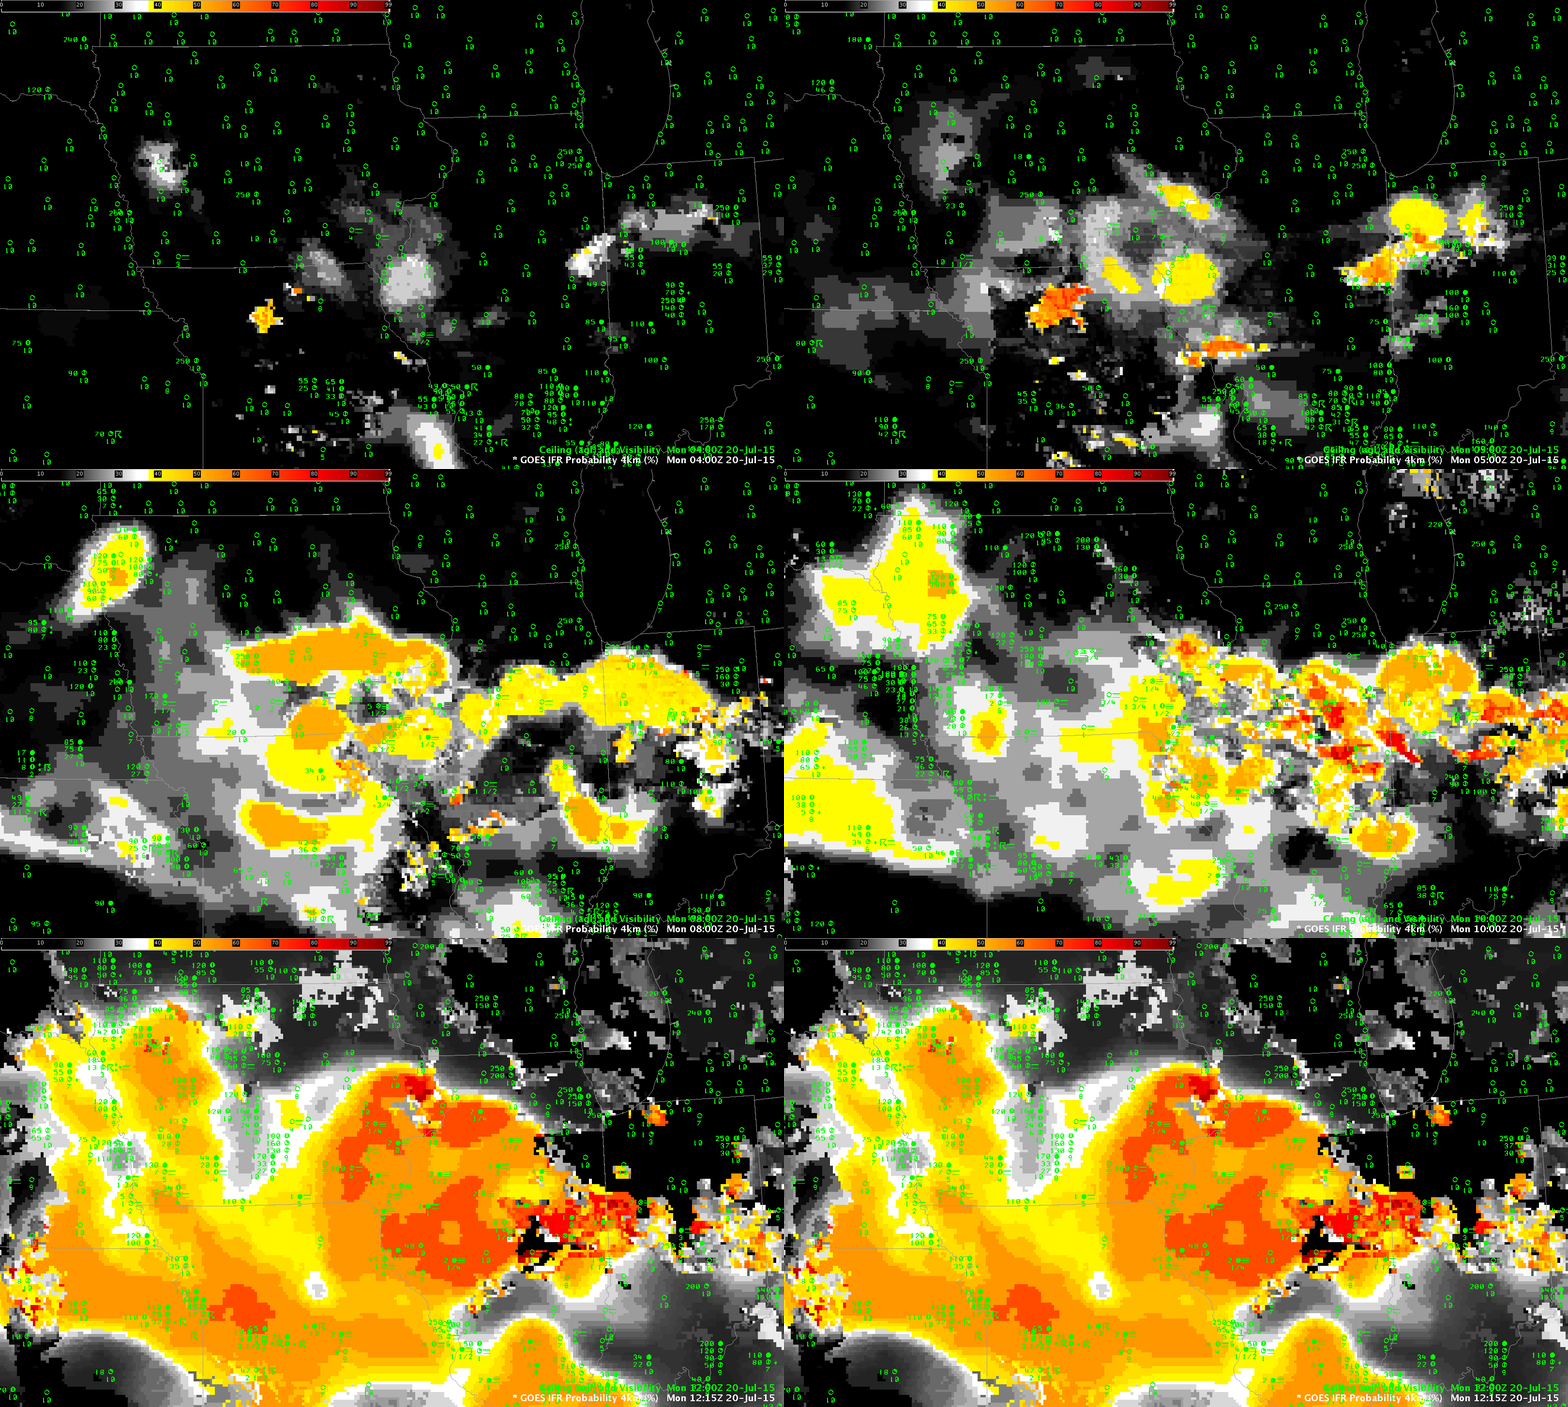
Dense fog developed over portions of eastern Iowa early in the morning of 20 July 2015. The animation above shows the hourly evolution of the GOES-R IFR Probability fields computed using satellite data from GOES-13 and Rapid Refresh model output. The flat nature of the fields in the animation above suggests the satellite data cannot view the near-surface because of higher level clouds; Brightness Temperature Difference fields, below, from 0615, 0800 and 1000 UTC confirm that hypothesis. This was a case where inclusion of the Rapid Refresh information was vital for the IFR Probability field to outline correctly the region of visibility restrictions due to fog. Note that the last GOES-based GOES-R IFR Probability image, at 1215 UTC, above, after sunrise, shows a general increase in values over the 1100 UTC image (just before sunrise). Daytime predictors (used here at 1215 UTC) result in a higher probability of IFR conditions that nighttime predictors (used here at 1100 UTC) in part because of the use of visible data for cloud-clearing.

GOES-13 Brightness Temperature Difference fields (10.7µm – 3.9µm) at 0615, 0800 and 1000 UTC on 20 July 2015 (Click to enlarge)
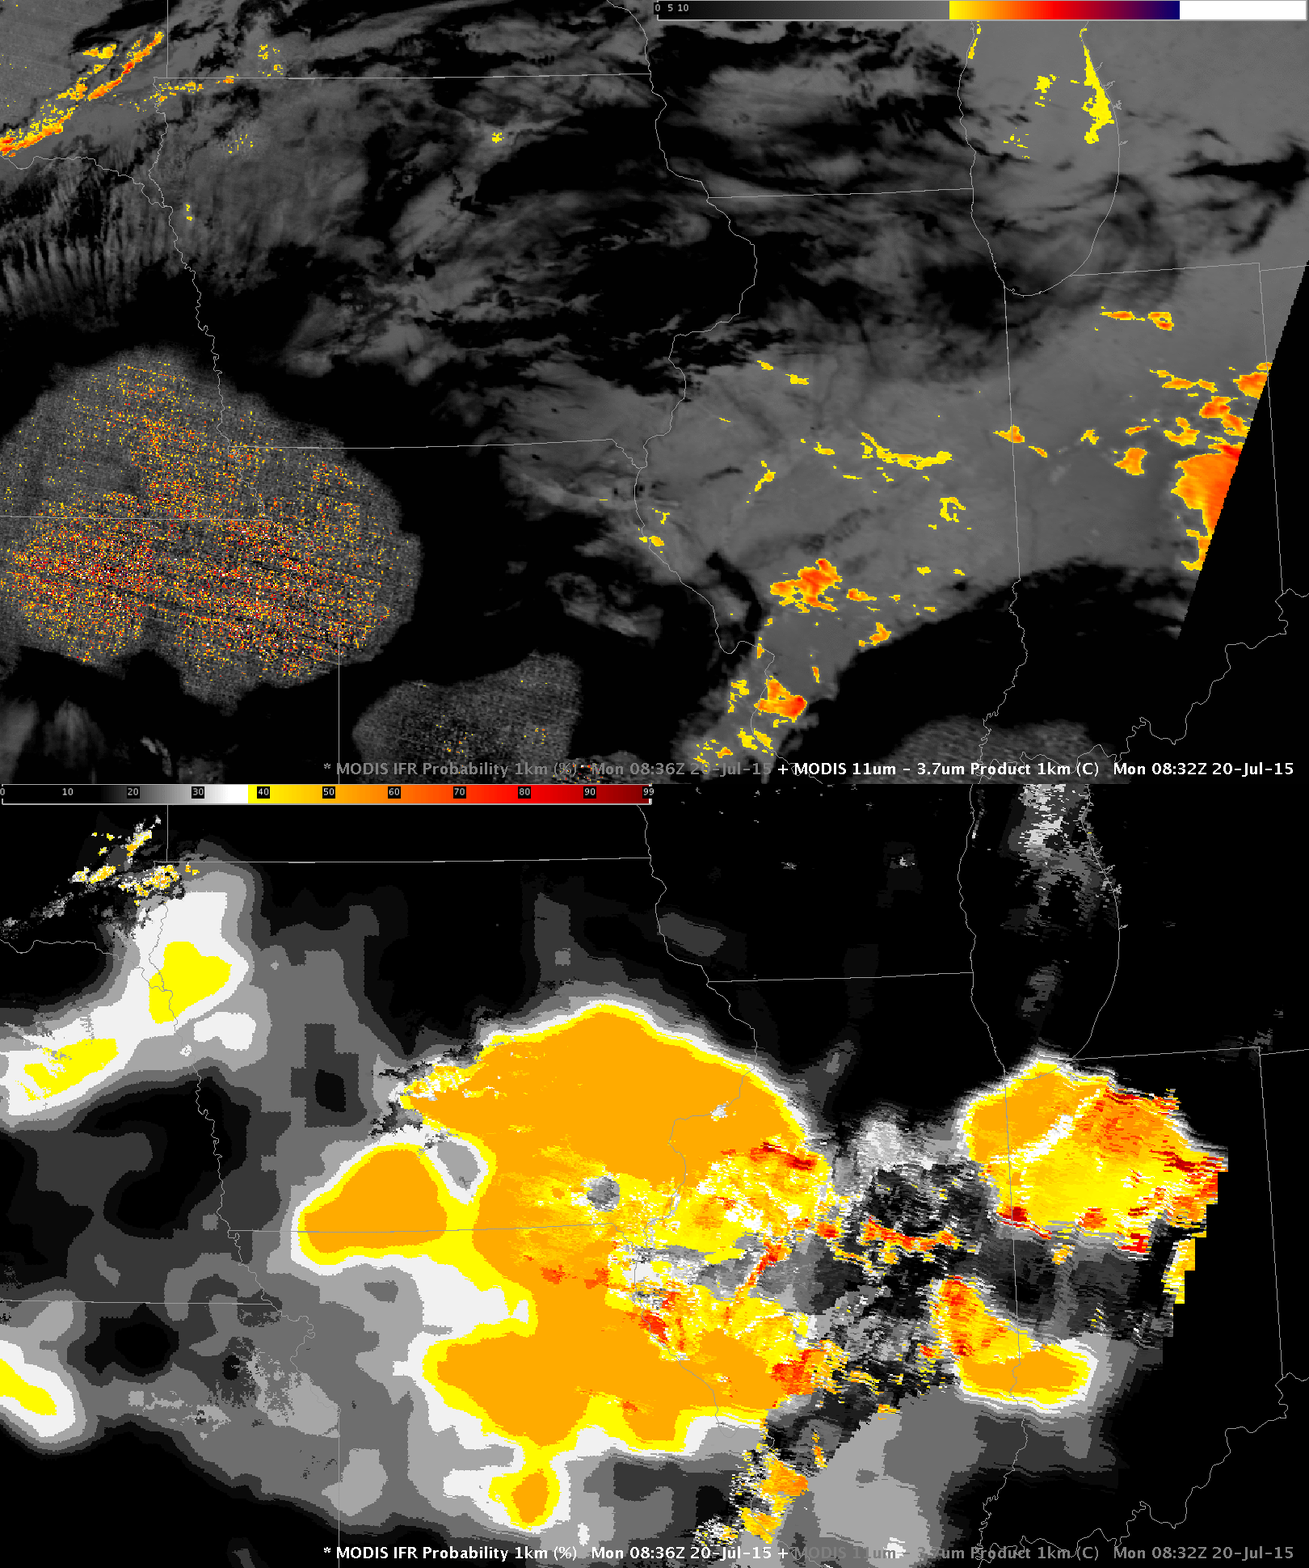
An Aqua overpass provided MODIS information at ~0830 UTC, and toggle between the brightness temperature difference field (11.0µm – 3.7µm) and MODIS-based IFR Probabilities, below, shows MODIS-based IFR Probabilities were enhanced over southern and eastern Iowa in a region where the brightness temperature difference field gave a signal consistent with mid- and high-level clouds.


