 |
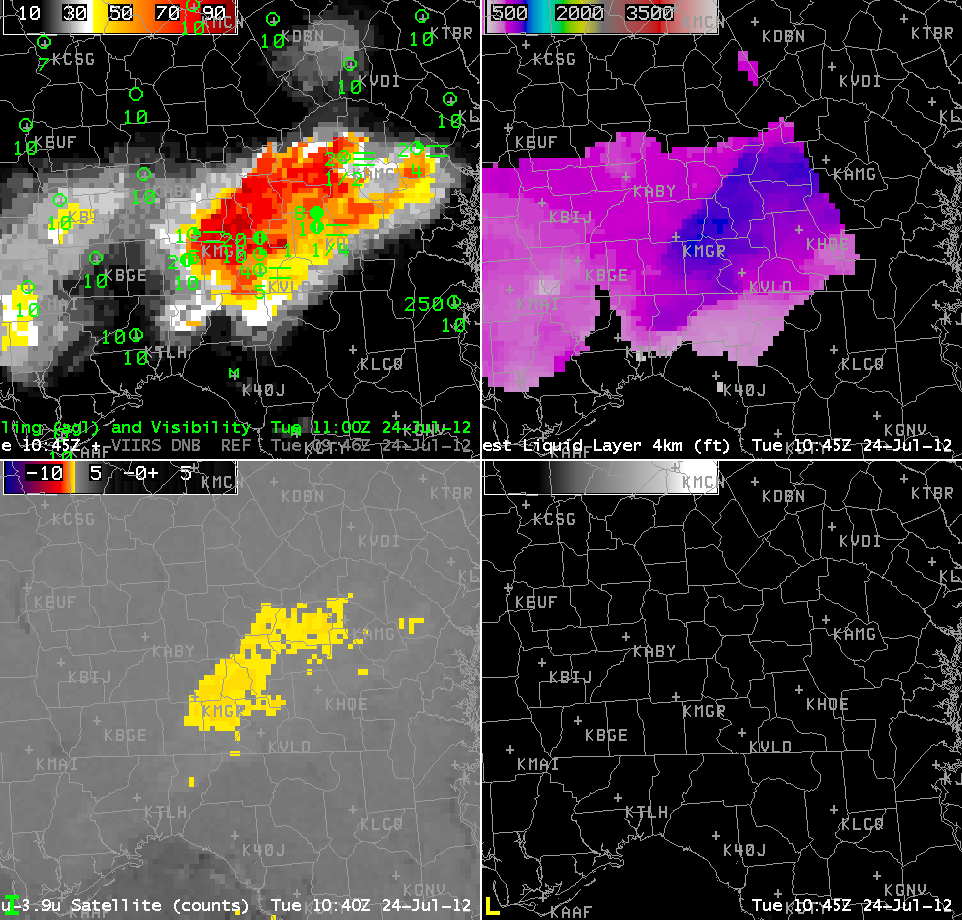
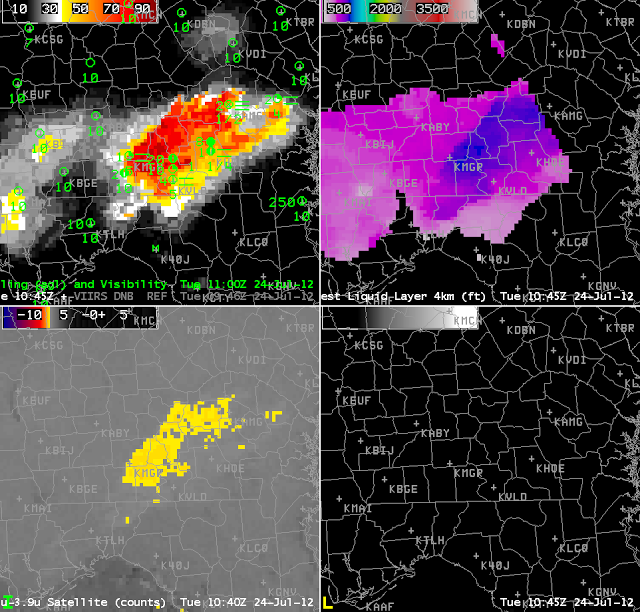
| GOES-R IFR Probability (upper left), GOES-R Cloud Thickness of highest Liquid Cloud Layer (upper right), Traditional brightness temperature difference (lower left) and Visible Imagery (lower right) over southern Georgia and northern Florida near 1100 UTC on 24 July 2012 |
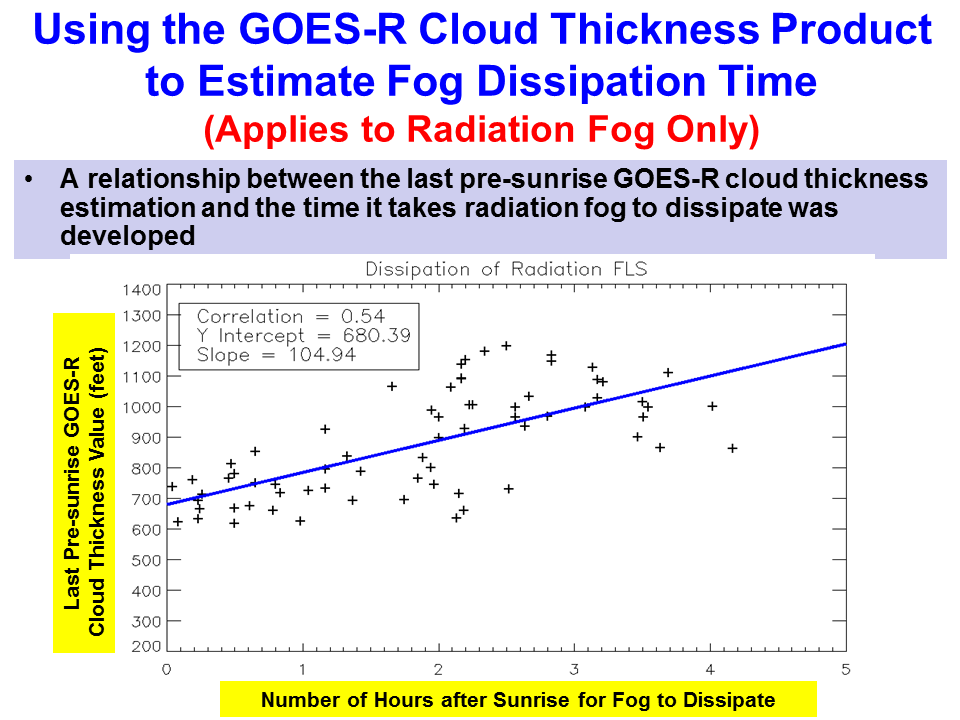
GOES-R Cloud thickness at the last valid time before sunrise (recall that Cloud Thickness is not available during twilight times) can be used as a predictor for where low clouds/fog (that formed via radiative processes) will linger longest after sunrise. In the image above, the thickest cloud — about 1000 feet thick — is diagnosed to be near KMGR (Moultrie, GA). It is in this area that the fog should be last to dissipate. The relationship between cloud thickness and time to dissipate was derived from Spring-time observations and is shown in the plot below. (You can download the figure here as a png or here as a pdf).
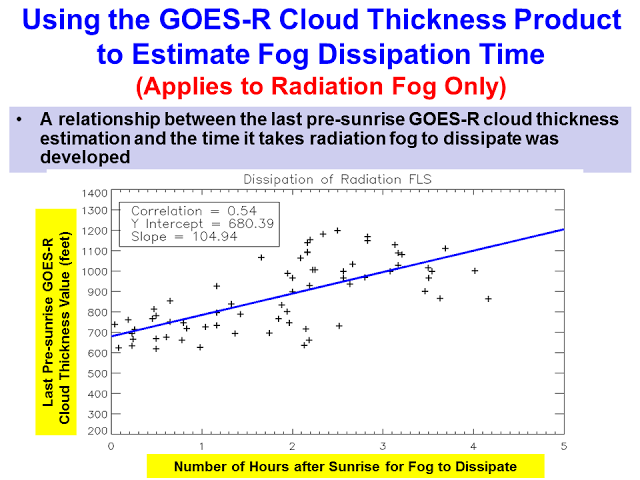 |
| This figure, from the GOES-R Fog/Low Stratus Training developed for the National Weather Service, shows dissipation time after sunrise as a function of Cloud Thickness |
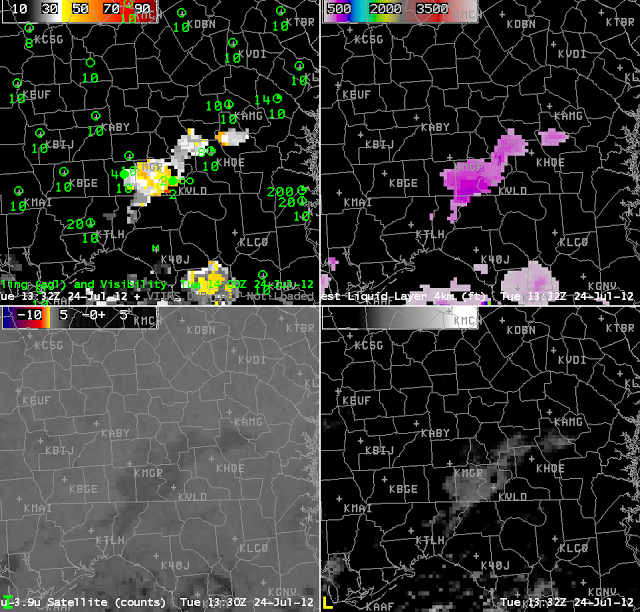 |
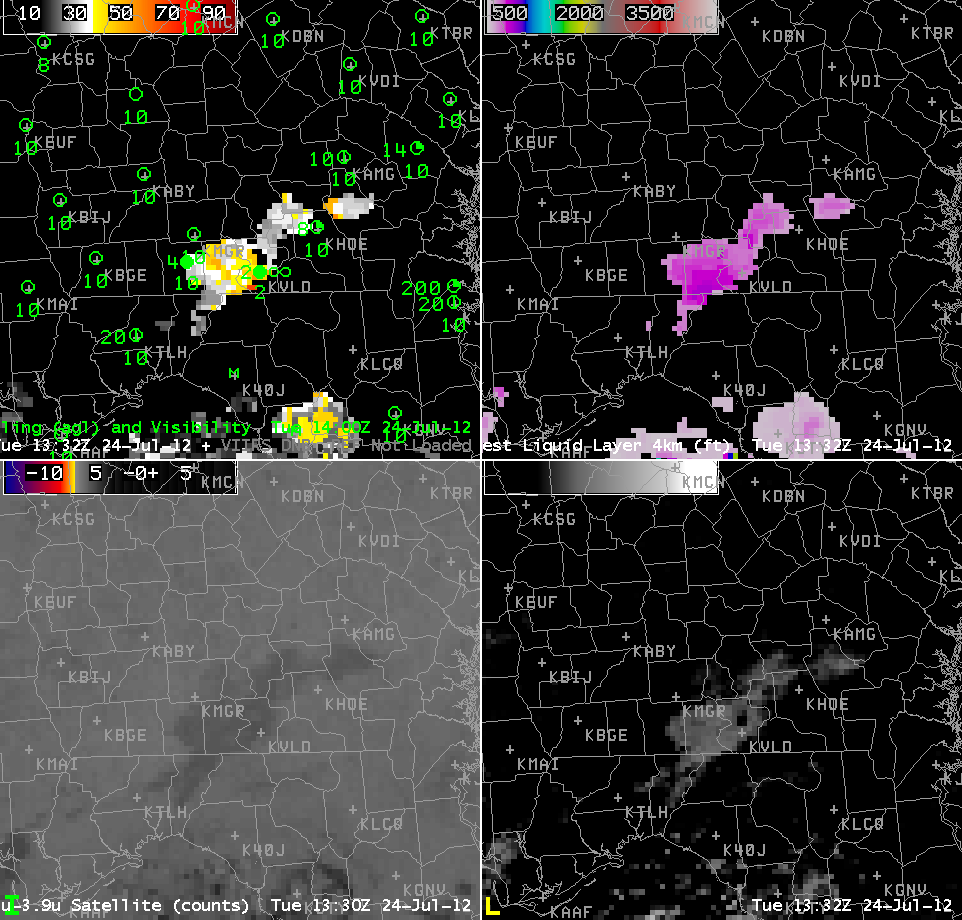
| GOES-R IFR Probability (upper left), GOES-R Cloud Thickness of highest Liquid Cloud Layer (upper right), Traditional brightness temperature difference (lower left) and Visible Imagery (lower right) over southern Georgia and northern Florida near 1330 UTC on 24 July 2012 |
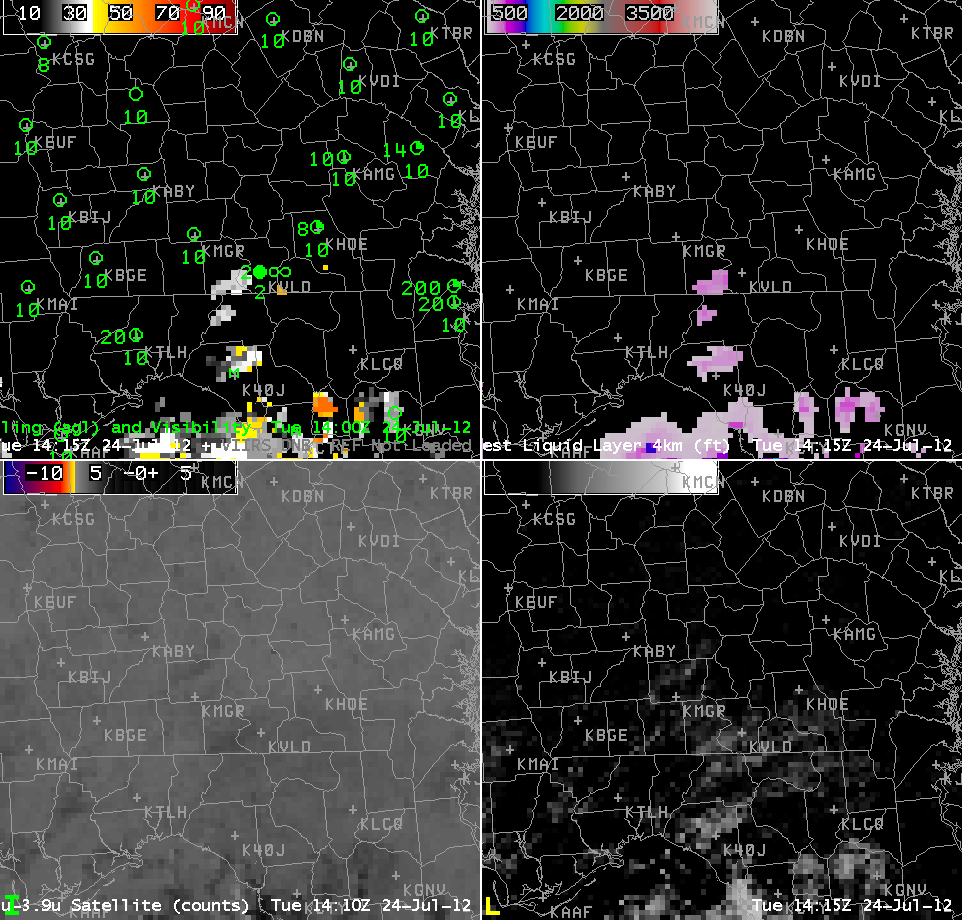
The visible imagery shows that fog is lingering as expected in the region between Moultrie and KVLD (Valdosta). By 1401 UTC, below, the fog has largely dissipated as cumulus convection starts to develop surrounding the region where fog had existed.
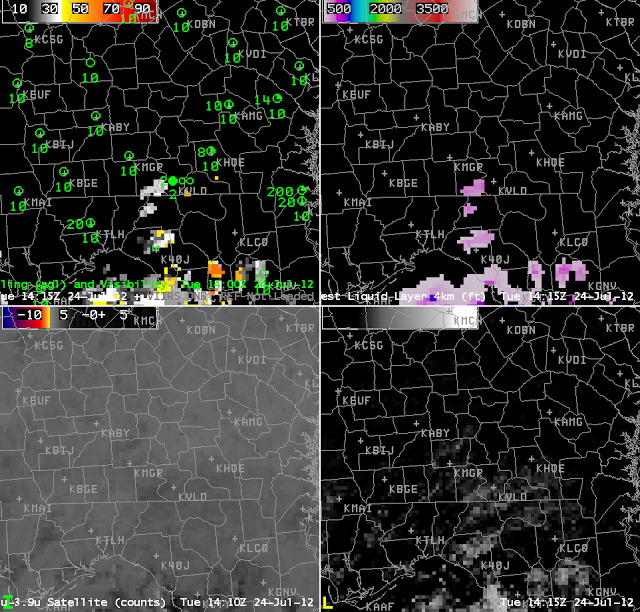 |
| GOES-R IFR Probability (upper left), GOES-R Cloud Thickness of highest Liquid Cloud Layer (upper right), Traditional brightness temperature difference (lower left) and Visible Imagery (lower right) over southern Georgia and northern Florida near 1415 UTC on 24 July 2012 |