Monthly Archives: October 2017

GOES-16 IFR Probability with Dense Fog in the Upper Midwest

GOES-16 IFR Probability fields, 0932-1157 UTC on 23 October 2017 (Click to animate)

GOES-16 data posted on this page are preliminary, non-operational and are undergoing testing.

Dense Fog developed over the upper Midwest on Monday morning, 23 October 2017, and Advisories were issued as shown below.  GOES-R IFR Probabilities are now being created using GOES-16 data, those data are now available at this link.  The uniformity of the IFR Probability fields shown above over WI suggest that high-level clouds are present, and the GOES-16 satellite could not therefore view the fog/stratus near the ground: only Rapid Refresh data were used to create GOES-R IFR Probability values.

GOES-R IFR Probability fields available to NWS Field Offices via LDM are still being computed with GOES-13 and GOES-15 data.  When GOES-16 becomes operational as GOES-East at 75.2º W Longitude, planned for December, IFR Probabilities available through the LDM will be created with GOES-16 and GOES-15 data. The switchover will happen when GOES-16 becomes operational.

Screenshot of NWS webpage from Sullivan, WI at 1200 UTC on 23 October 2017. Dense Fog advisories are in place from SW Wisconsin to NE Wisconsin. Note also the Radar imagery showing departing showers. (Click to enlarge)

Resolution and Fog Detection in the mountains of the Appalachia

GOES-16 data posted on this page are preliminary, non-operational and are undergoing testing.

Clear skies and light winds allowed for the development of Radiation Fog over parts of West Virginia and surrounding states early on Tuesday 17 October 2017, and IFR conditions were widespread (Source).

GOES-16 and GOES-13 both monitored this event, and toggles between the two brightness temperature difference fields, from 0315, 0415 and 0615 on 17 October, are shown below.  The better spatial resolution (and better precision) of the GOES-16 ABI is apparent in the imagery:  At 0415 UTC, GOES-16 is detecting river fog in many valleys in West Virginia and Kentucky, and is better resolving the detected fog over the Allegheny River in northwest Pennsylvania.  By 0615 UTC, the fog is also detected by GOES-13 — meaning it has increased in size so that the GOES-13 pixel size can detect it.  GOES-16 had a lead time of about 1-2 hours on GOES-13 in this case!

GOES-13 and GOES-16 Brightness Temperature Difference Fields, 0315 UTC on 17 October (Click to enlarge)

GOES-13 and GOES-16 Brightness Temperature Difference Fields, 0415 UTC on 17 October (Click to enlarge)

GOES-13 and GOES-16 Brightness Temperature Difference Fields, 0615 UTC on 17 October (Click to enlarge)

At present, GOES-R IFR Probabilities are created using GOES-13 data (or GOES-15 data for the western United States).  As might be expected, the GOES-R IFR Probabilities also lagged the GOES-16 Brightness Temperature Difference field in alerting to fog.  The short animation below shows values hourly from 0315-0615.  Very small IFR Probabilities are present at 0315 and 0415 — because, in part, the GOES-13 Imager cannot resolve the developing Fog/Stratus (and the Rapid Refresh model lacks the horizontal resolution to reproduce what is happening in narrow river valleys).  By 0515, and 0615 especially, GOES-R IFR probabilities are suggesting that a region of fog is likely.

One other thing to note:  There is a small signal in the brightness temperature difference field at 0315 UTC, above, in northwest Ohio in both GOES-13 and GOES-16 imagery.  There is no corresponding signal in the IFR Probability field.  The conclusion is that this is mid-level stratus that is not affecting surface visibility or ceilings.

GOES-R IFR Probabilities, hourly from 0315-0615 UTC on 17 October 2017 (Click to enlarge)

GOES-R IFR Probabilities, supplied via an LDM feed to National Weather Service Offices, will use GOES-13 (or GOES-15) imagery until GOES-16 is operational at 75.2 degrees West Longitude.  When GOES-16 is operational, GOES-R IFR Probabilities will use GOES-16 data, and that data will flow through the LDM.  In the meantime, GOES-16 IFR Probabilities can be viewed at this site.

Fog returned the following morning.  Link.

The GOES-16 Version of GOES-R IFR Probability

GOES-R IFR Probability fields computed using GOES-16 Data and Rapid Refresh Model Output, 1042 UTC on 3 October 2017 (Click to enlarge)

GOES-16 data posted on this page are preliminary, non-operational and are undergoing testing

The suite of GOES-R IFR Probability products are now being computed using GOES-16 data, with a 5-minute temporal cadence over CONUS.  Products include IFR Probability (above), Low IFR Probability, MVFR Probability and Cloud Height.  These products are only available for now at http://cimss.ssec.wisc.edu/geocat ;  however, work is progressing to have the fields available through an LDM feed.  The GOES-R IFR Probability fields computed using Legacy GOES (GOES-13 and GOES-15) continue to flow to the National Weather Service via the LDM.

IFR Conditions in Pennsylvania and Oregon

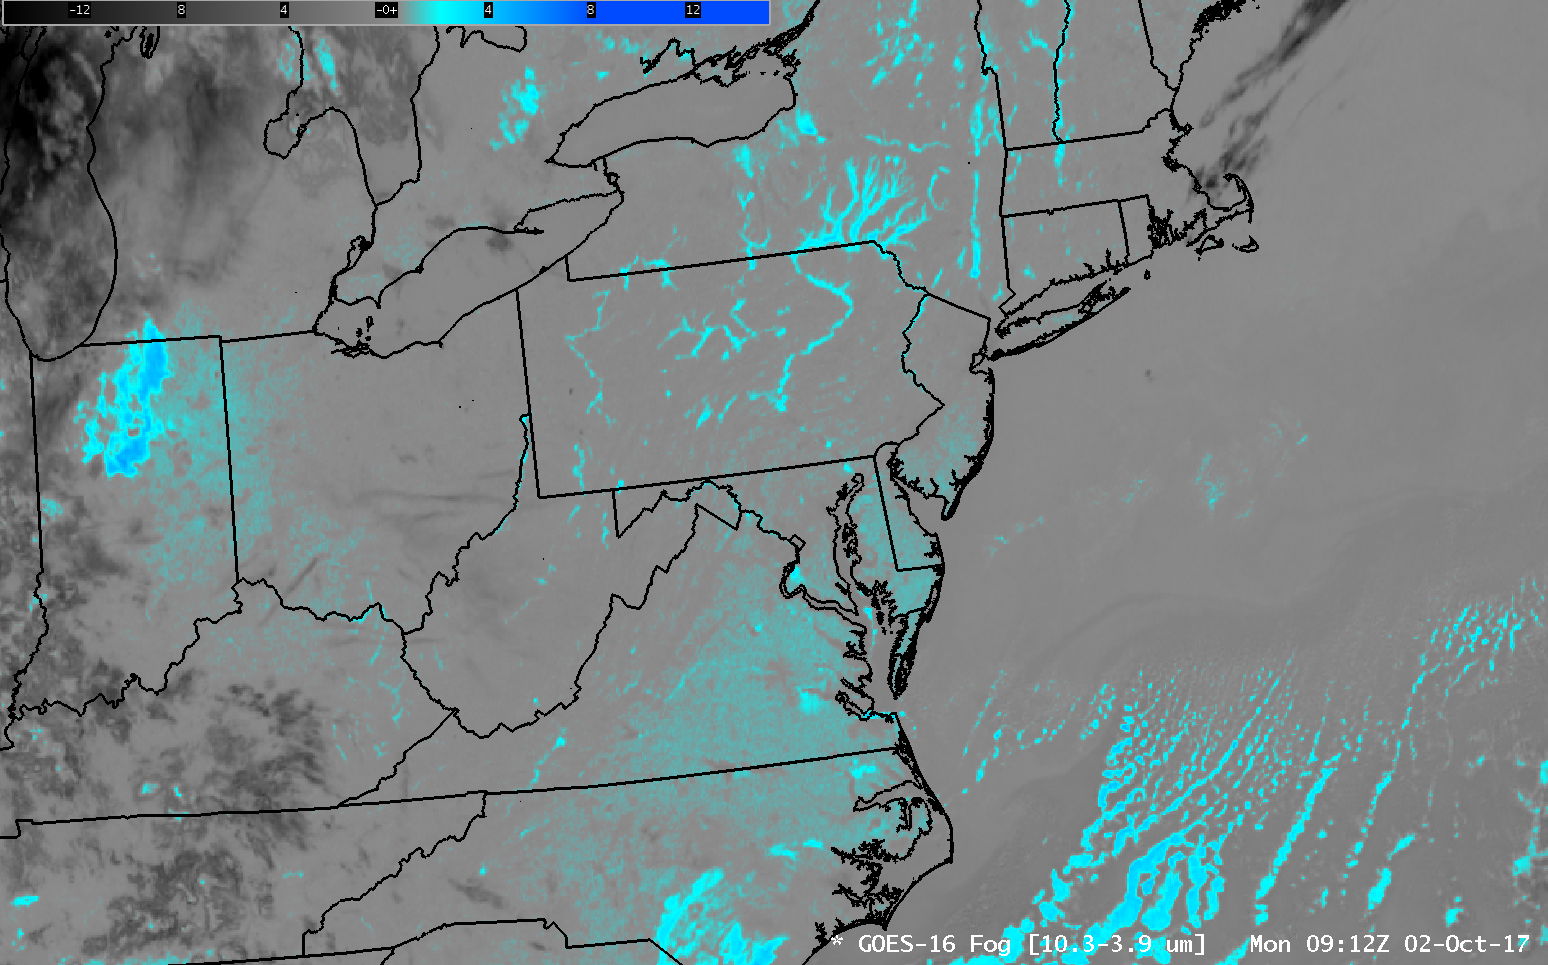
GOES-16 Brightness Temperature Difference (10.3 µm – 3.9 µm) at 0912 UTC on 2 October 2017 over the Mid-Atlantic States (click to enlarge)

GOES-16 data posted on this page are preliminary, non-operational and are undergoing testing.

The images above show the GOES-16 Brightness Temperature Difference at the same time at two places over the United States: The mid-Atlantic States (above) and Oregon and surrounding States (below).  The ‘Fog’ Product, as this Brightness Temperature Difference is commonly called, in reality identifies only clouds that are made up of water droplets — that is, stratus.  A cloud made up of water droplets emits 10.3 µm radiation nearly as a blackbody does. Thus, the computation of Brightness Temperature — which computation assumes a blackbody emission — results is a temperature close to that which might be observed.  In contrast, those water droplets do not emit 3.9 µm radiation as a blackbody would.  Thus, the amount of radiation detected by the satellite is smaller than would be detected if blackbody emissions were occurring, and the computation of blackbody temperature therefore yields a colder temperature, and the brightness temperature difference field, above, will show clouds made up of water droplets as positive, or cyan in the enhancement above.

The River Valleys of the northeast show a very strong signal that suggests Radiation Fog is developing over the relatively warm waters in the Valleys.  The Delaware, Hudson, Mohawk, Connecticut, Susquehanna, Allegheny, Monongahela, and others — all show a signature that one would associate with fog.  A signal is also apparent from southern New Jersey southwestward through the Piedmont of North Carolina.  Would you expect there to be fog there as well, given the signal?

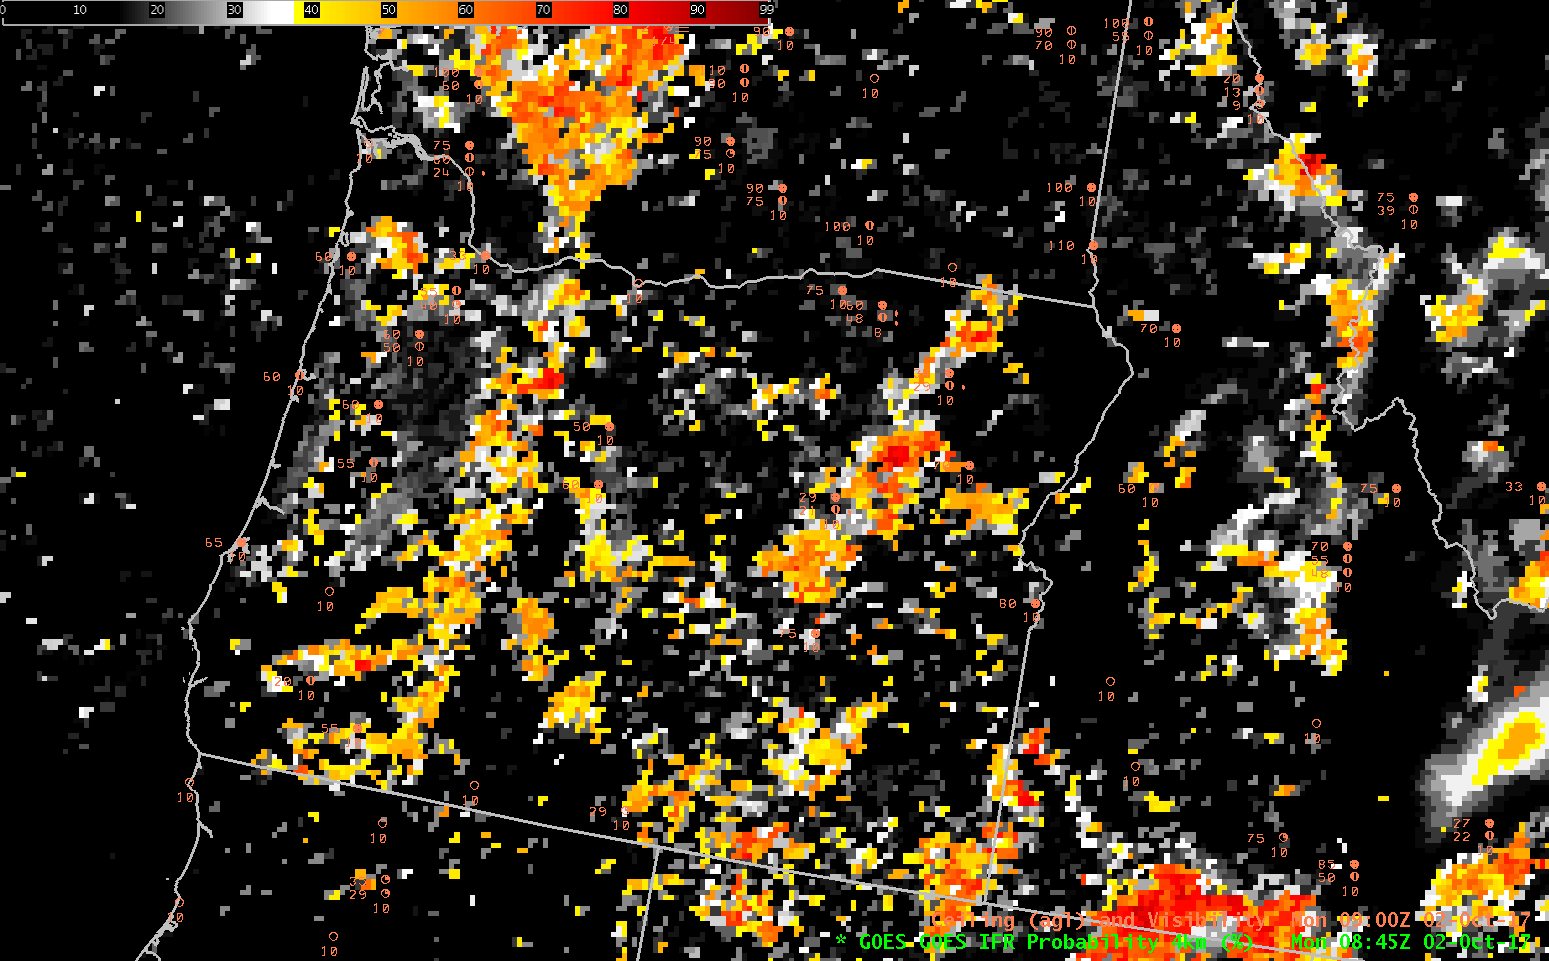
The State of Oregon at the same time shows a very strong signal in the ‘Fog’ Product.  A clue that this might be only stratus, and not visibility-restricting fog, lies in the structure of the clouds — they do not seem to be constrained by topographic features as is common with fog.

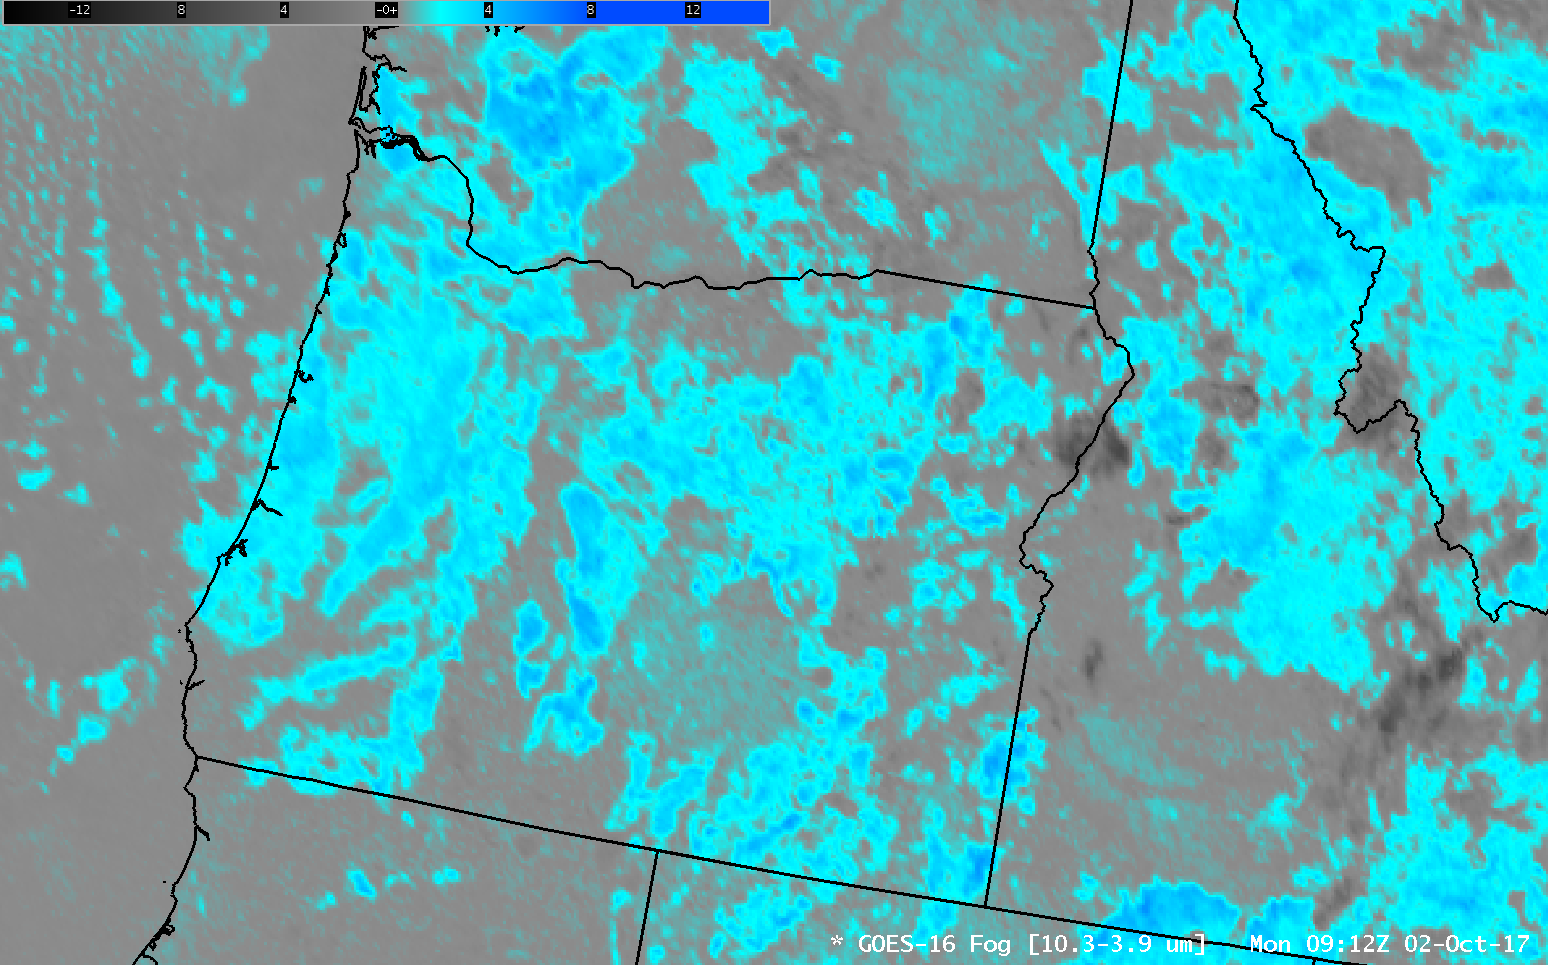
GOES-16 Brightness Temperature Difference (10.3 µm – 3.9 µm) at 0912 UTC on 2 October 2017 over Oregon and adjacent States (click to enlarge)

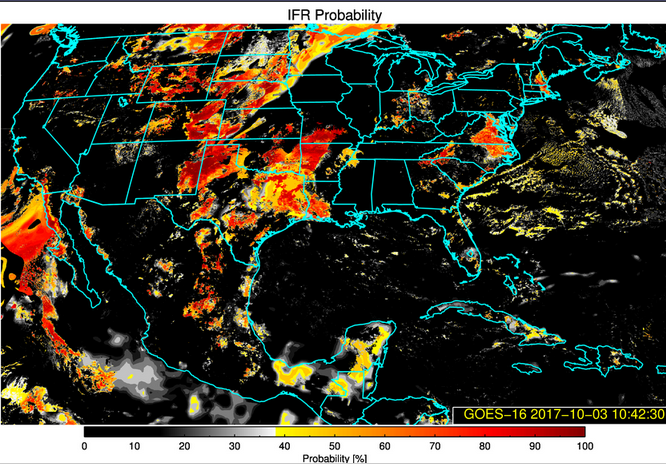
GOES-R IFR Probabilities are computed using Legacy GOES (GOES-13 and GOES-15) and Rapid Refresh model information; Preliminary IFR Probability fields computed with GOES-16 data are available here.  These GOES-16 fields should be available via LDM Request when GOES-16 becomes operational as GOES-East.

GOES-R IFR Probability Fields use both the Brightness Temperature Difference field (10.7 µm – 3.9 µm) from heritage GOES instruments and information about low-level saturation from Rapid Refresh Model output.  The horizontal resolution on GOES-13 and GOES-15 is coarser than on GOES-16 (4 kilometers at the sub-satellite point vs. 2 kilometers), so small river valleys will not be resolved.  (It is also difficult for the Rapid Refresh model to resolve small valleys).

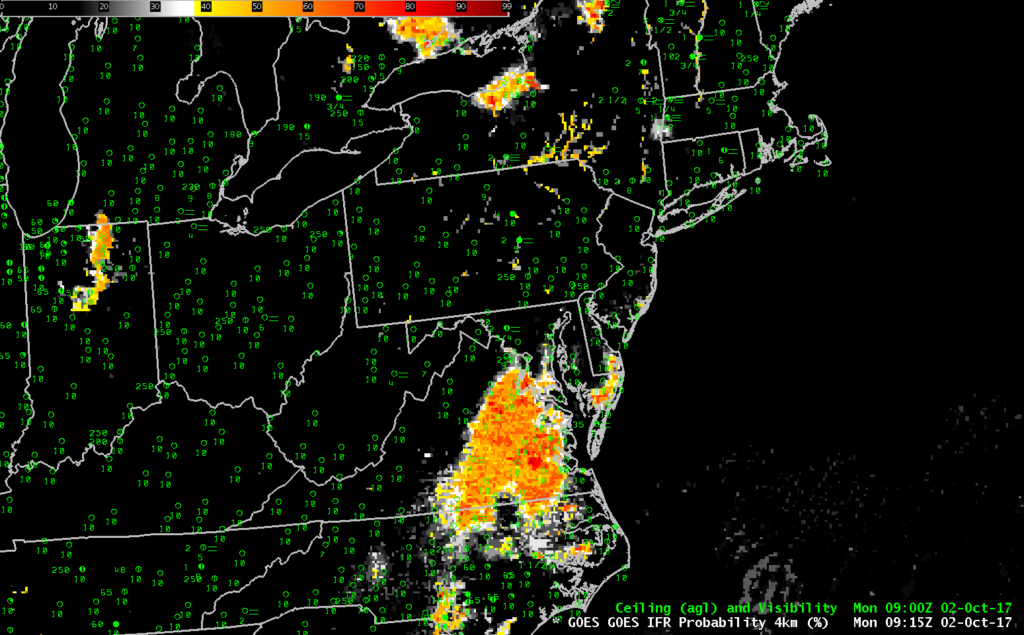
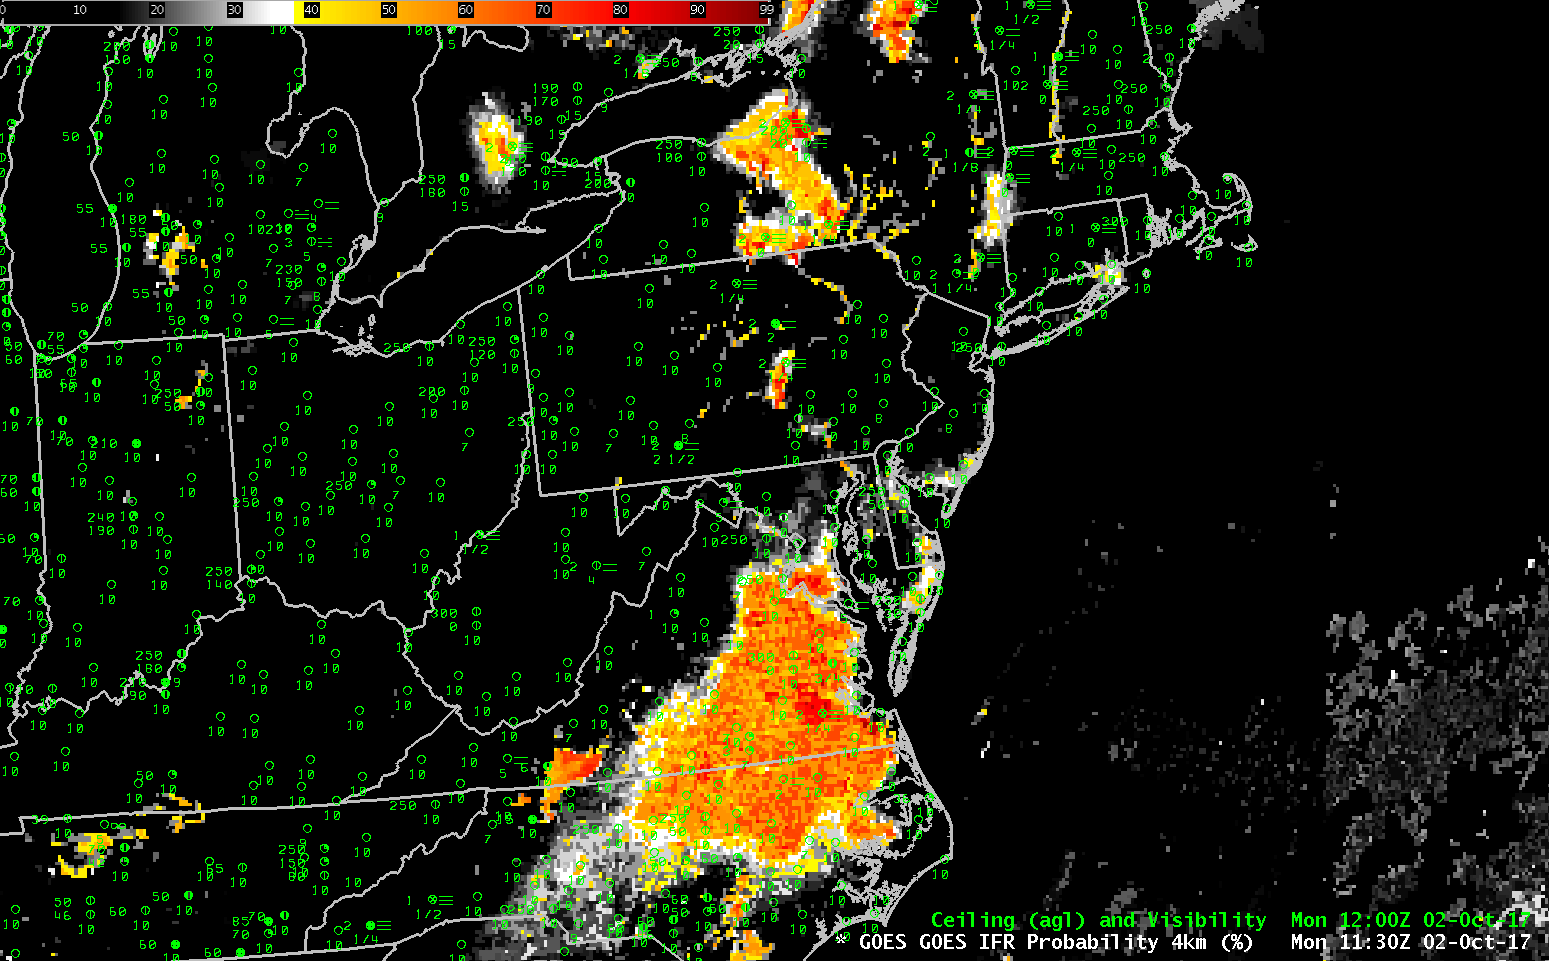
GOES-R IFR Probability fields at 0915 UTC, along with 0900 UTC surface observations of ceilings and visibility (Click to enlarge)

The IFR Probability Fields, above, show some signal over the river valleys of the northeast; that signal is mostly satellite-based, but the poor resolution of GOES-13 means that fog/stratus in the river valleys is not well-resolved. Still, a seasoned forecaster could likely interpret the small signals that are developing to mean fog is in the Valleys.  (And restrictions to ceilings and visibilities are certainly reported in the river valleys of the Mid-Atlantic and Northeast)   IFR Probabilities are also noticeable over southeast Virginia, although widespread surface observations showing IFR Conditions are not present.  (Such observations are somewhat more common near sunrise, at 1130 UTC).

IFR Probabilities are much less widespread over Oregon, with most of the signal over western Oregon related to the topography.  In this example, IFR Probabilities are ably screening out regions where elevated stratus is creating a strong signal for the satellite in the Brightness Temperature Difference field.