Monthly Archives: July 2015

Dense Fog over the Deep South

TEXAS_GOESIFR_0700_1300_30July2015anim

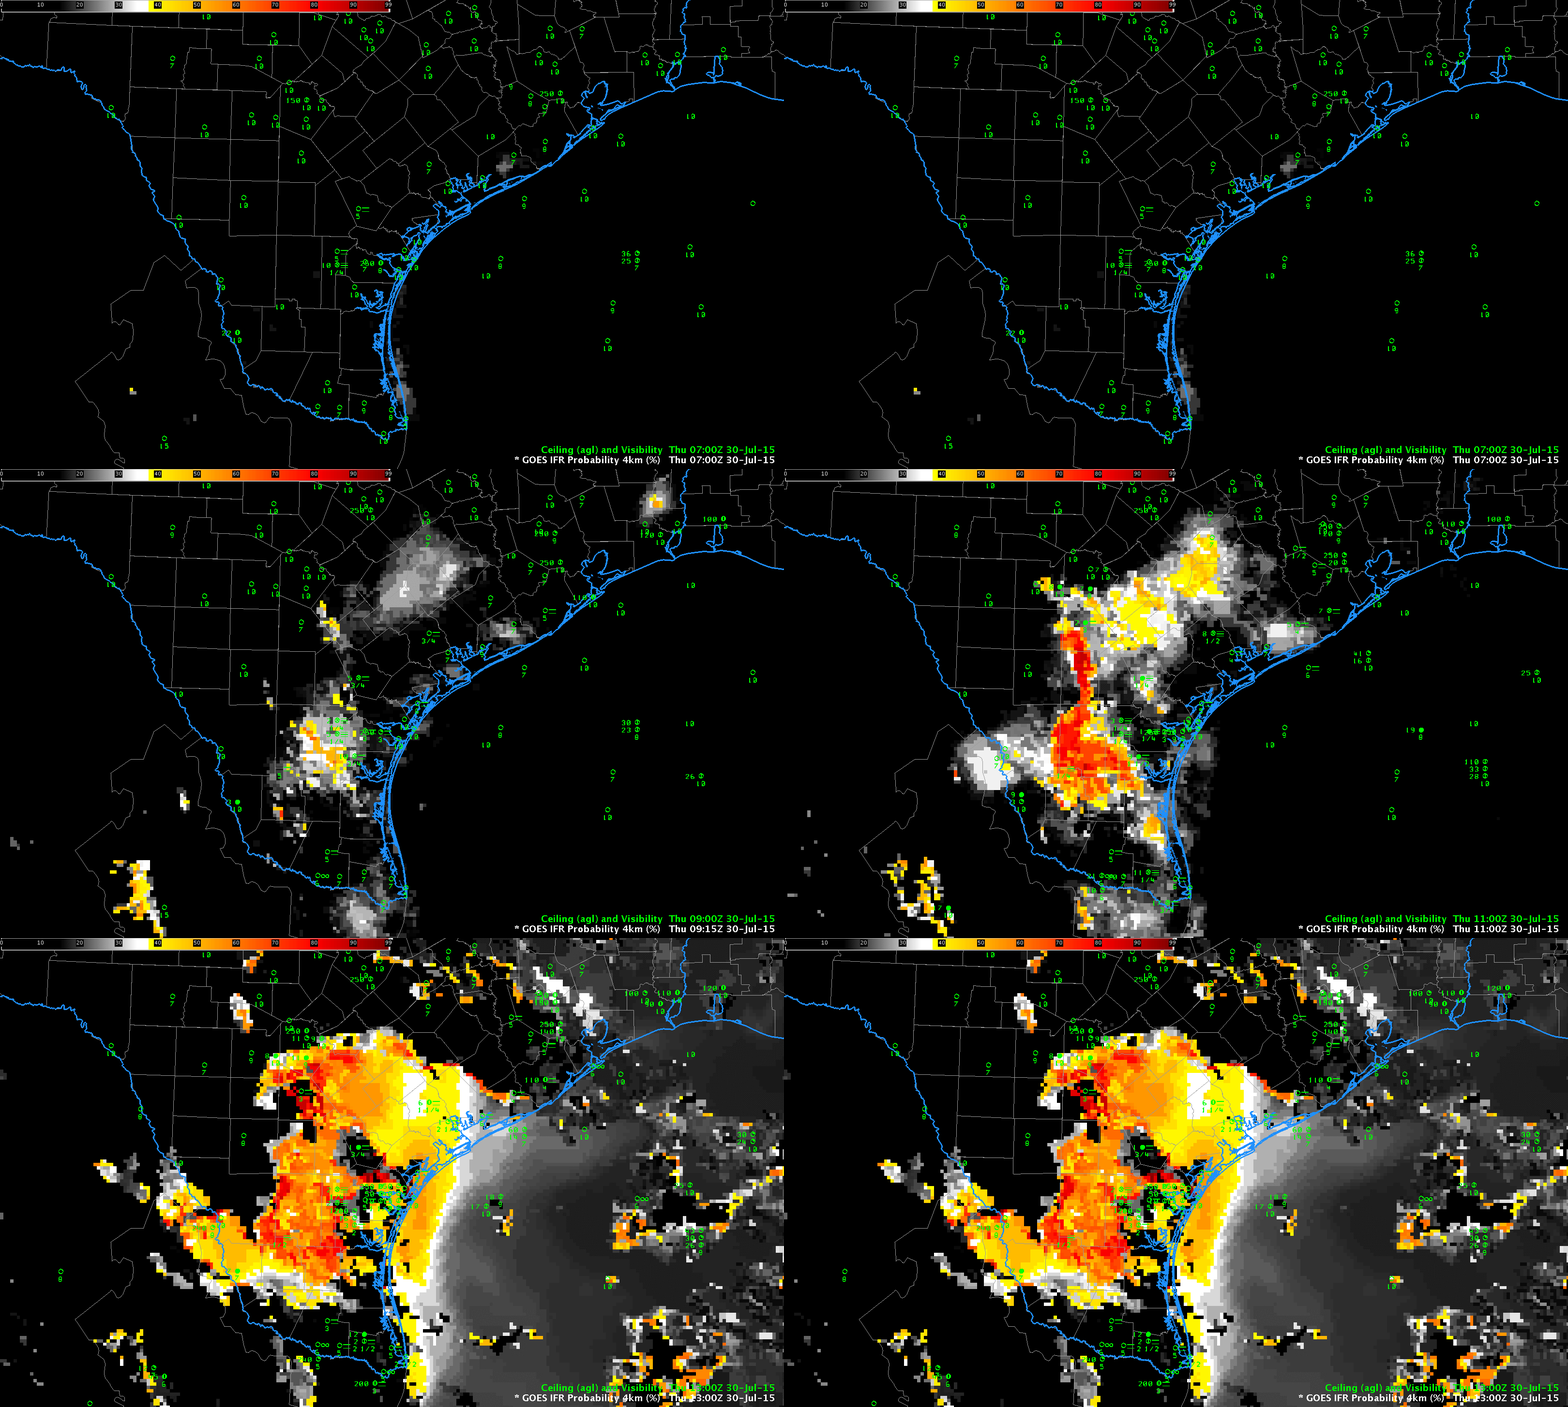
GOES-R IFR Probability Fields, hourly from 0700 through 1300 UTC, 30 July 2015 (Click to enlarge)

Dense Fog Advisories were issued over inland south Texas on the morning of Thursday 30 July (below). GOES-R IFR Probabilities of this event, above, capture the development of IFR conditions after 0700 UTC (2 AM CDT). Values are quite small until about 0900 UTC, as IFR conditions develop around Alice, TX and Orange Grove Naval Air Station (in Jim Wells County) and then expand. Comparing the GOES-R IFR Probability fields, above, and the GOES-13 Brightness Temperature Difference fields, below, suggest that the model component in the IFR Probability fields showed low-level saturation occurring a bit farther north than the initial strongest pixel returns in the Brightness Temperature Difference fields. For example, compare this toggle of GOES-R IFR Probability and GOES-13 Brightness Temperature Difference fields at 0800 UTC: Larger values of GOES-R IFR Probability (albeit still small — around 20%) are shifted north of the strongest enhancements in the 0800 Brightness Temperature Difference fields, which stronger enhancements are mostly near the Rio Grande). The toggle for 1000 UTC is here.
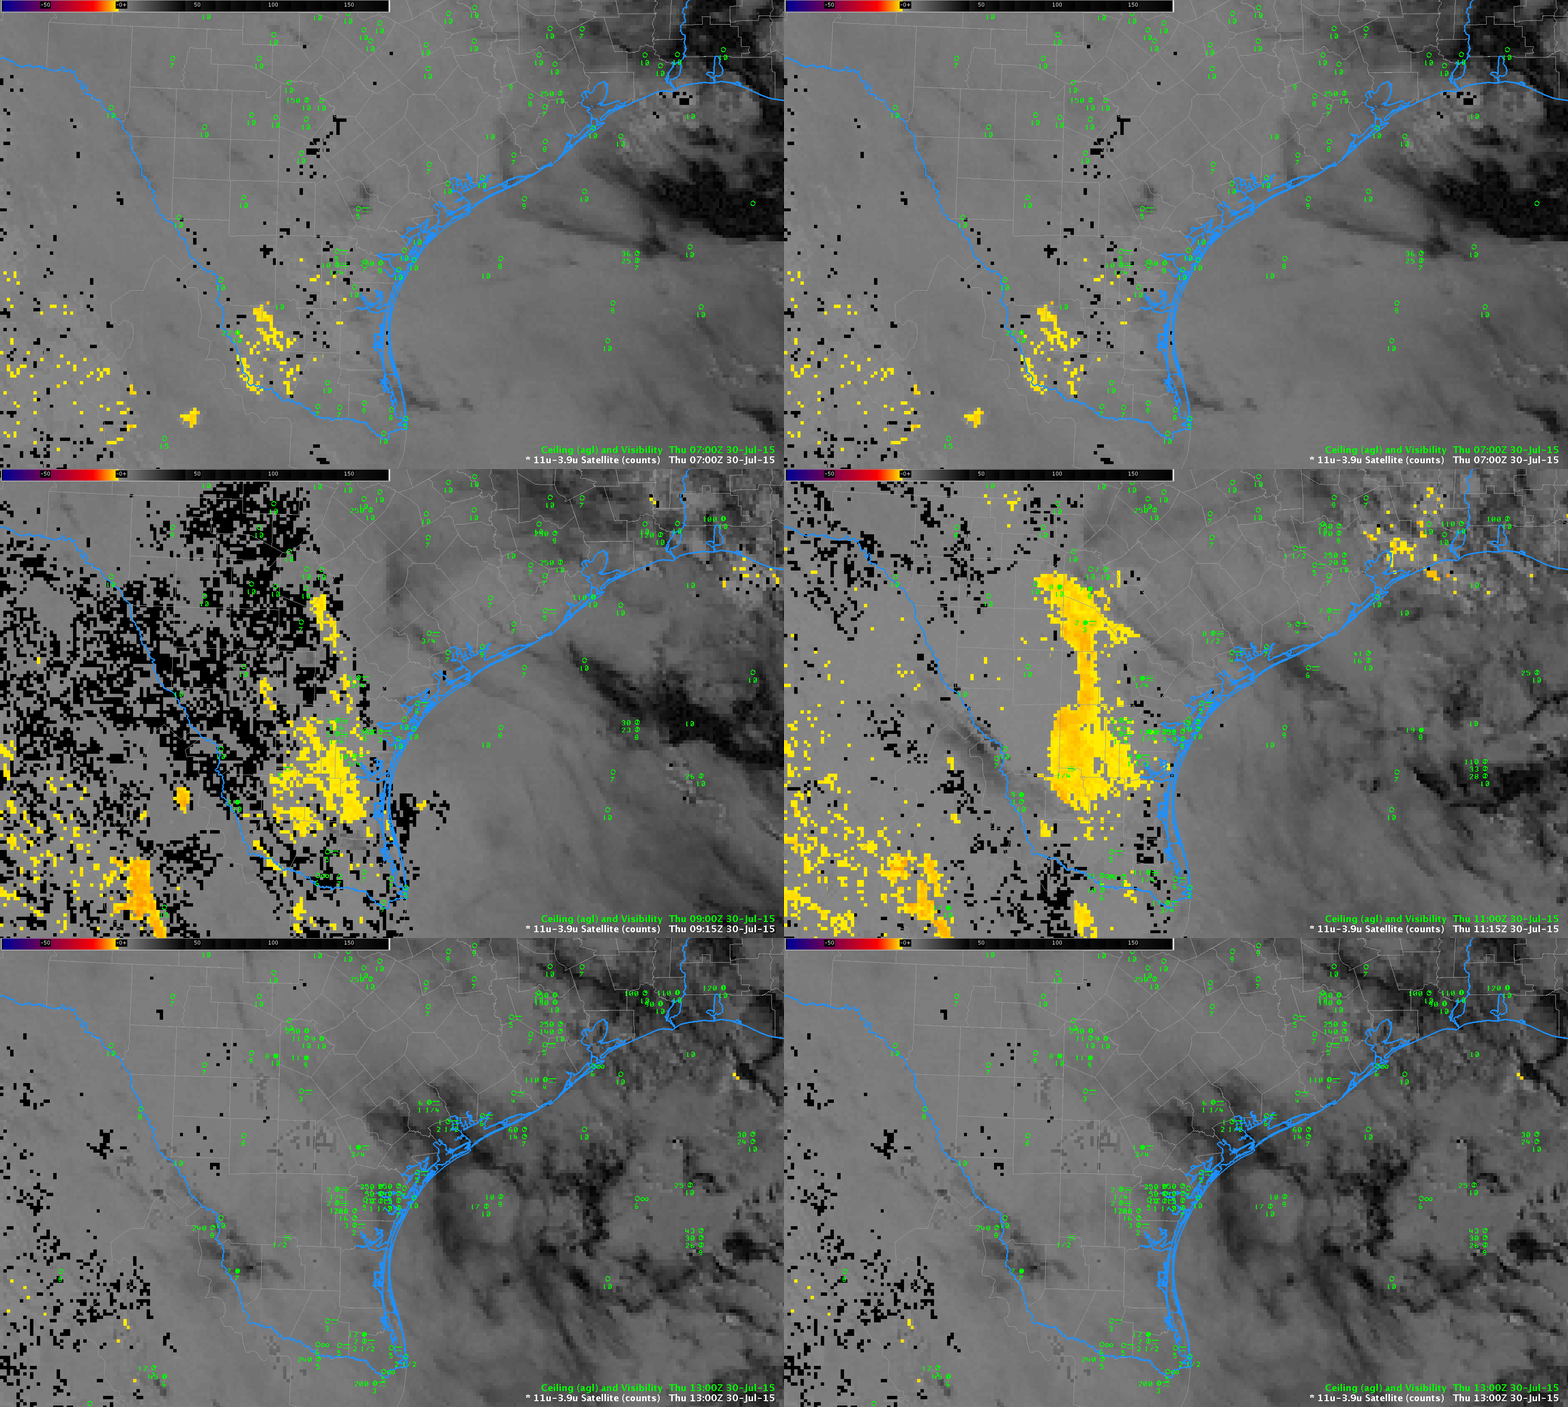
TEXAS_GOESBTD_0700_1300_30July2015anim

GOES-13 Brightness Temperature Difference (10.7µm – 3.9µm) Fields, hourly from 0700 through 1300 UTC, 30 July 2015 (Click to enlarge)

URGENT – WEATHER MESSAGE
NATIONAL WEATHER SERVICE BROWNSVILLE TX
612 AM CDT THU JUL 30 2015

…AREAS OF DENSE FOG CONTINUE TO DEVELOP ACROSS NORTHERN
RANCHLANDS THIS MORNING…

.CLEAR SKIES AND CALM WINDS CONTINUE TO ALLOW AREAS OF DENSE FOG
TO DEVELOP ACROSS NORTHERN PORTIONS OF DEEP SOUTH TEXAS THIS
MORNING. VISIBILITIES WILL BE REDUCED TO A QUARTER OF A MILE IN
AREAS OF DENSE FOG.

TXZ249-250-301400-
/O.NEW.KBRO.FG.Y.0016.150730T1112Z-150730T1400Z/
JIM HOGG-BROOKS-
INCLUDING THE CITIES OF…HEBBRONVILLE…FALFURRIAS
612 AM CDT THU JUL 30 2015

…DENSE FOG ADVISORY IN EFFECT UNTIL 9 AM CDT THIS MORNING…

THE NATIONAL WEATHER SERVICE IN BROWNSVILLE HAS ISSUED A DENSE
FOG ADVISORY…WHICH IS IN EFFECT UNTIL 9 AM CDT THIS MORNING.

* VISIBILITY…VISIBILITIES WILL BE REDUCED TO A QUARTER OF A
MILE.

* IMPACTS…DRIVING WILL BE DIFFICULT ON STREETS AND ROADS
ESPECIALLY IN RURAL AREAS.

PRECAUTIONARY/PREPAREDNESS ACTIONS…

MOTORISTS SHOULD SLOW DOWN…USE LOW BEAM HEADLIGHTS…AND
MAINTAIN A SAFE DISTANCE BETWEEN VEHICLES.

&&

$$

CASTILLO

URGENT – WEATHER MESSAGE
NATIONAL WEATHER SERVICE CORPUS CHRISTI TX
757 AM CDT THU JUL 30 2015

…DENSE FOG THIS MORNING OVER EASTERN PORTIONS OF THE RIO GRANDE
PLAINS…

.THE COMBINATION OF NEAR SURFACE MOISTURE…DRY AIR ALOFT…AND
LIGHT WIND…HAS RESULTED IN AREAS OF DENSE FOG OVER THE SOUTHERN
COASTAL BEND AND OVER EASTERN PORTIONS OF THE RIO GRANDE PLAINS
EARLY THIS MORNING. HOWEVER…CONDITIONS WILL IMPROVE BY MID
MORNING AS TEMPERATURES INCREASE SUFFICIENT TO RESULT IN
UNSATURATED CONDITIONS NEAR THE SURFACE.

TXZ230>232-240-241-301500-
/O.EXT.KCRP.FG.Y.0018.000000T0000Z-150730T1500Z/
MCMULLEN-LIVE OAK-BEE-DUVAL-JIM WELLS-
INCLUDING THE CITIES OF…CALLIHAM…CROSS…LOMA ALTA…TILDEN…
GEORGE WEST…THREE RIVERS…BEEVILLE…FREER…BENAVIDES…
SAN DIEGO…ALICE…ORANGE GROVE
757 AM CDT THU JUL 30 2015

…DENSE FOG ADVISORY NOW IN EFFECT UNTIL 10 AM CDT THIS
MORNING…

* VISIBILITY…ONE-QUARTER MILE OR LESS

* IMPACTS…DENSE FOG WILL RENDER DRIVING HAZARDOUS.

PRECAUTIONARY/PREPAREDNESS ACTIONS…

A DENSE FOG ADVISORY MEANS VISIBILITIES WILL FREQUENTLY BE
REDUCED TO LESS THAN ONE QUARTER MILE. IF DRIVING…SLOW DOWN…
USE LOW-BEAM HEADLIGHTS…AND LEAVE PLENTY OF DISTANCE AHEAD OF
YOU.

&&

$$

PZ

South Texas had favorable geometry today that allowed for successive Suomi NPP overpasses to provide information. The Day Night Band imagery, below, and the Brightness Temperature Difference fields, below the Day Night Band, suggest few clouds are detected at 0727 UTC or at 0906 UTC.
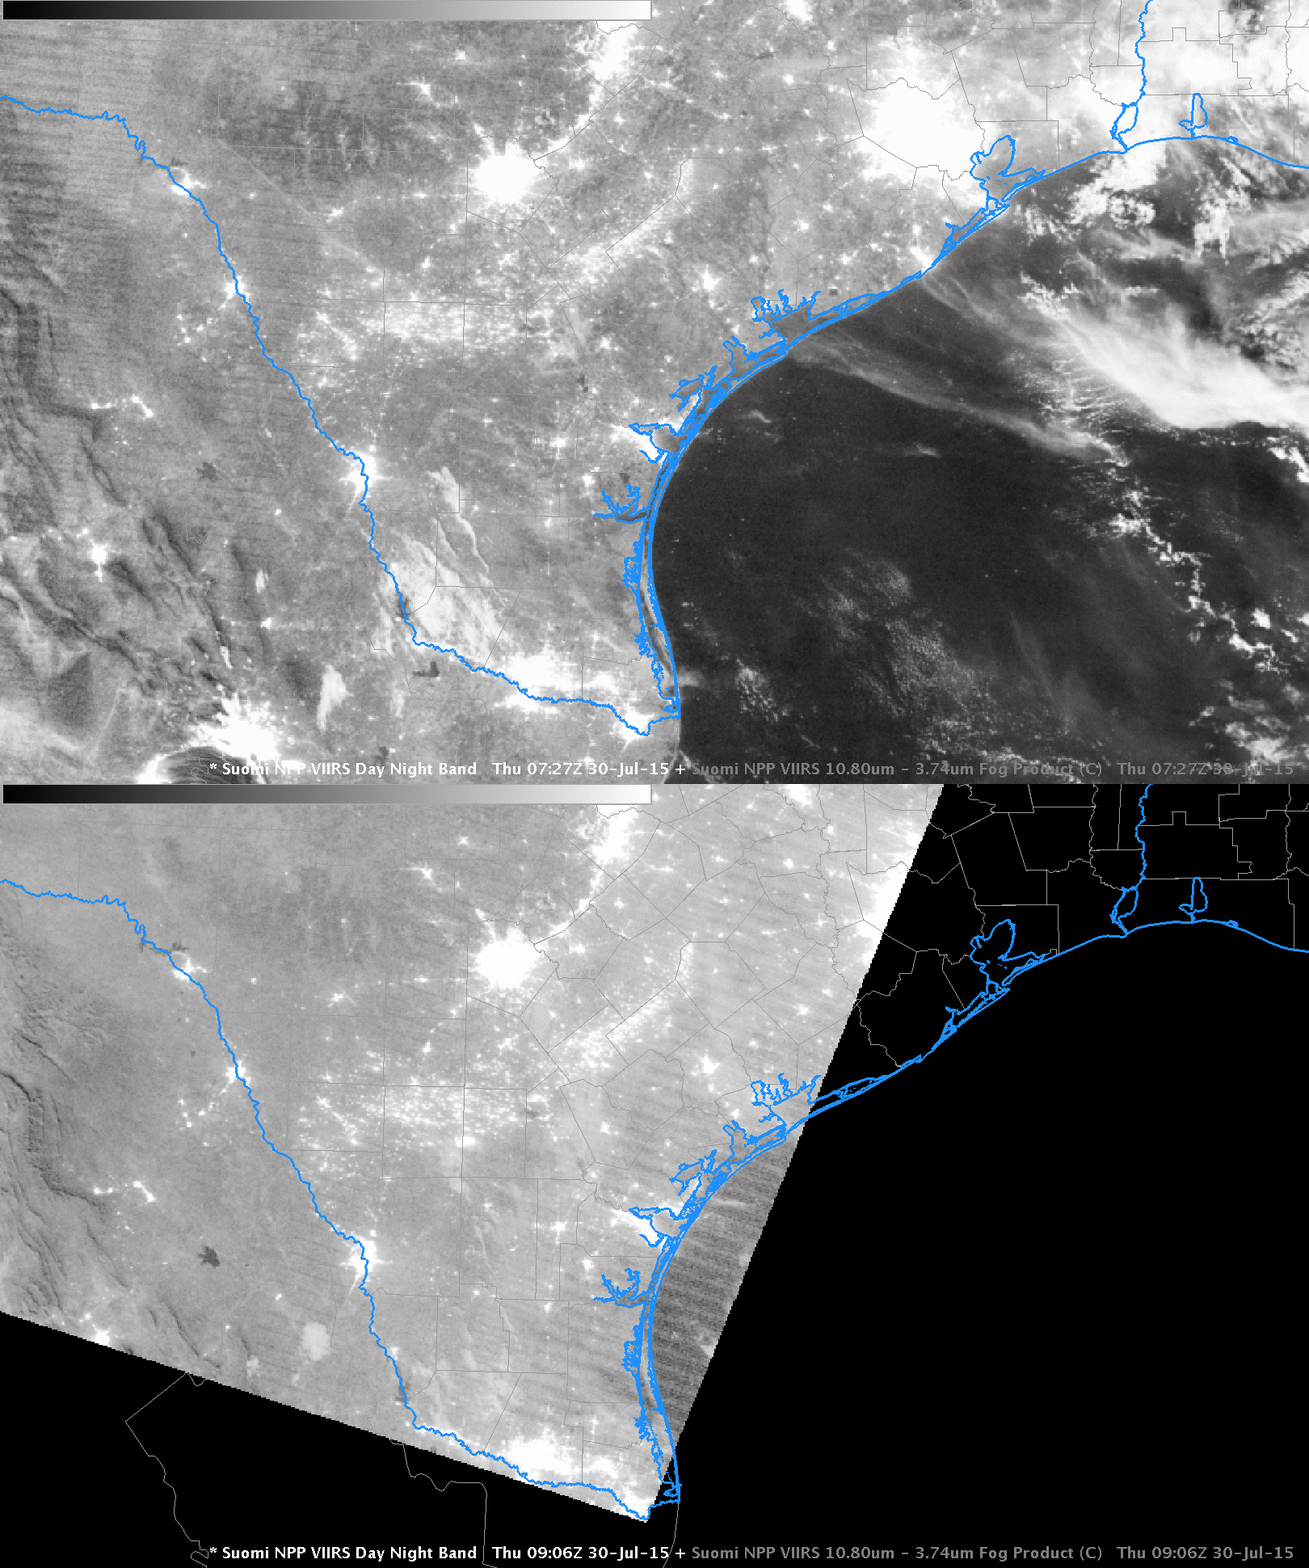
SNPP_DNB_0727_0906_30July2015toggle

Suomi NPP VIIRS Day Night Band Visible Imagery (0.70µm) at 0727 and 0906 UTC 30 July 2015 (Click to enlarge)
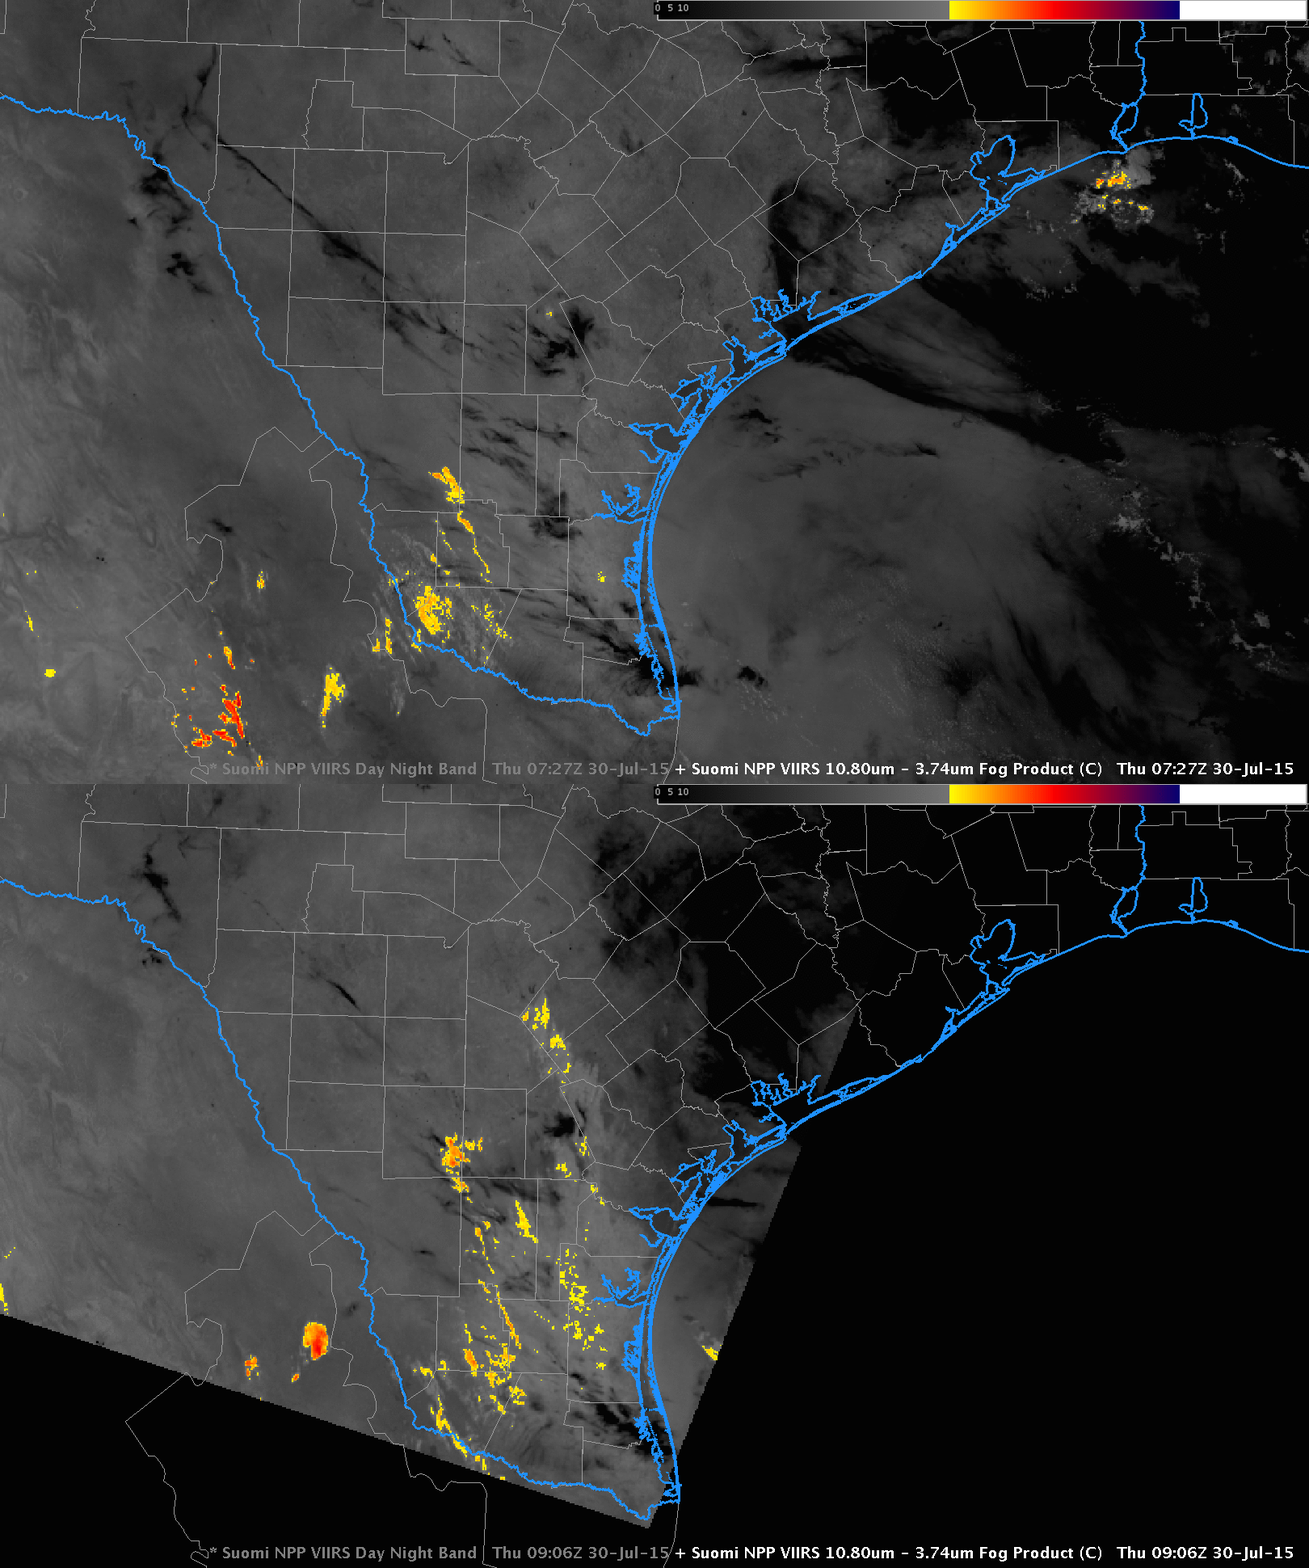
SNPP_BTD_0727_0906_30July2015toggle

Suomi NPP VIIRS Brightness Temperature Difference (11.45µm – 3.74µm) fields at 0727 and 0906 UTC 30 July 2015 (Click to enlarge)


=============================================================================

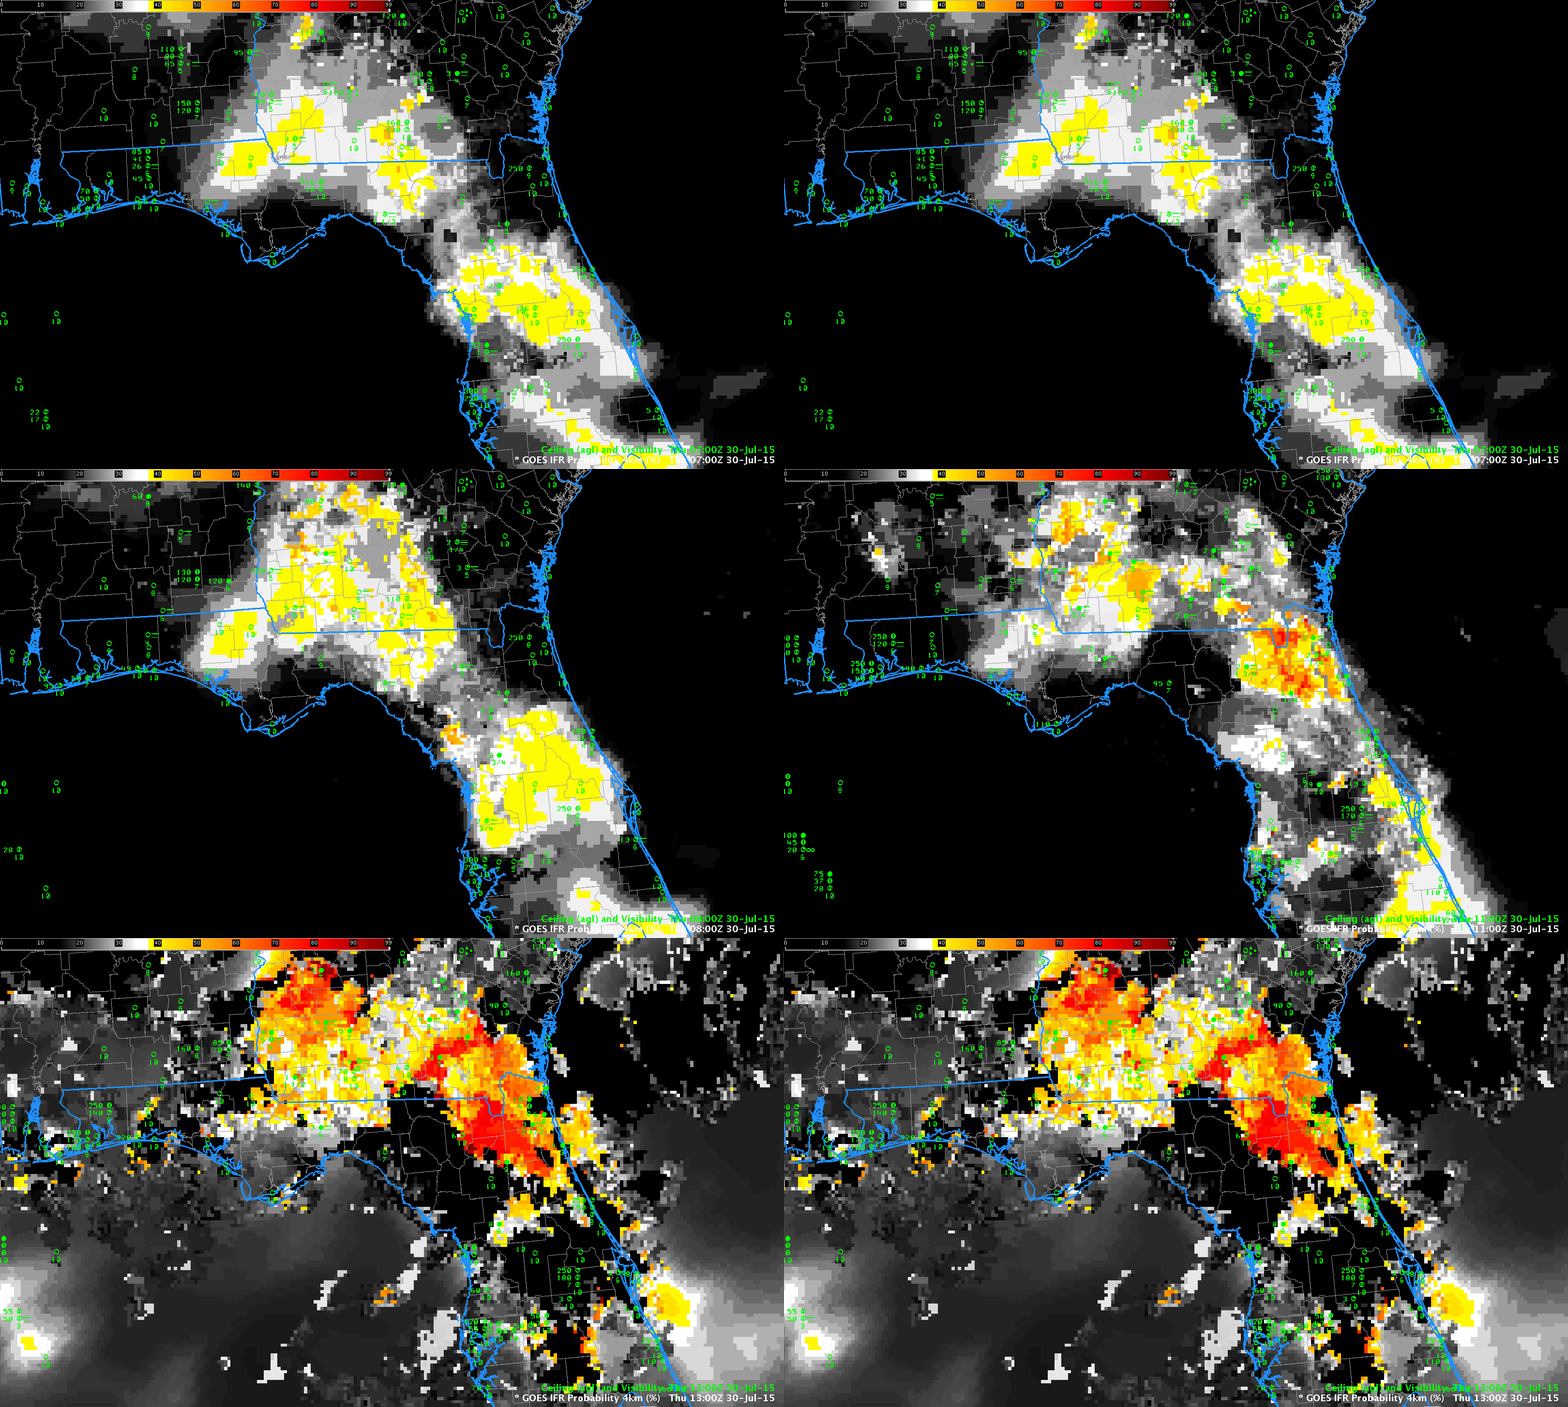
FLA_GOESIFR_0700_1300_30July2015anim

GOES-R IFR Probability Fields, hourly from 0700 through 1300 UTC, 30 July 2015 (Click to enlarge)

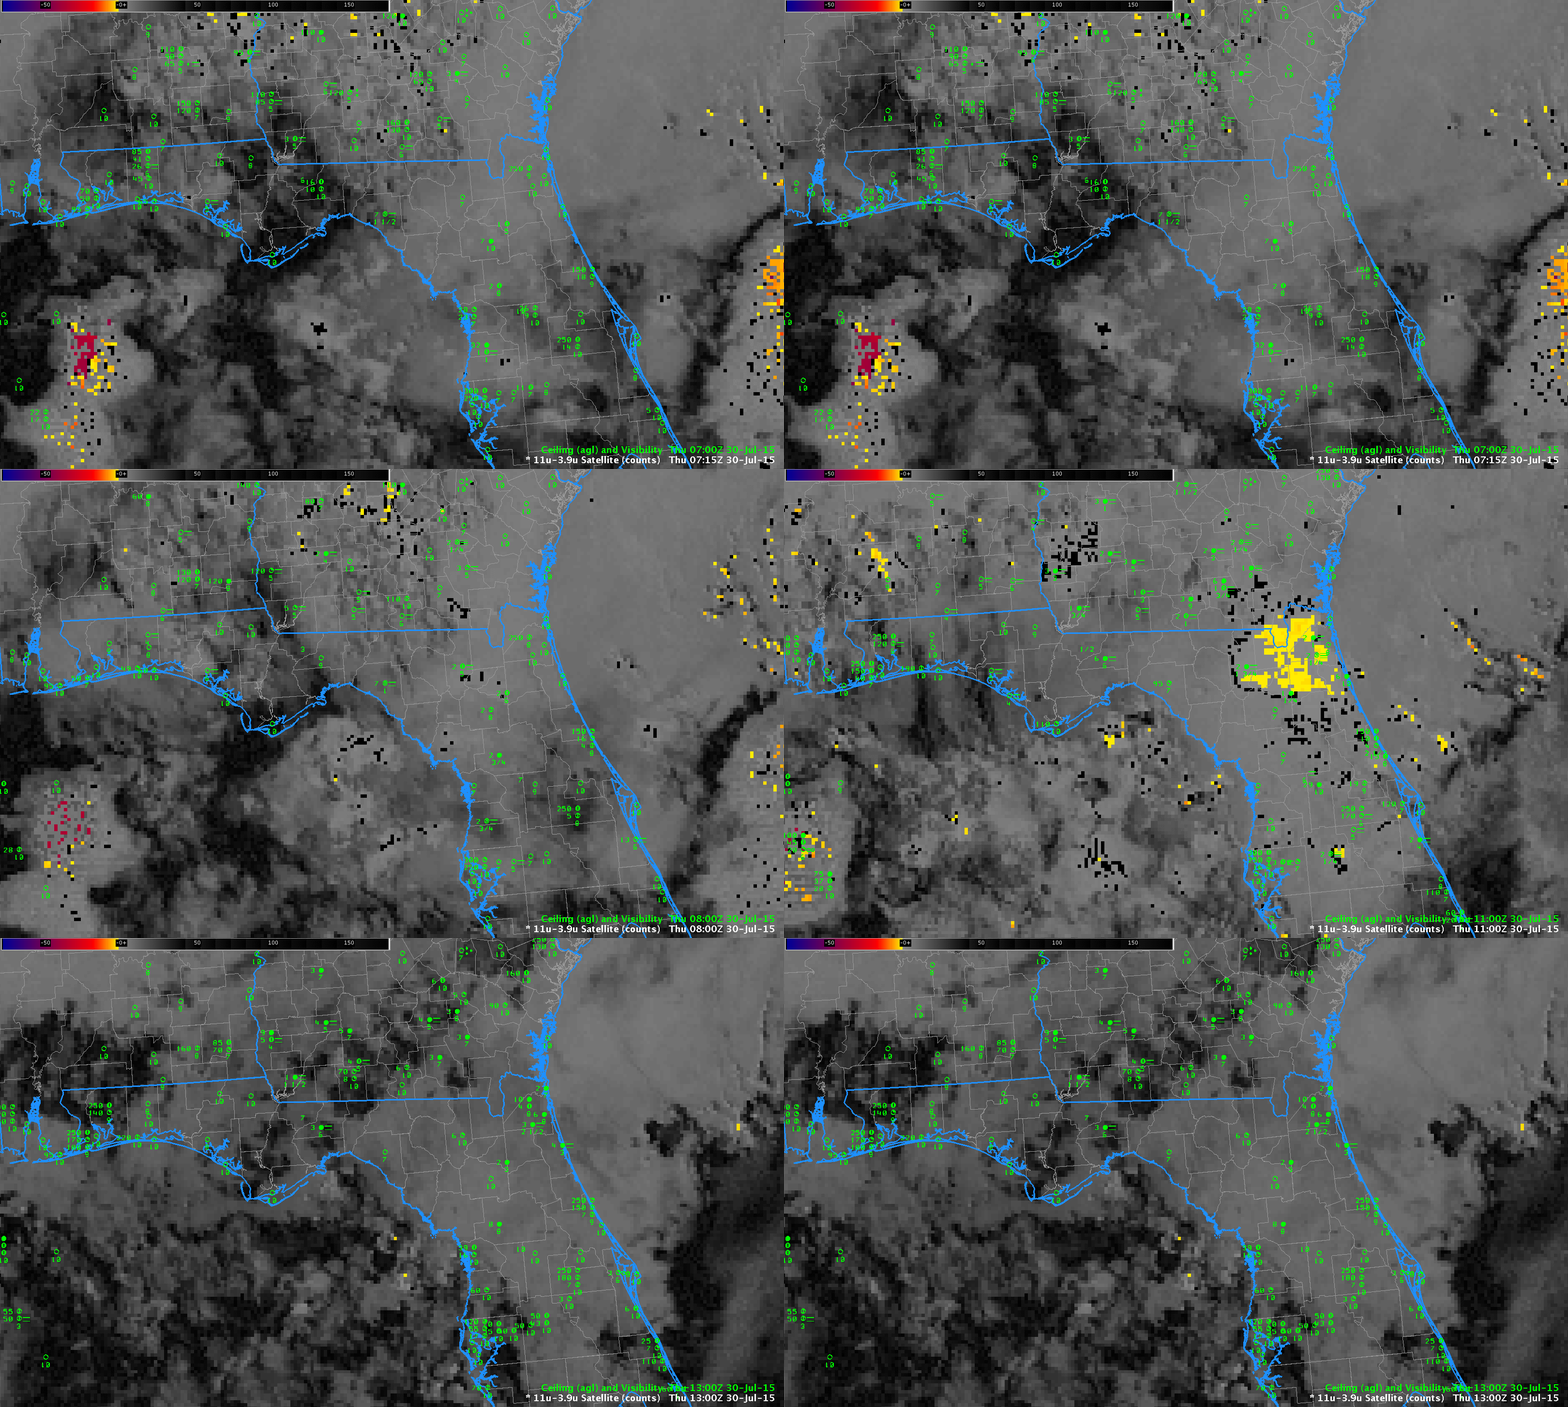
Northeast Florida also had reduced ceilings and visibilities on the morning of 30 July 2015. The animation above of GOES-R IFR Probabilities from 0700-1300 UTC (above) shows enhanced values in most of the inland northern Florida panhandle. The flat nature of the field suggests that higher clouds are preventing satellite detection of low clouds: predictors based on model fields only are being used to compute IFR Probabilities (that is, satellite predictors are not being used). The Brightness Temperature Difference animation for this event is below.

FLA_GOESBTD_0700_1300_30July2015anim

GOES-13 Brightness Temperature Difference (10.7µm – 3.9µm) Fields, hourly from 0700 through 1300 UTC, 30 July 2015 (Click to enlarge)

IFR Probability across the Midwest under cirrus

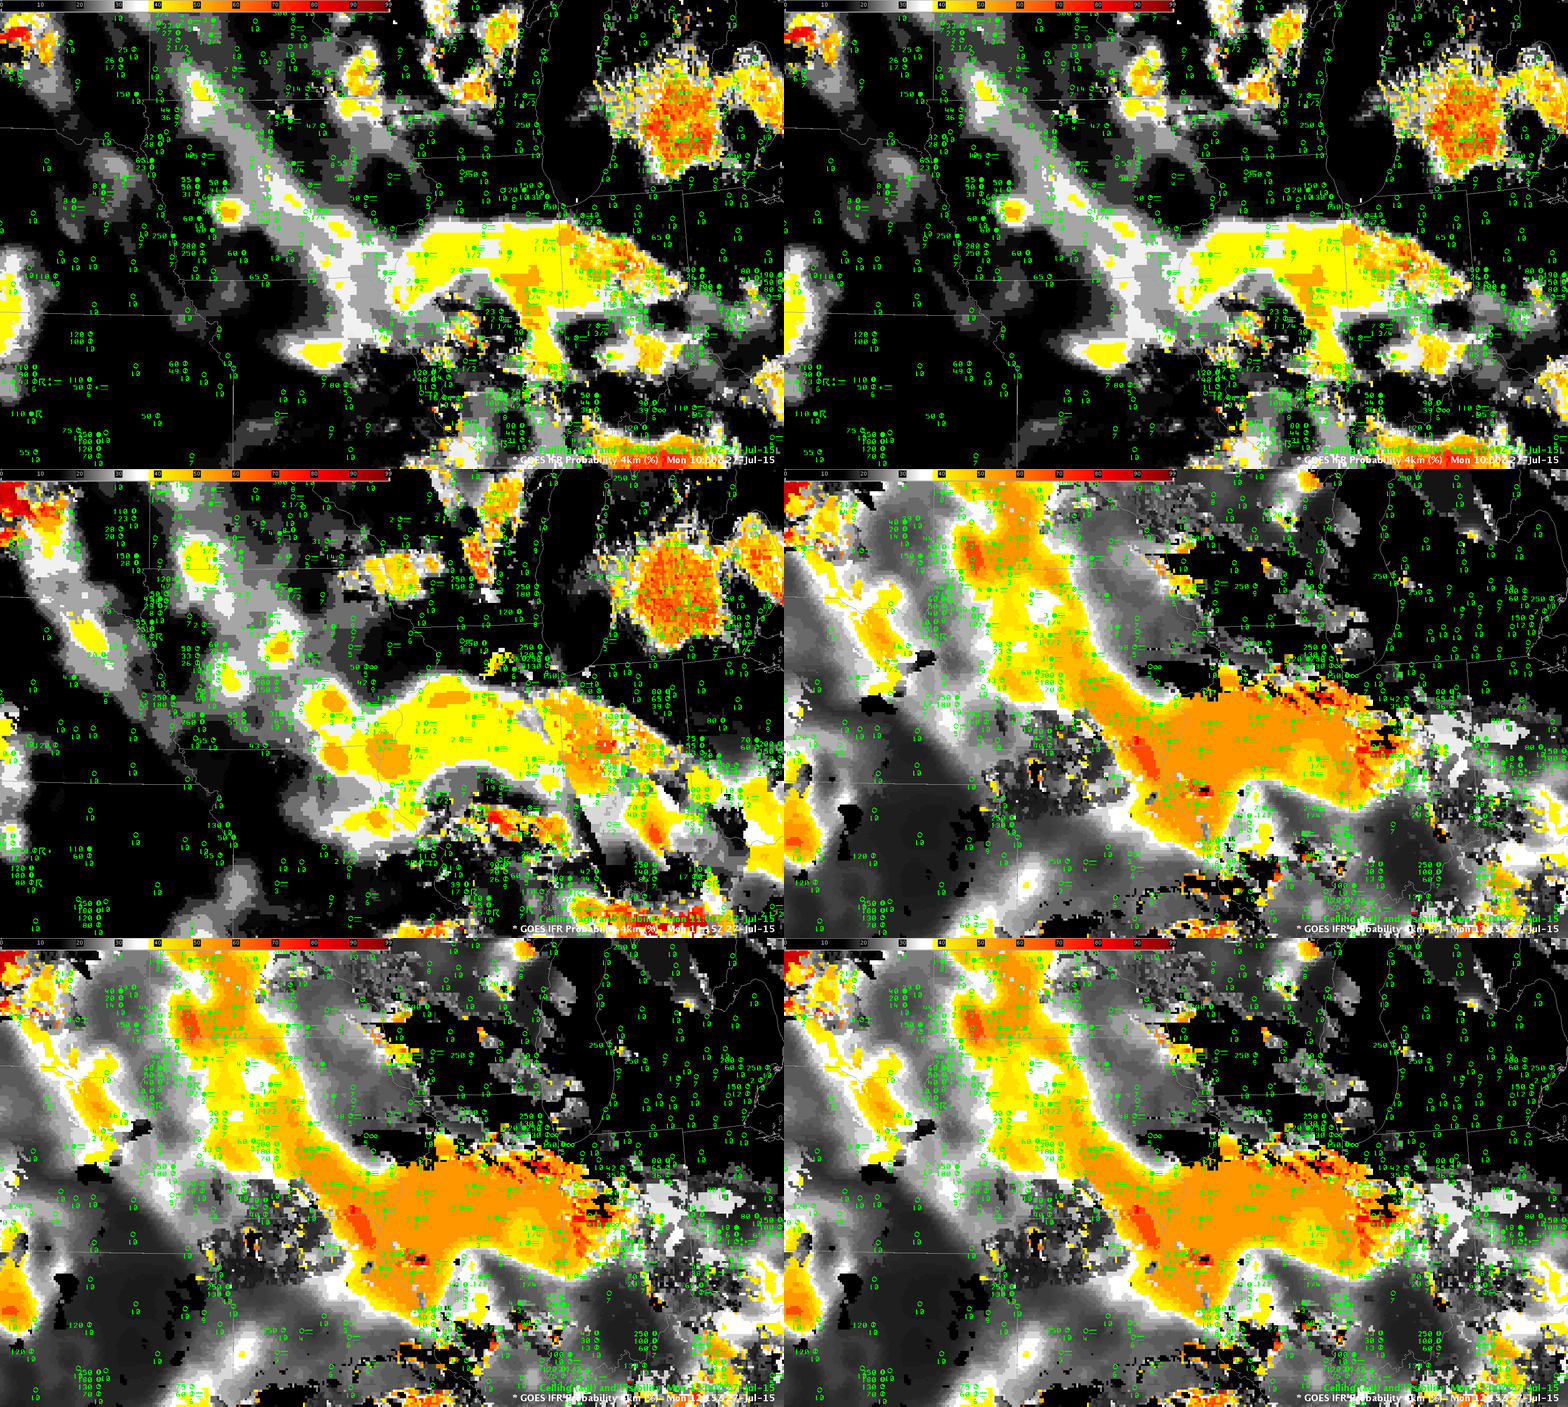
Midwest_1000_1215_27July2015_GOES13_IFRPROBanim

GOES-R IFR Probability fields, 1000, 1115 and 1215 UTC on July 27 2015 along with surface plots of ceilings and visibility (Click to enlarge)

Regions of dense fog developed over the Midwest during the morning of July 27 2015, and the GOES-R IFR Probability fields are shown above for 1000 through 1215 UTC. There is a good spatial relationship to where IFR Probabilities are large(ish) and where IFR conditions are present. This example is a good reminder that GOES-R IFR Probability fields should be interpreted with knowledge of other fields. On this day, an extensive cirrus shield (Click the link to view the Brightness Temperature Difference field at 1000 UTC) prevented GOES-13 from viewing low clouds over much of the midwest; thus, the IFR Probability field was driven mostly by model fields over Illinois and Iowa. This is why the field there is mostly uniform. When satellite data is not used in computing the probabilities (because of cirrus clouds), the magnitude of the IFR Probability is reduced.

Occasional glitches in GOES-R IFR Probability fields from GOES-West

GOES_R_IFR_GOESW_0715to0745_27July2015anim

GOES-R IFR Probability fields computed using GOES-15 are periodically — once or twice per night — showing unusual behavior, as documented in the short animation above. The 0730 UTC shows a greatly expanded region of modest IFR Probability values compared to 0715 UTC; at 0745 UTC, fields return to ‘normal’. This aberrant behavior does not occur during the day, nor does it occur every night, nor at specific times. This intermittent type of error makes it difficult to determine and exact cause, but it appears to be related to GOES-15 3.9 µm emissivity. That field is missing when the erroneous fields are produced. This could be an issue of timing — that is, the algorithm requests the field before it is created.

CIMSS scientists are actively working to determine the underlying cause of this error.


======================== Added August 4 2015 =======================

Tweaks to the processing flow at CIMSS at the end of July appear to have fixed this problem, as it has not occurred in August.

Fog over Iowa

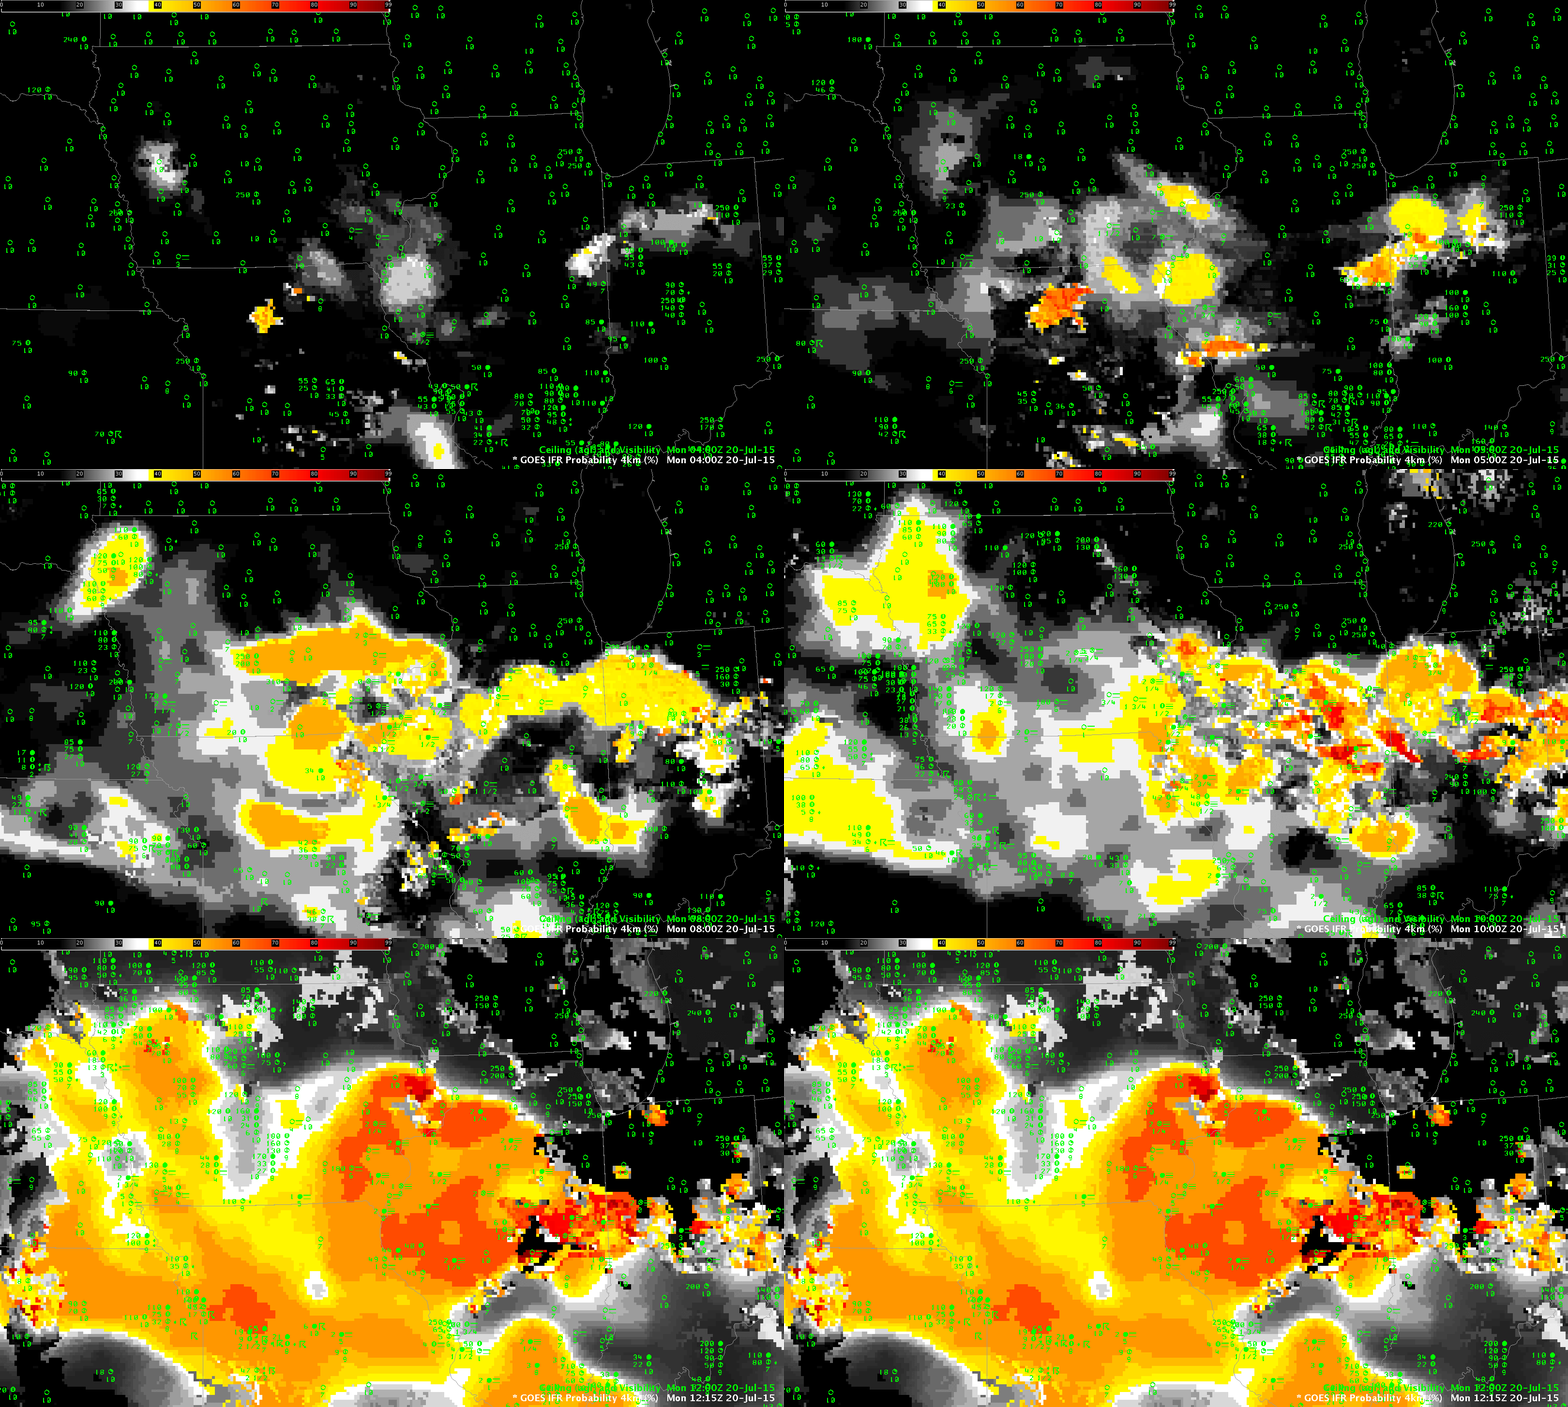
GOESIFR_20July2015_0400_1215anim

GOES-R IFR Probability fields, 0400-1215 UTC, 20 July 2015 (Click to enlarge)

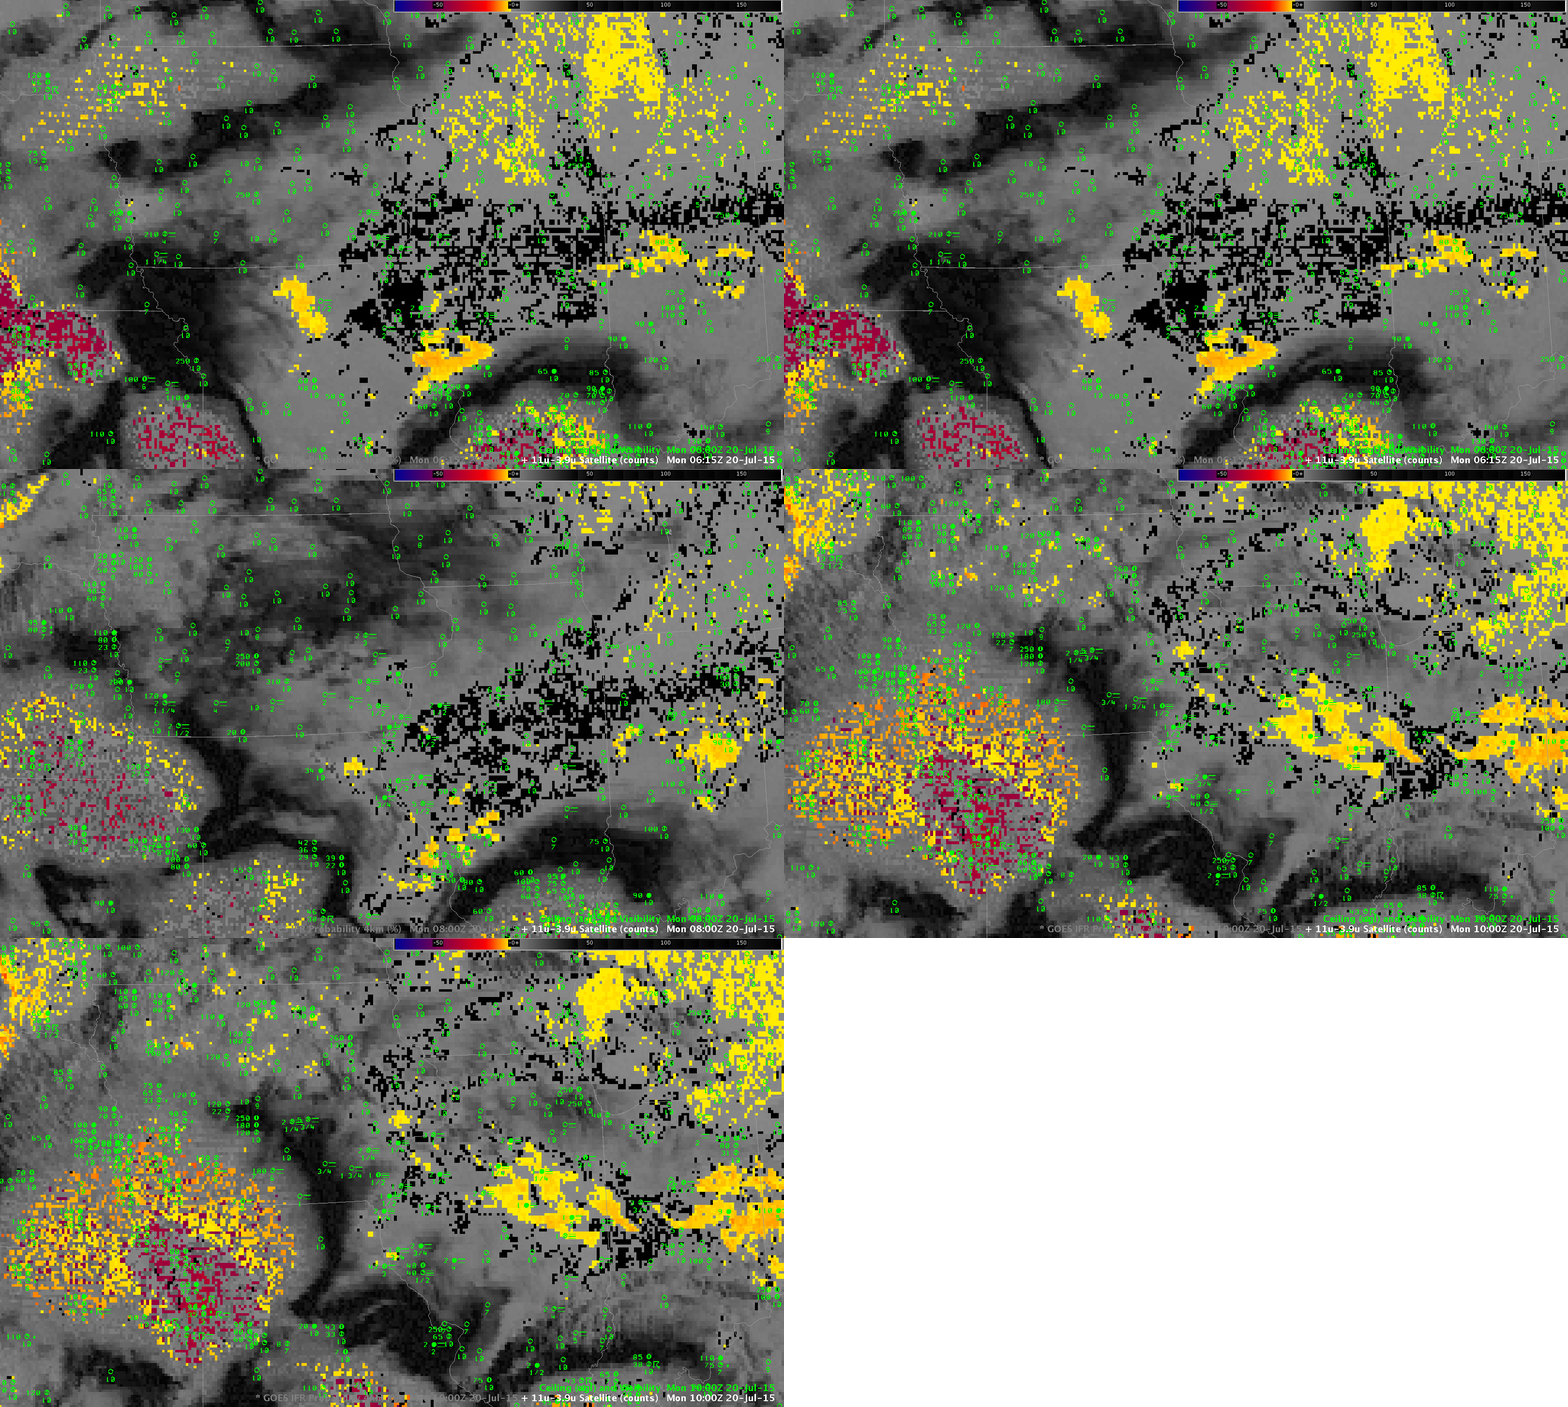
Dense fog developed over portions of eastern Iowa early in the morning of 20 July 2015. The animation above shows the hourly evolution of the GOES-R IFR Probability fields computed using satellite data from GOES-13 and Rapid Refresh model output.  The flat nature of the fields in the animation above suggests the satellite data cannot view the near-surface because of higher level clouds;  Brightness Temperature Difference fields, below, from 0615, 0800 and 1000 UTC confirm that hypothesis.  This was a case where inclusion of the Rapid Refresh information was vital for the IFR Probability field to outline correctly the region of visibility restrictions due to fog. Note that the last GOES-based GOES-R IFR Probability image, at 1215 UTC, above, after sunrise, shows a general increase in values over the 1100 UTC image (just before sunrise). Daytime predictors (used here at 1215 UTC) result in a higher probability of IFR conditions that nighttime predictors (used here at 1100 UTC) in part because of the use of visible data for cloud-clearing.

GOES13_BTD_20July2015_0615_0800_1000step

GOES-13 Brightness Temperature Difference fields (10.7µm – 3.9µm) at 0615, 0800 and 1000 UTC on 20 July 2015 (Click to enlarge)

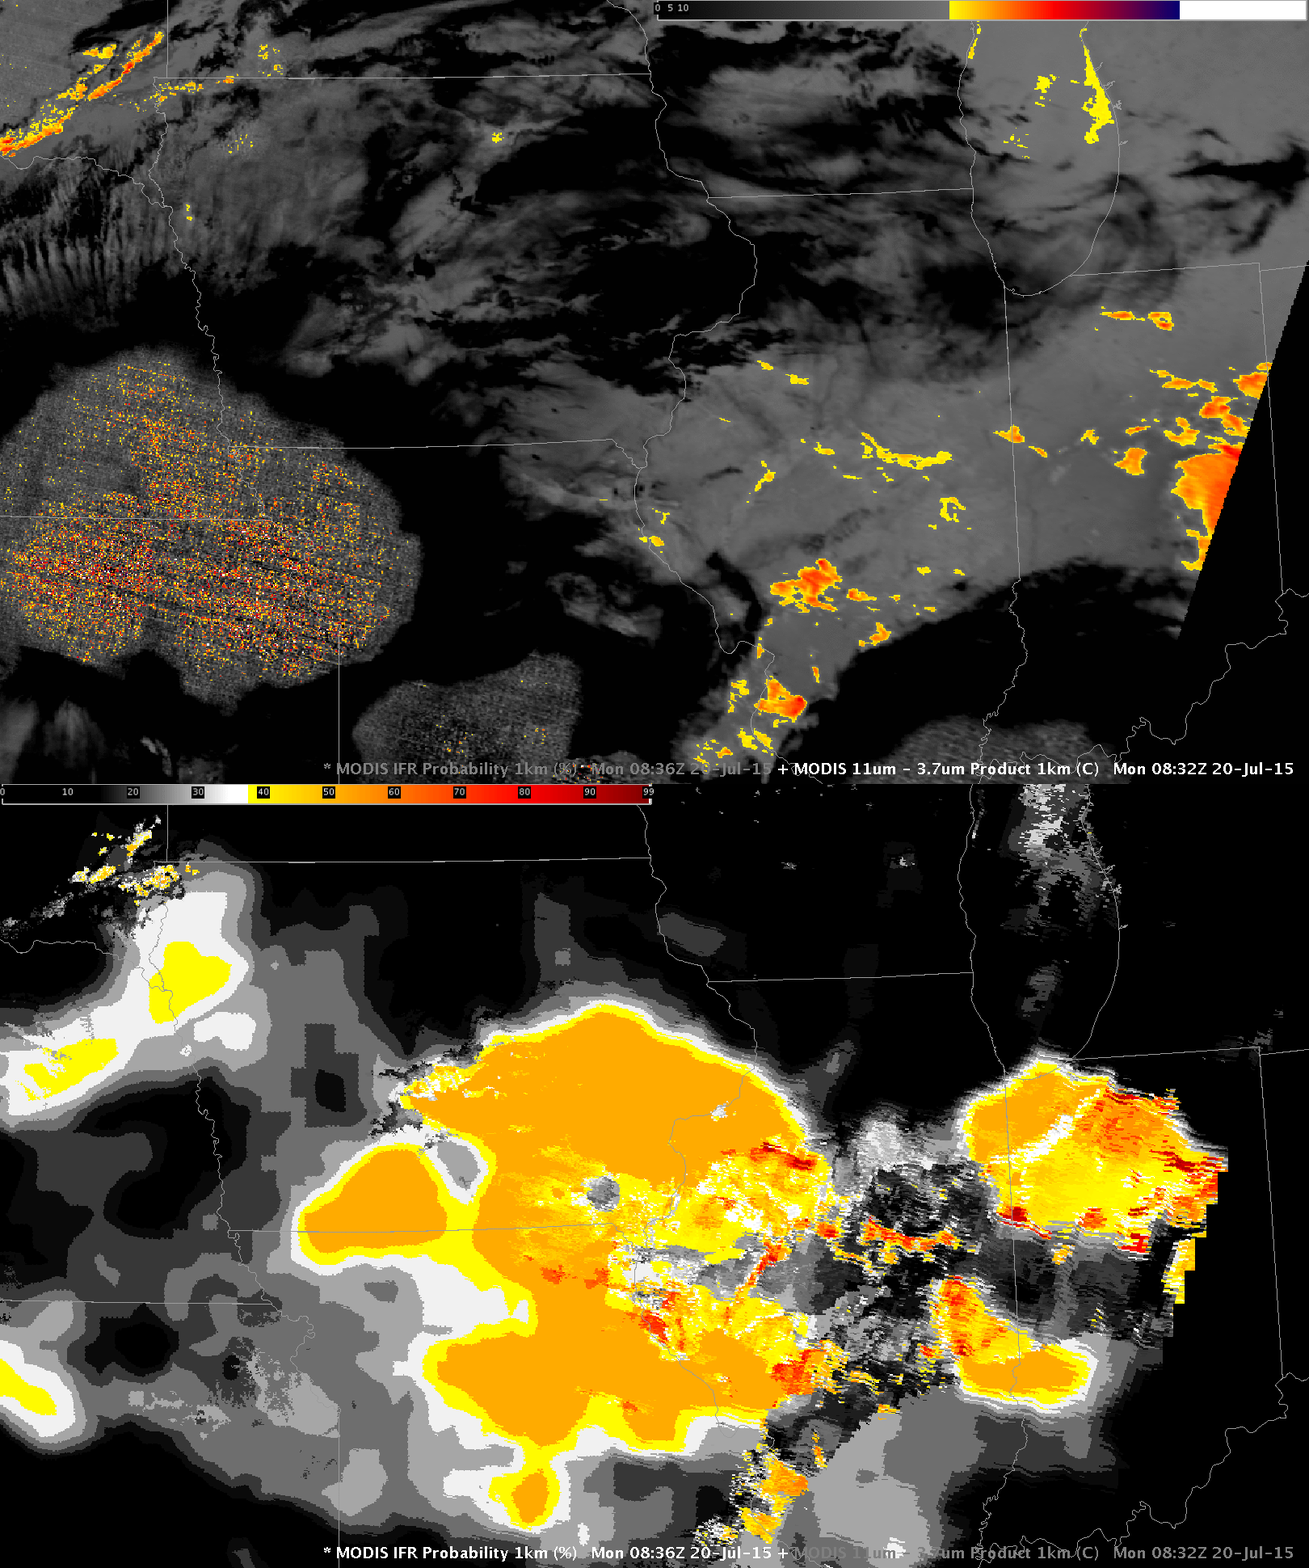
An Aqua overpass provided MODIS information at ~0830 UTC, and toggle between the brightness temperature difference field (11.0µm – 3.7µm) and MODIS-based IFR Probabilities, below, shows MODIS-based IFR Probabilities were enhanced over southern and eastern Iowa in a region where the brightness temperature difference field gave a signal consistent with mid- and high-level clouds.

MODIS_BTD_IFR_0836_20july2015toggle

Aqua MODIS Brightness Temperature Difference (11.0µm – 3.7µm) and MODIS-based GOES-R IFR Probabilities, ~0830 UTC on 20 July 2015 (Click to enlarge)

Using MODIS and GOES IFR Probabilities to gauge fog motion in the Pacific Northwest

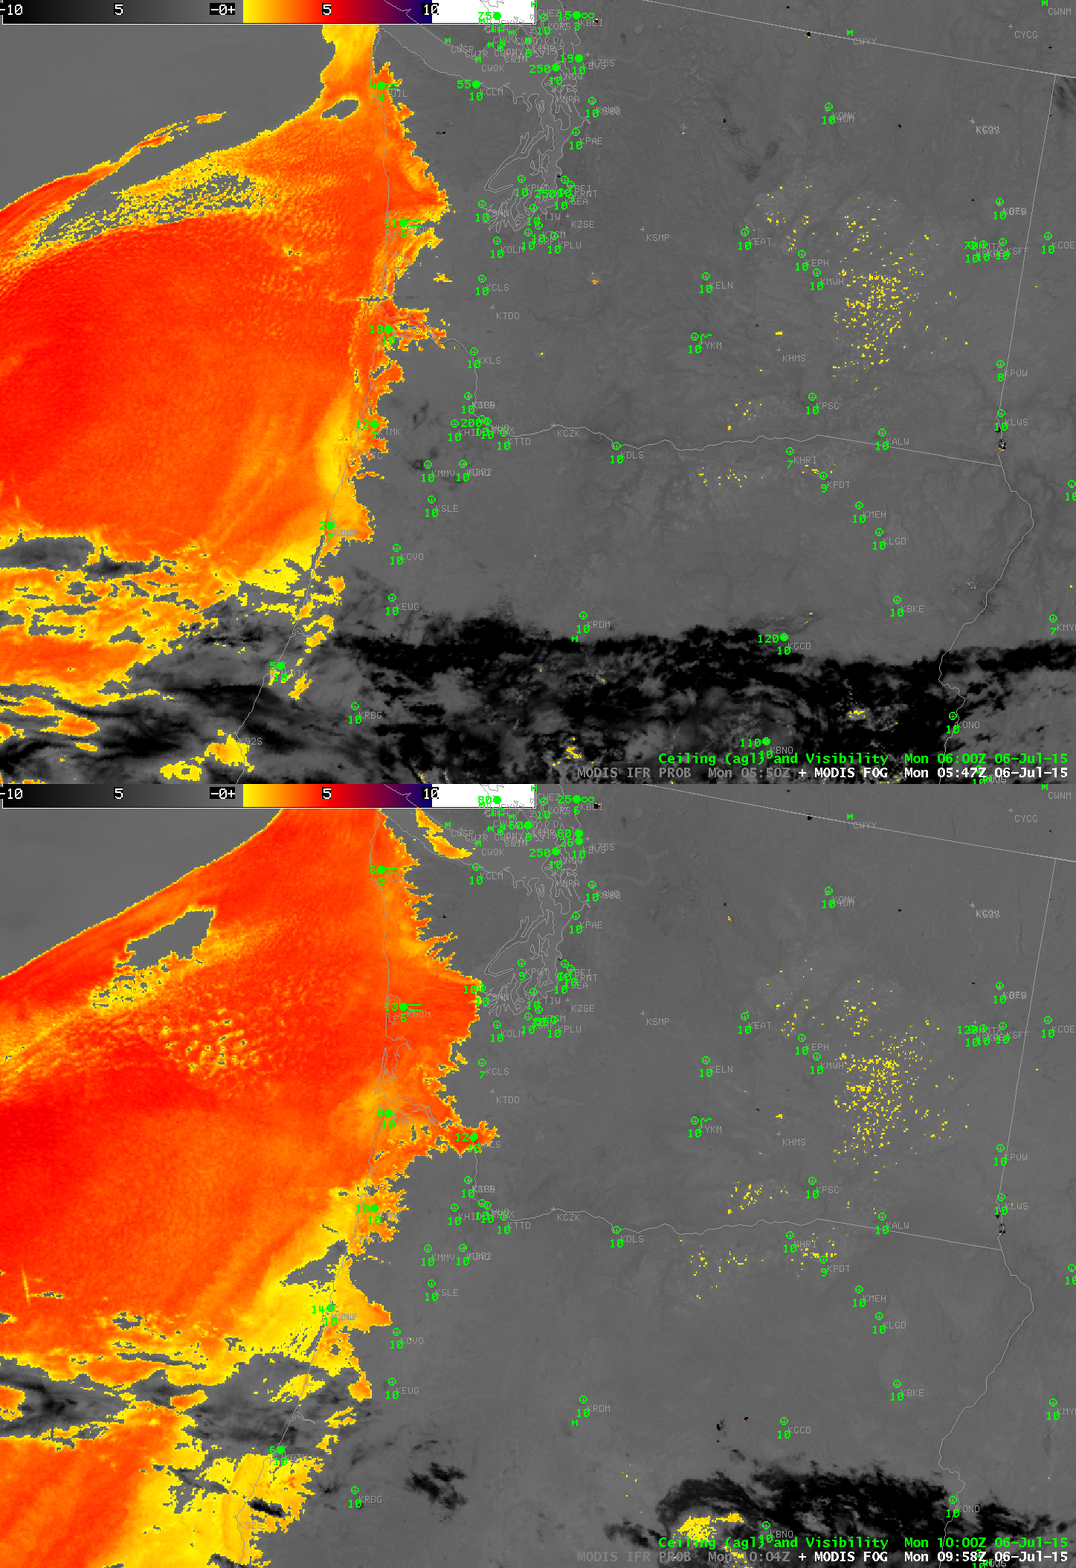
MODIS_FOG_20150706_0547_0958toggle

MODIS-based brightness temperature difference fields, ~0550 and ~1000 UTC on 6 July (Click to enlarge)

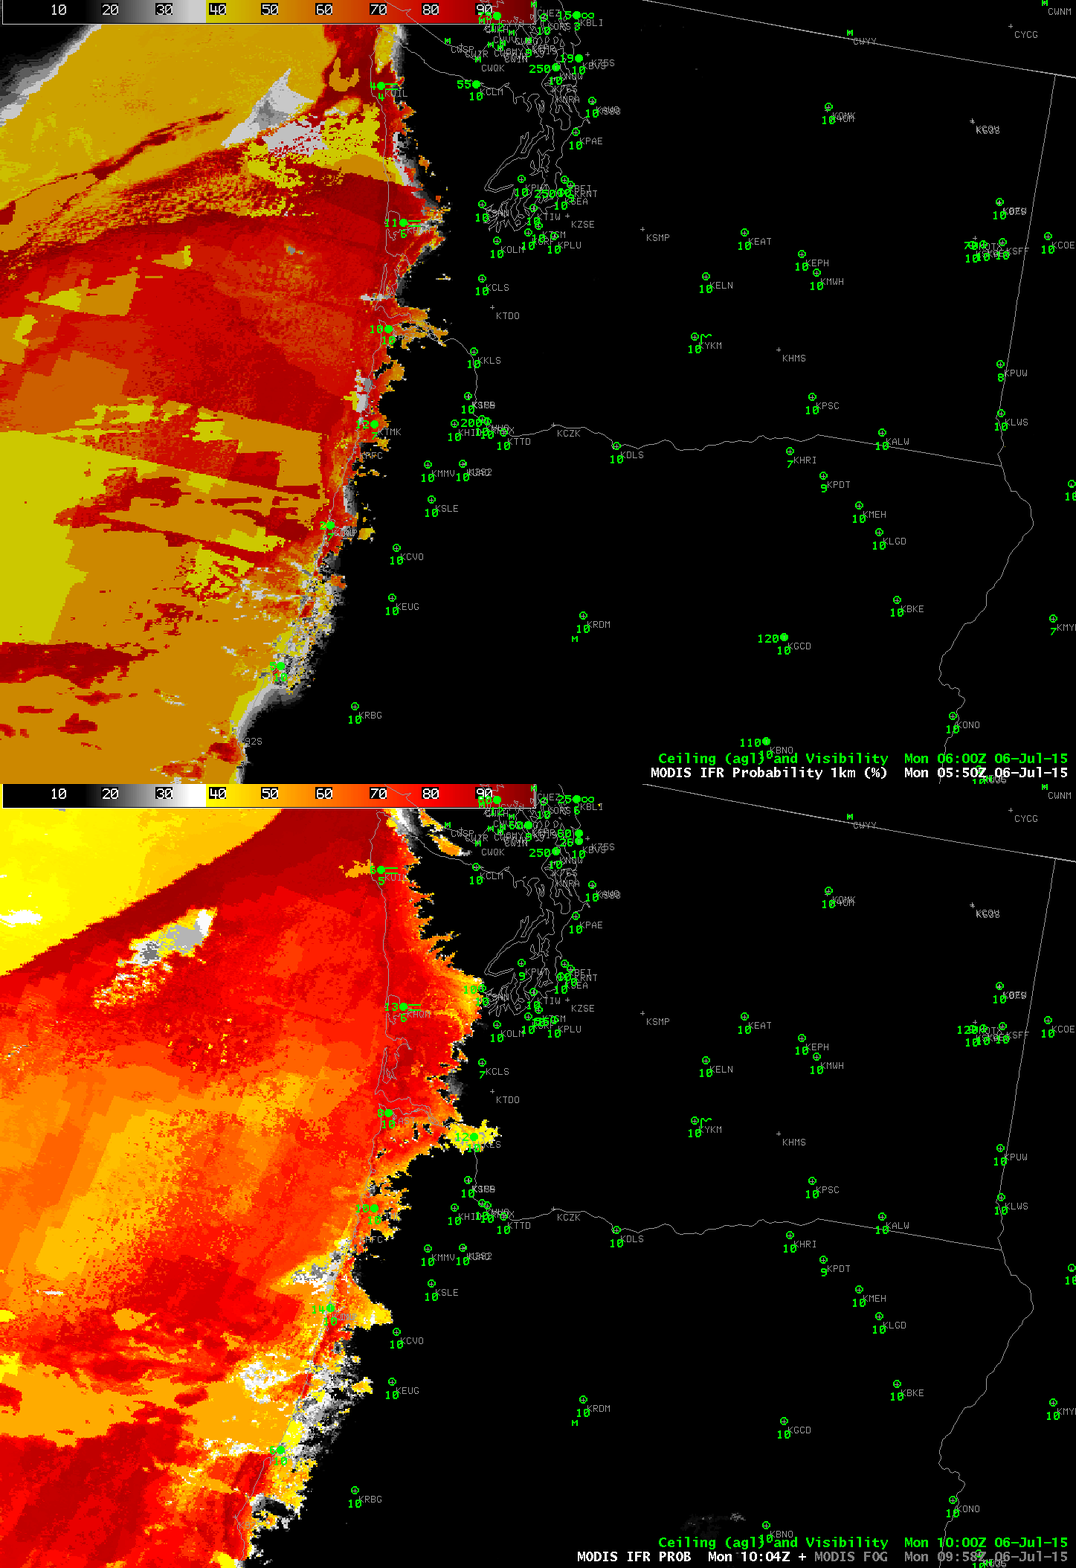
MODIS-based Brightness Temperature Difference fields, above, from 0547 (Terra) and 0958 (Aqua) detect a large area of marine stratus over the Pacific Ocean that is penetrating inland up river valleys along the coasts of Washington and Oregon.  Dark reatures that are consistent with higher clouds are also present over southern Oregon. GOES-R IFR Probability fields can be computed from MODIS data, and those fields (below) show high probabilities along the coast, in regions where IFR or near-IFR conditions are observed. Aspects of the GOES-R IFR Probability field deserve comment. Where high clouds are present in the MODIS data, GOES-R IFR Probabilities are largely controlled by model-based fields that are typically smooth. This is the case over the northwest corner of the IFR Probability field, for example, and also off the southern Oregon coast at ~0550 UTC. The blocky nature of the IFR Probability fields off the central Oregon coast at ~0550 UTC is likely related to model relative humidity fields that show saturation both near the surface and aloft.

MODIS_IFR_PROB_20150706_0550_1004toggle

MODIS-based GOES-R IFR Probabilities, ~0550 and ~1000 UTC on 6 July 2015 (Click to enlarge)

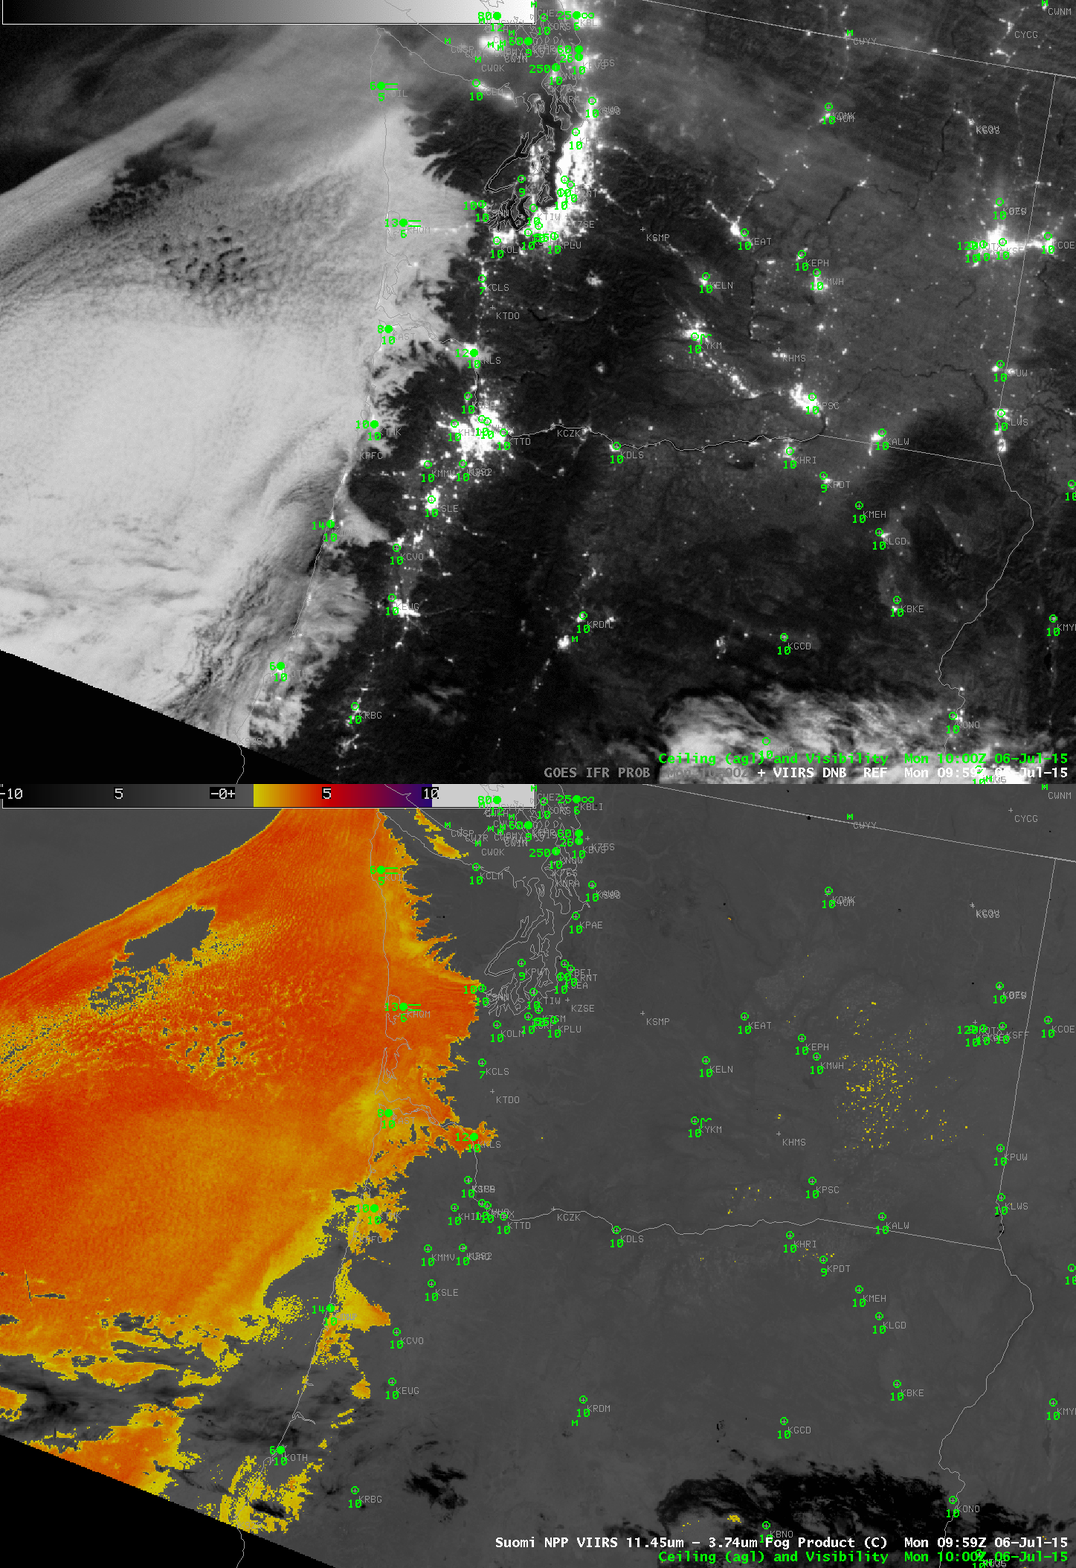
Suomi NPP Day Night Band visible imagery had ample illumination early on 6 July with a waning gibbous moon. Imagery below from 1000 UTC (very close to the Aqua pass) also shows thin tendrils of fog moving up river valleys. The VIIRS instrument that provides the Day Night imagery is only on one satellite, however, (compared to MODIS on both Aqua and Terra) so such views are infrequent.

VIIRS_DNB_FOG_20150706_0959toggle

Suomi NPP Day Night Band Visible imagery and Brightness Temperature Difference fields at 0959 UTC, 6 July 2015 (Click to enlarge)

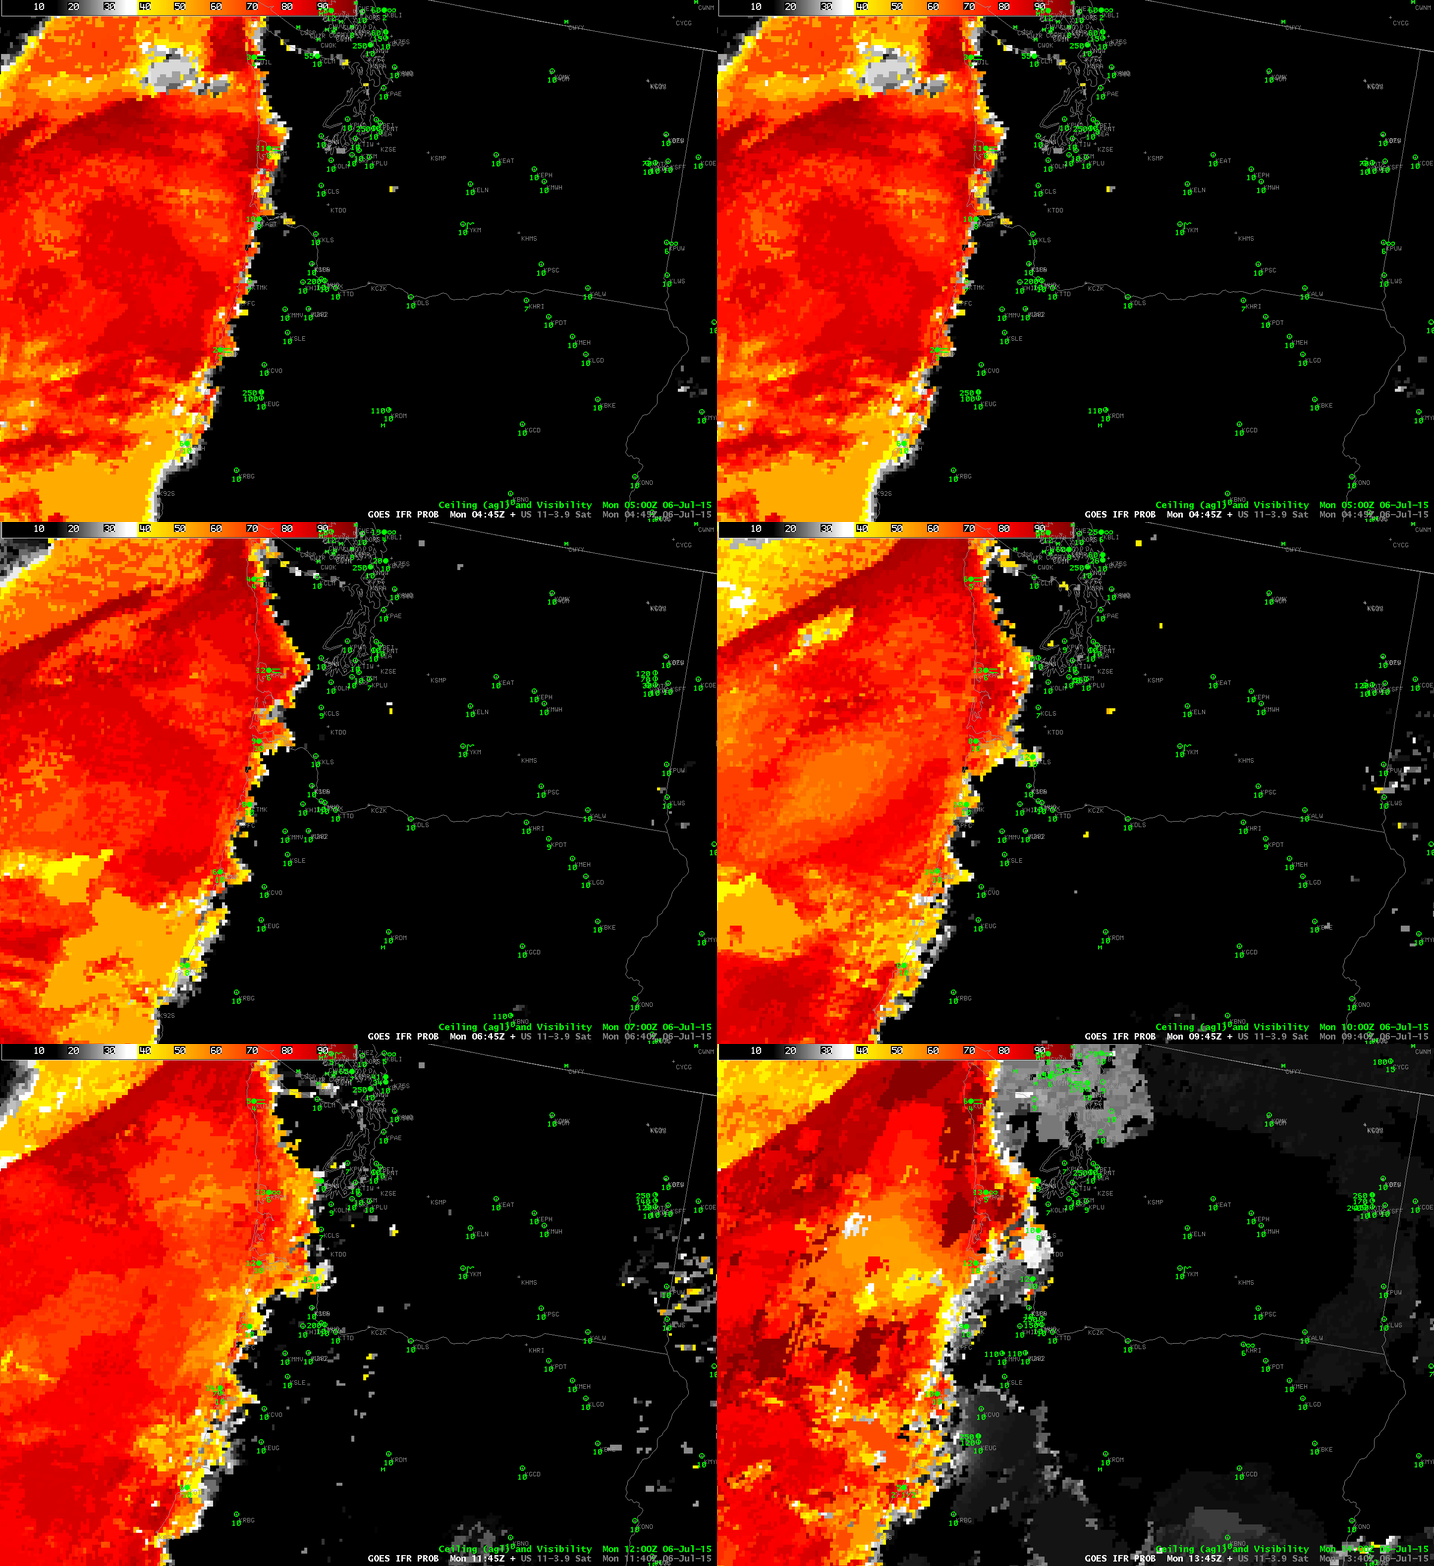
MODIS and Suomi NPP imagery suggest fog is penetrating preferentially into river valleys along the west coast. This should color the interpretation of GOES-based GOES-R IFR Probabilities. GOES-15 lacks the horizontal resolution to resolve fully most river valleys (Rapid Refresh data, similarly, does not resolve small valleys); however, GOES-15 does have excellent temporal resolution, and combining that with the intermittent information from polar orbiters such as Terra, Aqua and Suomi-NPP provides a fuller picture of the evolution of near-surface IFR conditions. The animation of GOES-R IFR Probabilities from GOES-15 is shown below.

GOES_IFR_PROB_20150706_0445_1345anim

GOES-15 based GOES-R IFR Probabilities, 0445-1345 UTC, 6 July 2015 (Click to enlarge)

Fog Detection at Sunrise

US_11-3.9_Sat_20150703_1230

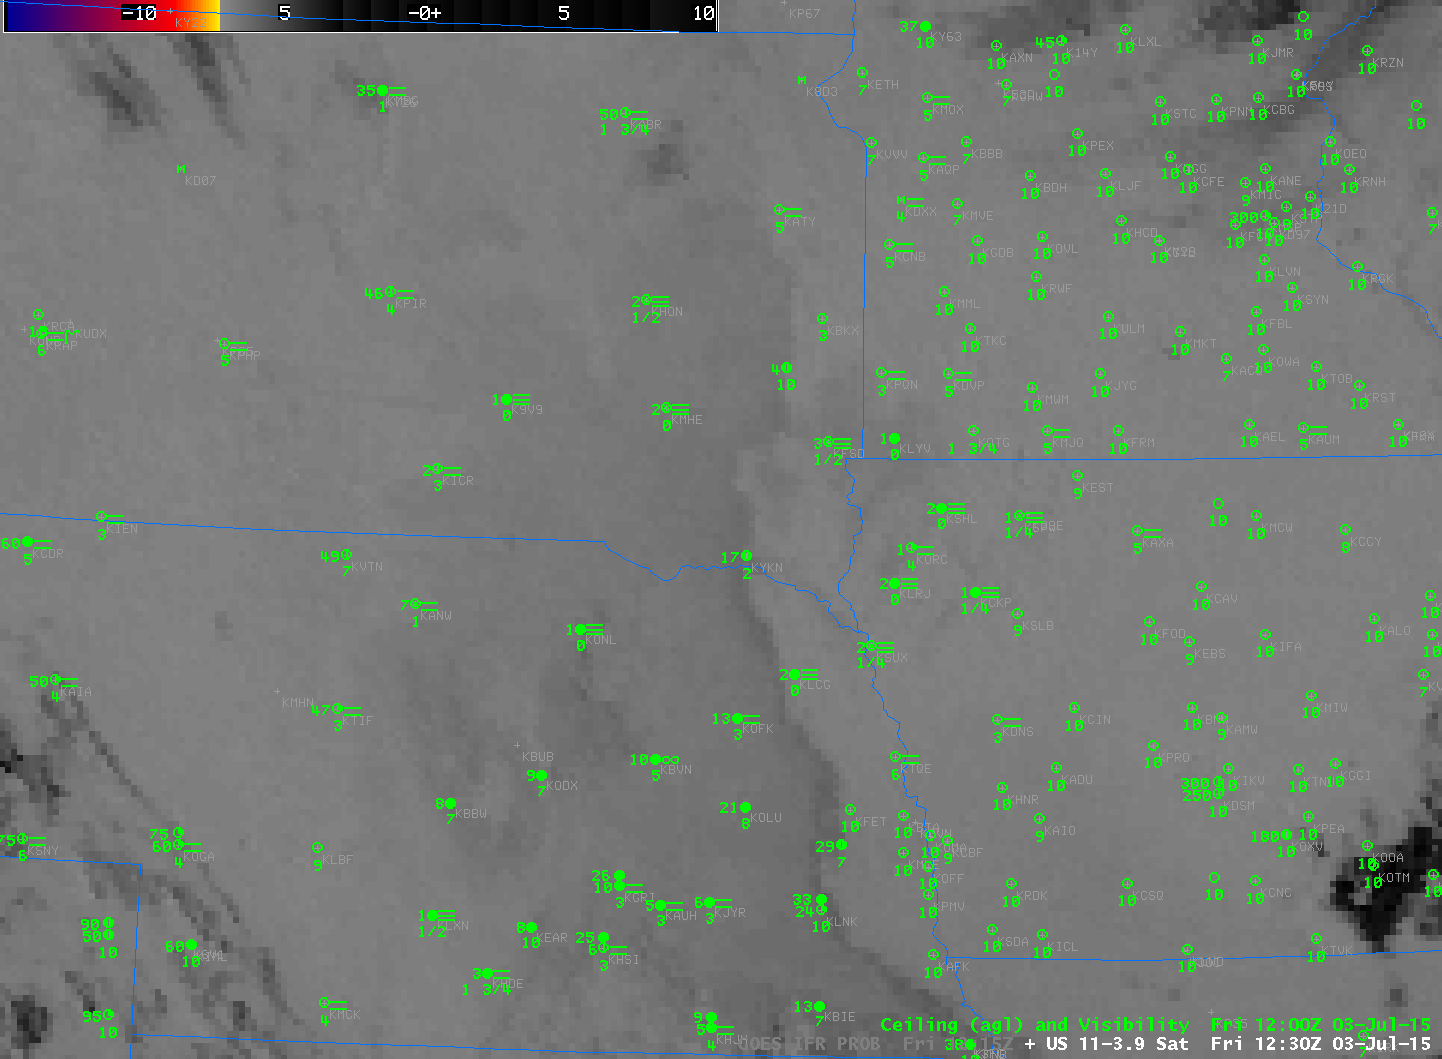
Brightness Temperature Difference (10.7 µm – 3.9 µm) from GOES-13 at 1230 UTC, along with 1200 UTC Ceilings and Visibilities (Click to enlarge)

The Brightness Temperature Difference field is commonly used to detect low clouds in the atmosphere and to infer the presence of fog. At sunrise (and sunset), however, when the amount of reflected solar radiance with a wavelength of 3.9 µm is changing rapidly, features can be lost. For example, can you detect where the brightness temperature difference fields above relate to the observations of dense fog (Dense Fog Advisories were hoisted).

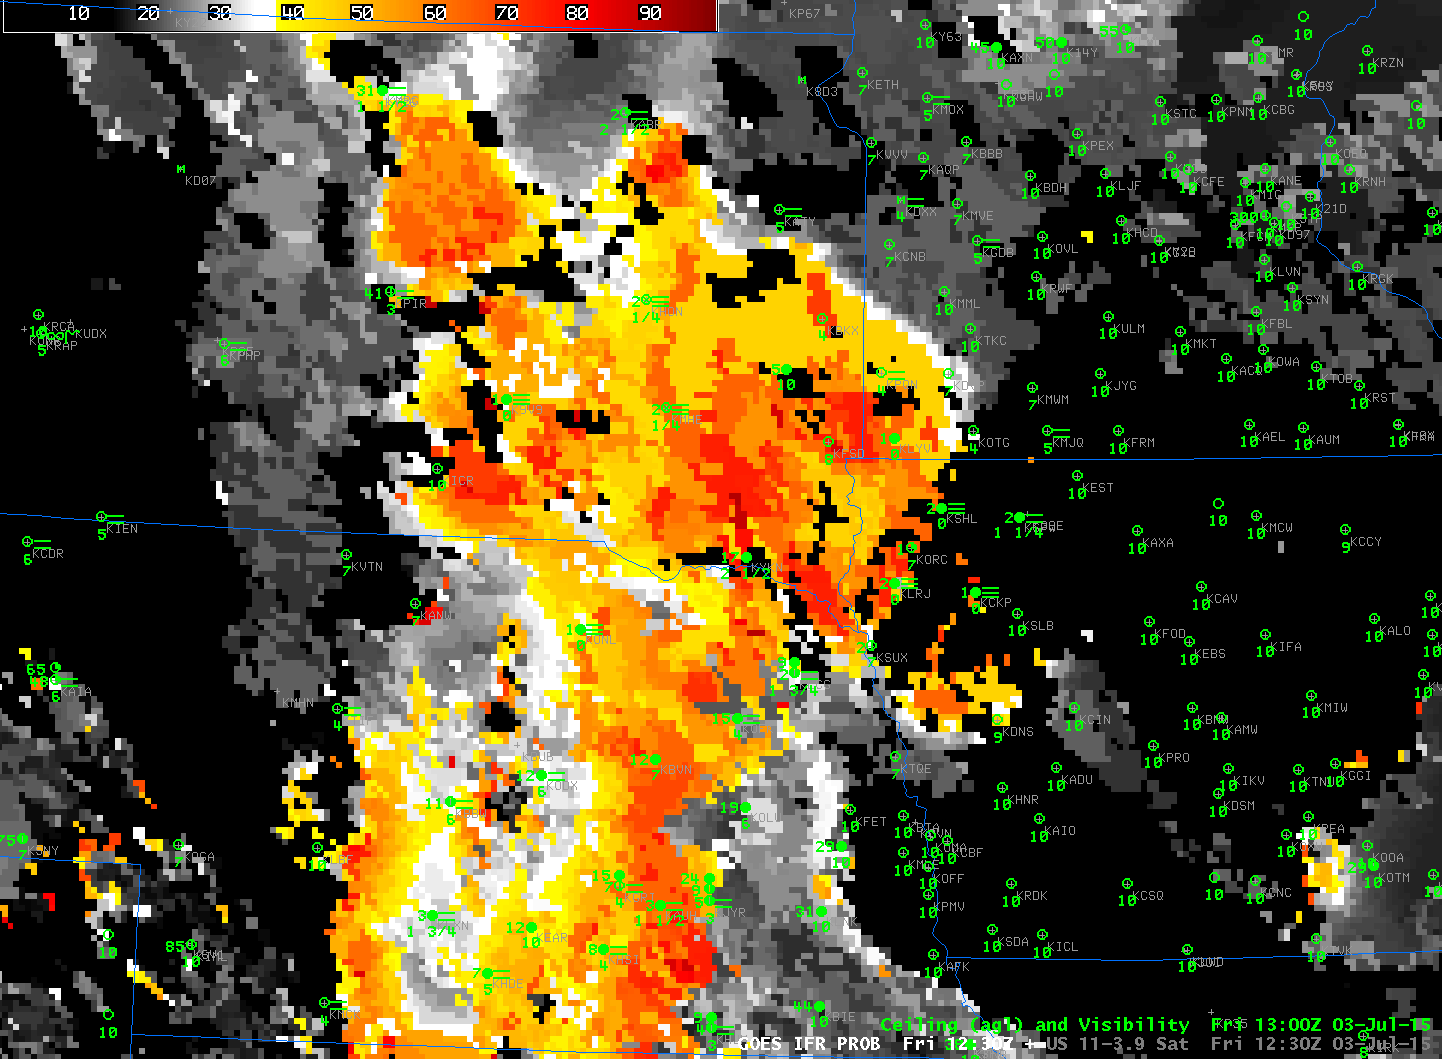
GOES-R IFR Probabilities are able to highlight regions of low clouds and fog through sunrise. The IFR Probability field for 1230 UTC on 3 July is shown below. It does a far better job of outlining the region of low clouds and fog.

GOES_IFR_PROB_20150703_1230

GOES-R IFR Probabilities computed from GOES-13 and Rapid Refresh model output, 1230 UTC 3 July 2015 (Click to enlarge)

Animations of the fields, of course, play to the strength of GOES-13 temporal resolution and aid detection. GOES-R IFR Probabilities and Brightness Temperature Difference Field animations are available.

MODIS-based vs. GOES-based IFR Probabilities

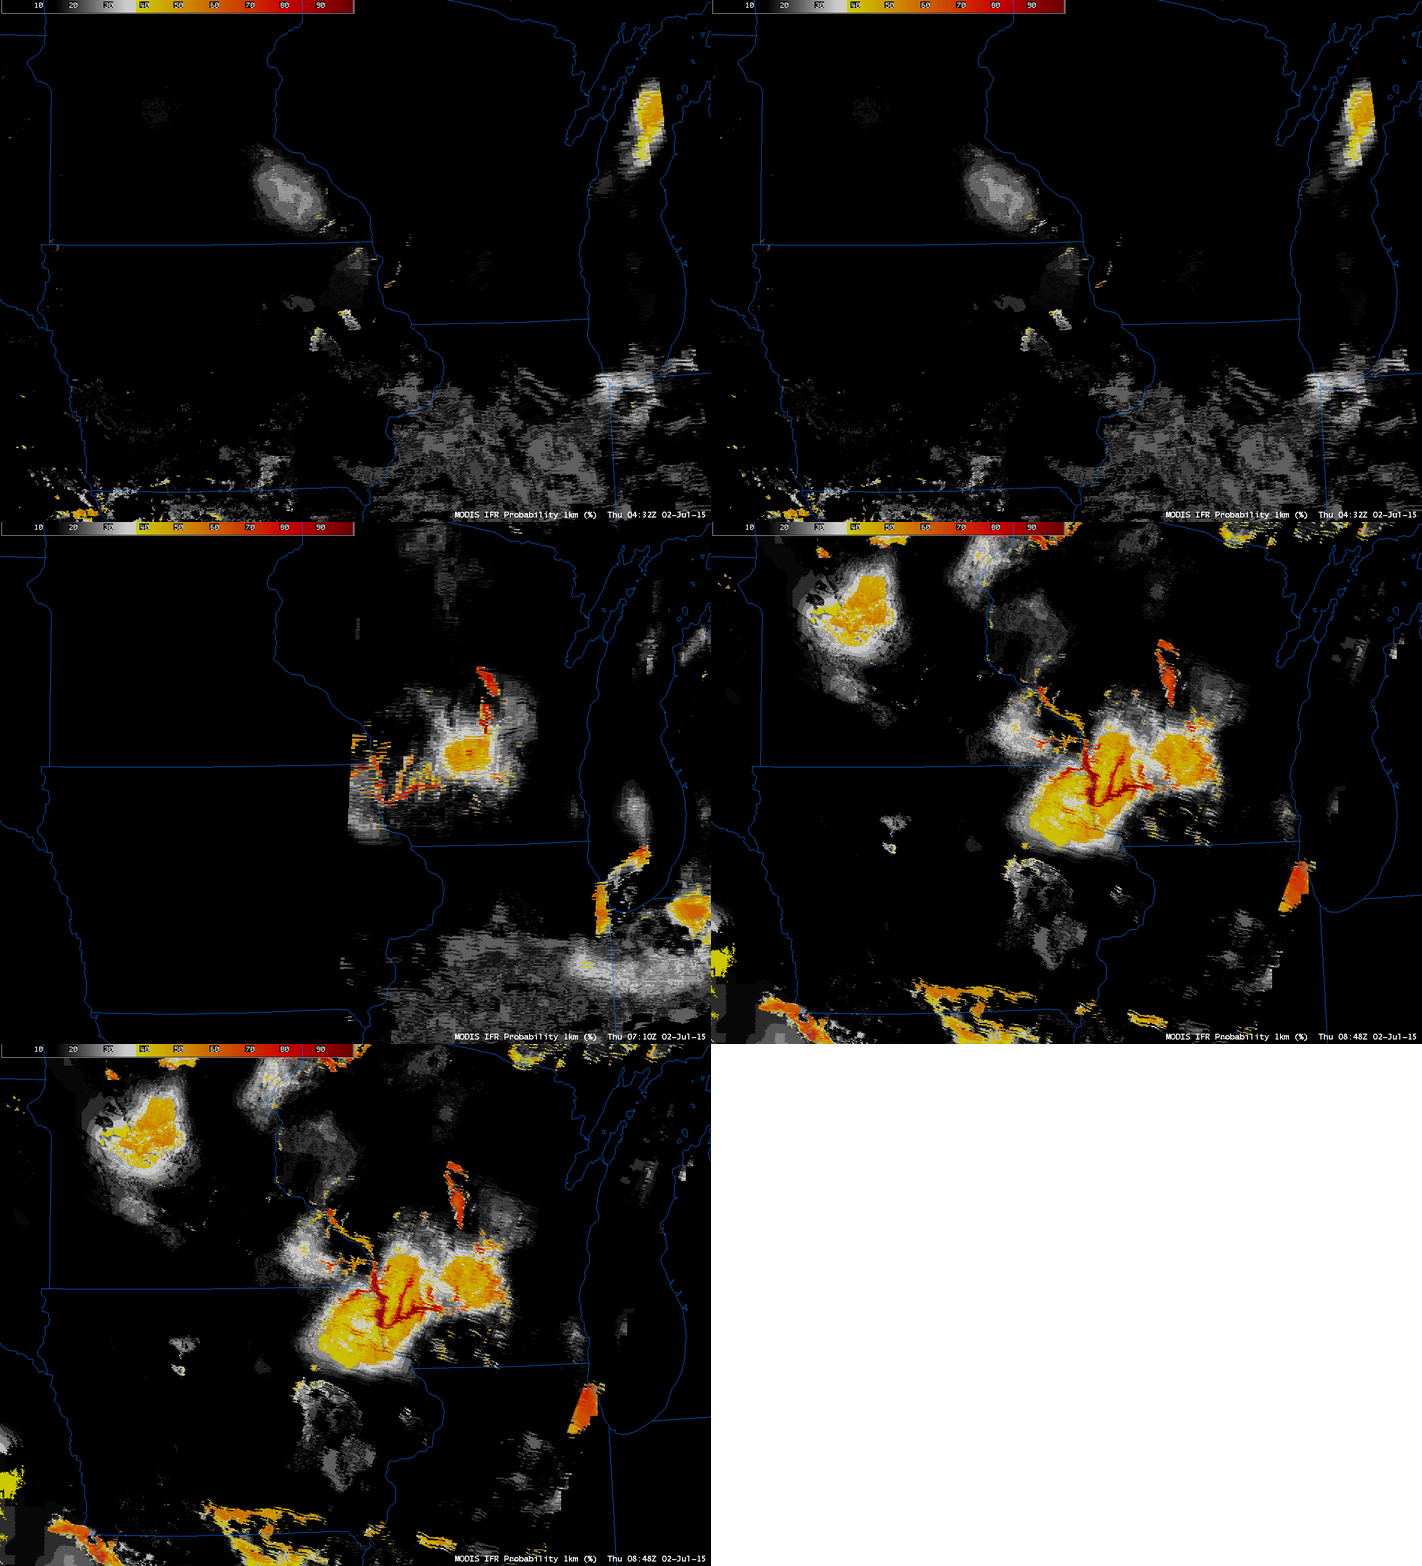
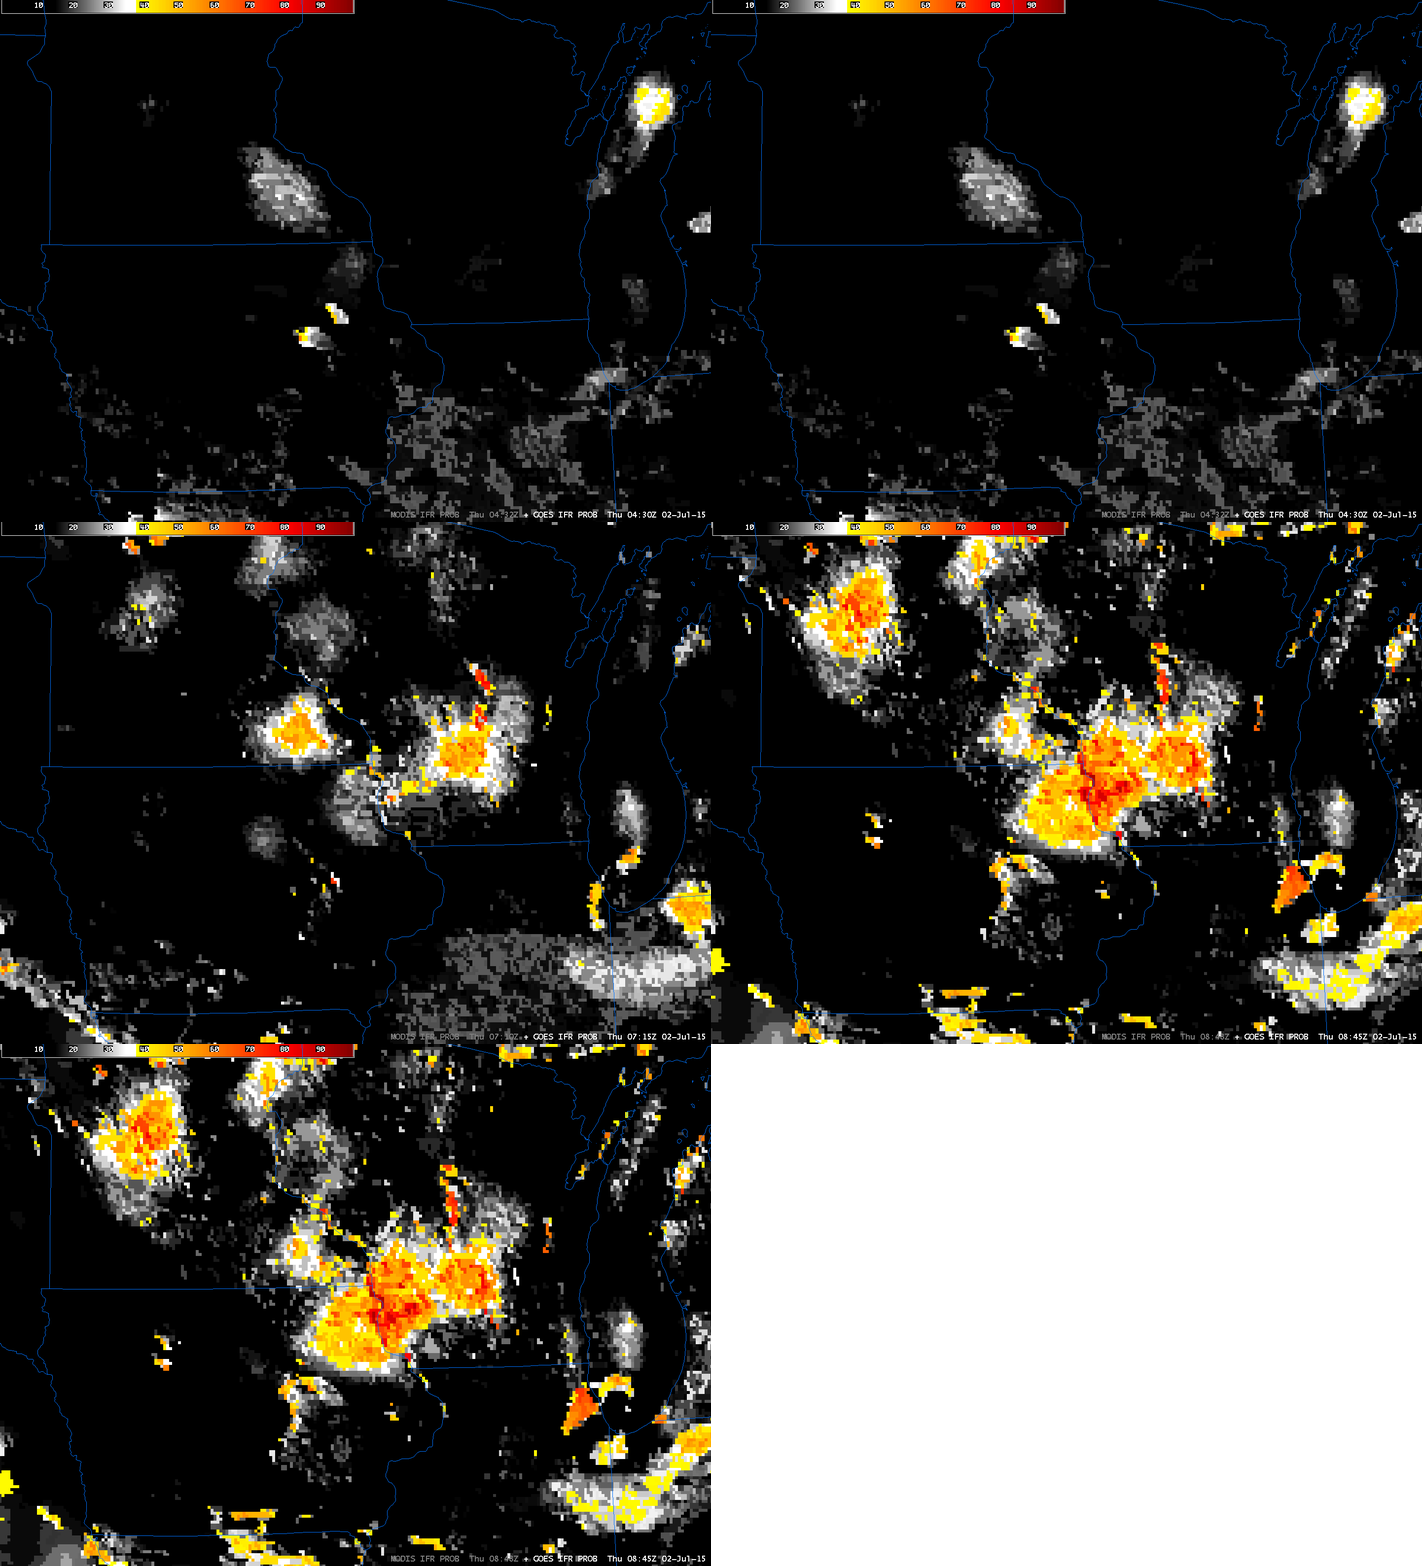
The CIMSS Satellite Blog shows a case on July 2nd 2015 of Day Night Band detection of river valley fog over the upper midwest. River Valley fog is a challenge for GOES detection because of the large pixel footprint. So how did it do in this case, and how does that compare to MODIS-based detection? The animation below shows the three MODIS scenes during fog development that occurred. MODIS-based IFR Probability at 0432 UTC (from Terra) hints at the development of fog over the Wisconsin and Kickapoo Rivers over southwestern WI. GOES-based IFR Probability from 0430 UTC (shown below the MODIS data) shows no signal there. GOES-based IFR Probabilities do appear at 0715 UTC, however. The MODIS-based signal has given any forecaster an early alert to the development of fog over the River valleys. (Toggles between GOES and MODIS-based IFR Probabilities are available for 0430 UTC, 0715 UTC and 0845 UTC). Note that both 0710 and 0848 UTC MODIS-based fields (from Aqua) have a geometry such that the Mississippi River valley is near the edge, and artifacts related to the so-called bow-tie effect are present as repeated features in the field. Nevertheless, the MODIS-based field correctly limits the fog to the River Valleys and shows very high IFR Probabilities; GOES-based pixels fail to resolve narrow river valleys.

MODIS_IFR_PROB_20150702_0432_0848anim

MODIS-based GOES-R IFR Probabilities, 0432, 0710 and 0848 UTC on 2 July 2015 (Click to enlarge)

GOES_IFR_PROB_20150702_0430_0845anim

GOES-based GOES-R IFR Probabilities, 0430, 0715 and 0845 UTC on 2 July 2015 (Click to enlarge)

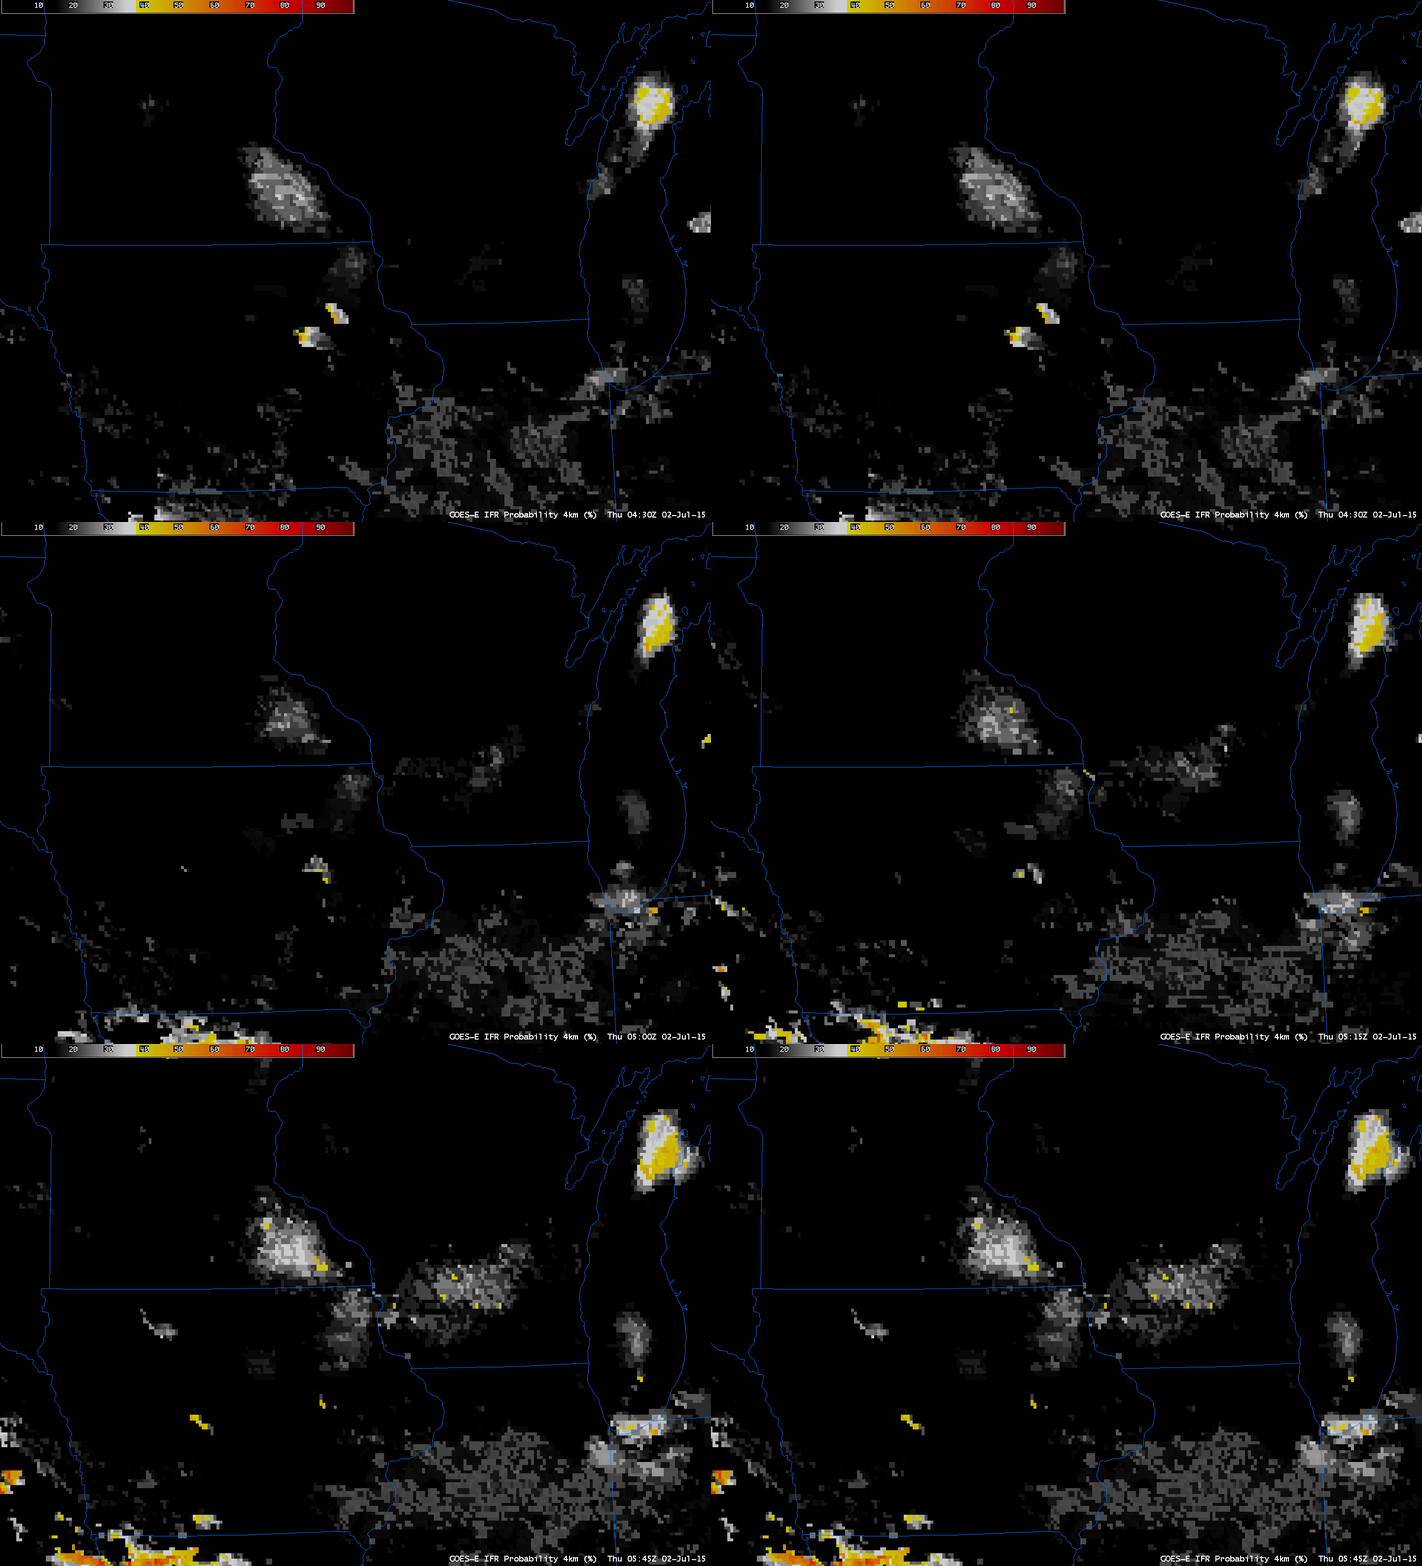
An animation of GOES-based IFR Probabilities, below, suggests that GOES data identified the likelihood of IFR conditions starting around 0515 UTC, almost 45 minutes after the higher-resolution MODIS pass at 0432 UTC.

GOES_IFR_PROB_20150702_0430_0545anim

GOES-based GOES-R IFR Probabilities, 0430 – 0545 UTC on 2 July 2015 (Click to enlarge)