Monthly Archives: March 2014

Fog vs. Stratus over southern California

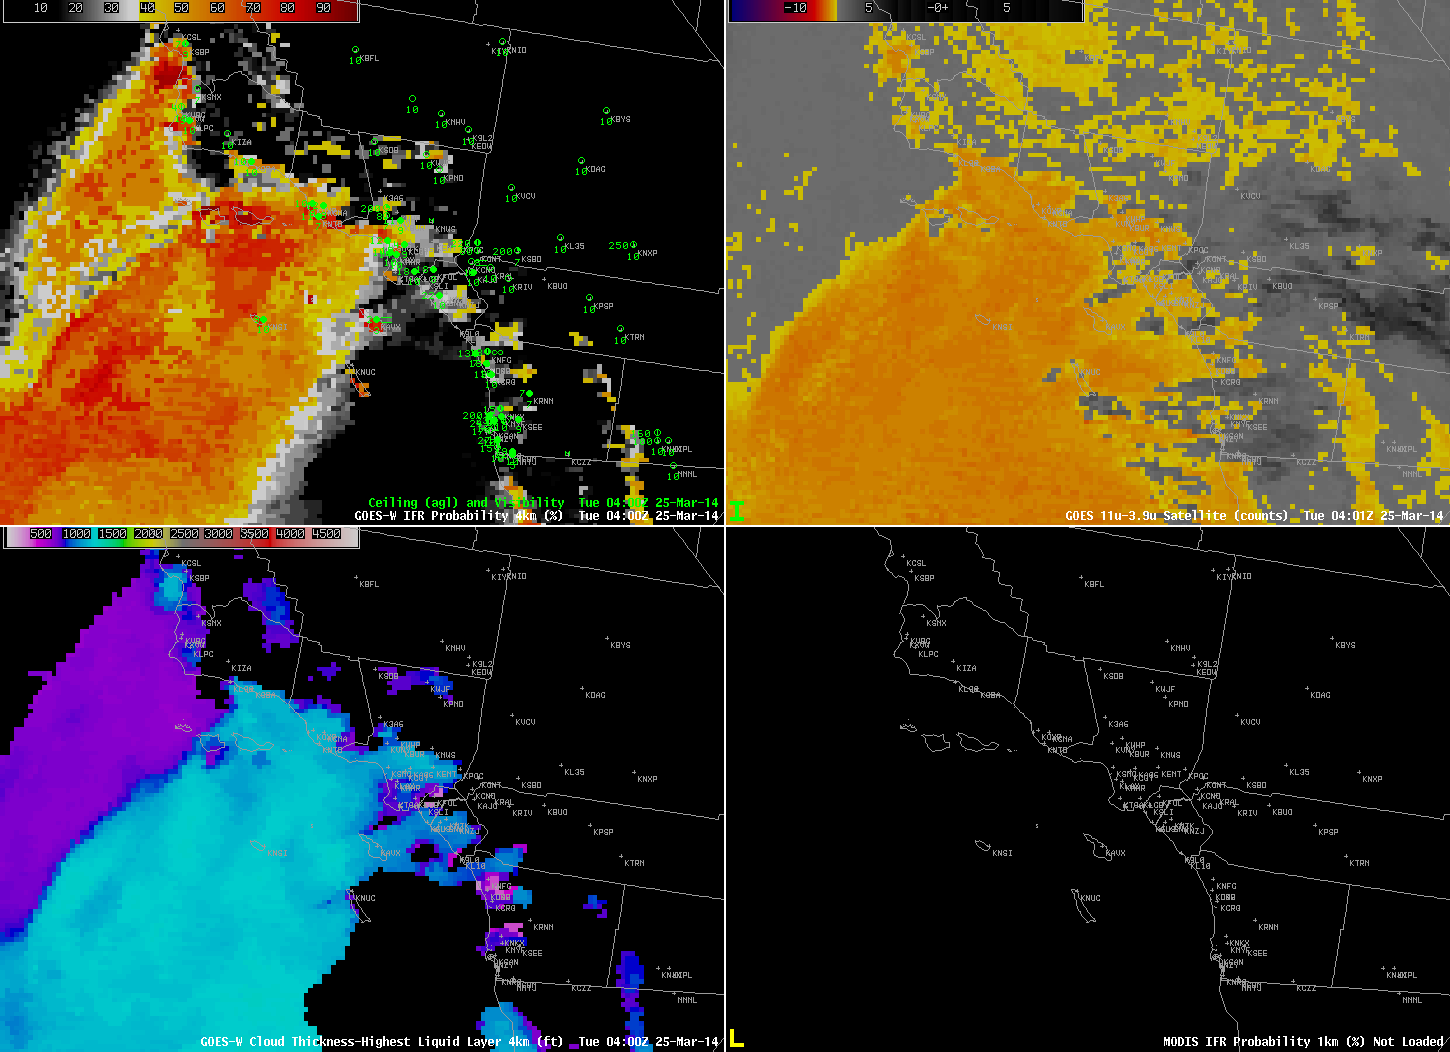
Brightness temperature difference fields over the Pacific Ocean offshore of southern California showed a solid field of clouds overnight. How can this information about the top of the cloud be used to predict where low clouds and fog (IFR conditions) might exist? If you blend the satellite predictors with predictors from the Rapid Refresh model, you have information about the presence of clouds (the satellite predictors) and about the likelihood of saturation in the lowest kilometer of the model atmosphere. Consider the example below from 0400 UTC on 25 March 2014.

GOES_IFR_PROB_20140325_0400

GOES-R IFR Probabilities computed from GOES-15 (Upper Left), GOES-West Brightness Temperature Differences (10.7 µm – 3.9 µm) (Upper Right), GOES-R Cloud Thickness (Lower Left), GOES-R IFR Probabilities computed from MODIS (Lower Right), all near 0400 UTC on 25 March 2014 (click to enlarge)

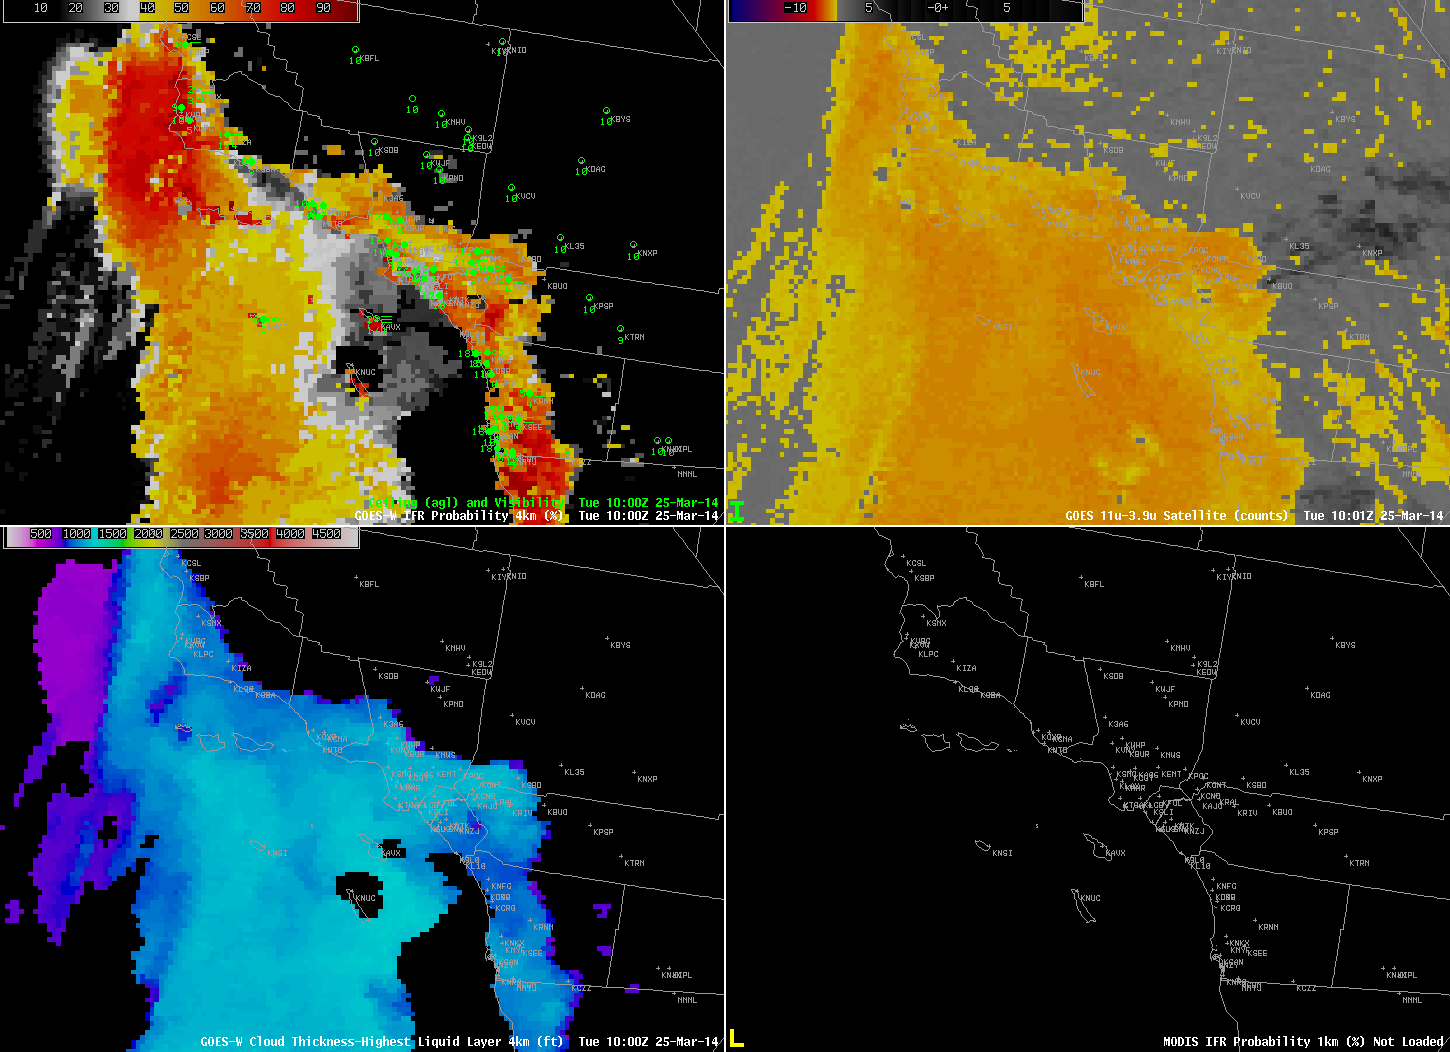
Brightness temperature differences suggest a deck of stratus over most of the Gulf of Santa Catalina (and over the Channel Islands as well). The IFR Probability field, however, suggests that the stratus just offshore of southern California, between the mainland and the Islands, is not reducing surface visibilities, and IFR conditions do not exist right along the coast of the mainland. The station reporting IFR conditions, KAVX, Catalina Airport on Catalina Island, is 1600′ above sea level.

By 1000 UTC, below, visibilities have lowered (and IFR Probabilities have increased) near Vandenberg AFB north of Point Conception. IFR conditions persist over Catalina Island (demonstrating the importance of knowing the elevation of the stations!).

GOES_IFR_PROB_20140325_1000

As above, but at 1000 UTC on 25 March 2014 (click to enlarge)

Stratus vs. Fog in the upper Midwest

GOES_IFR_PROB_20140320_0202

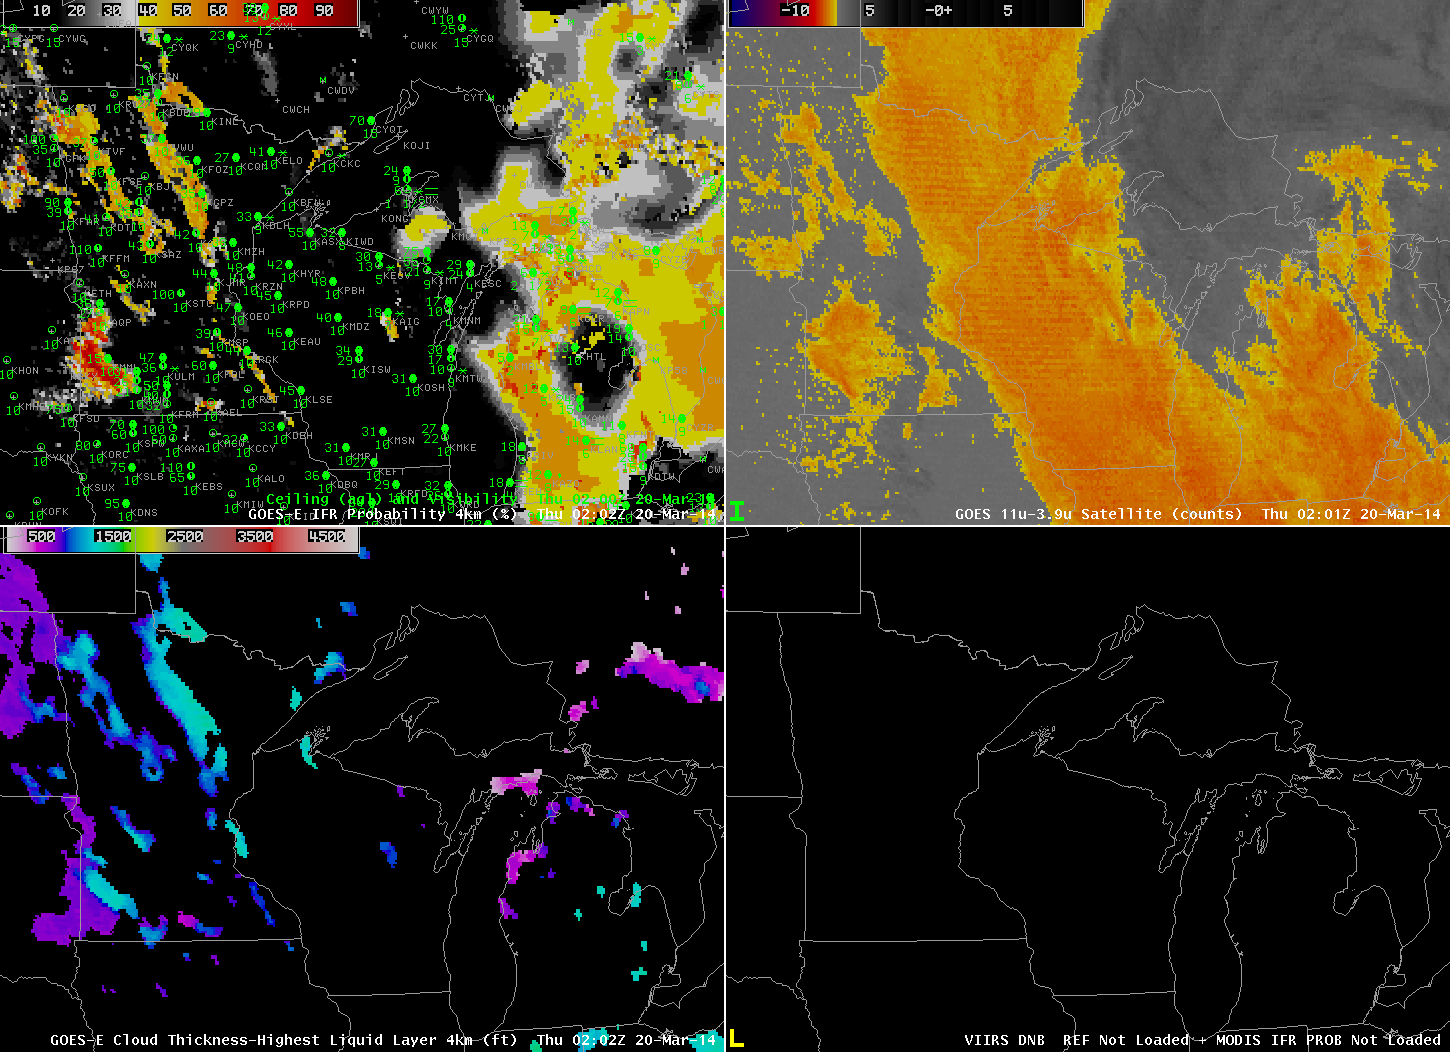
GOES-R IFR Probabilities computed from GOES-13 (Upper Left), GOES-East Brightness Temperature Differences (10.7 µm – 3.9 µm) (Upper Right), GOES-R Cloud Thickness (Lower Left), Suomi-NPP Brightness Temperature (Lower Right), all near 0200 UTC on 20 March 2014 (click to enlarge)

Low clouds lingered over the upper midwest behind a departing low pressure system late on Wednesday the 19th. A strong signal was evident in the brightness temperature difference field from GOES-East, above, from 0200 UTC, extending northwest to southeast over eastern Minnesota into northern Indiana. Note, however, that ceilings in this region were indicative of mid-level stratus rather than fog. IFR Probabilities are correctly very small underneath this stratus.

GOES_IFR_PROB_20140320loop

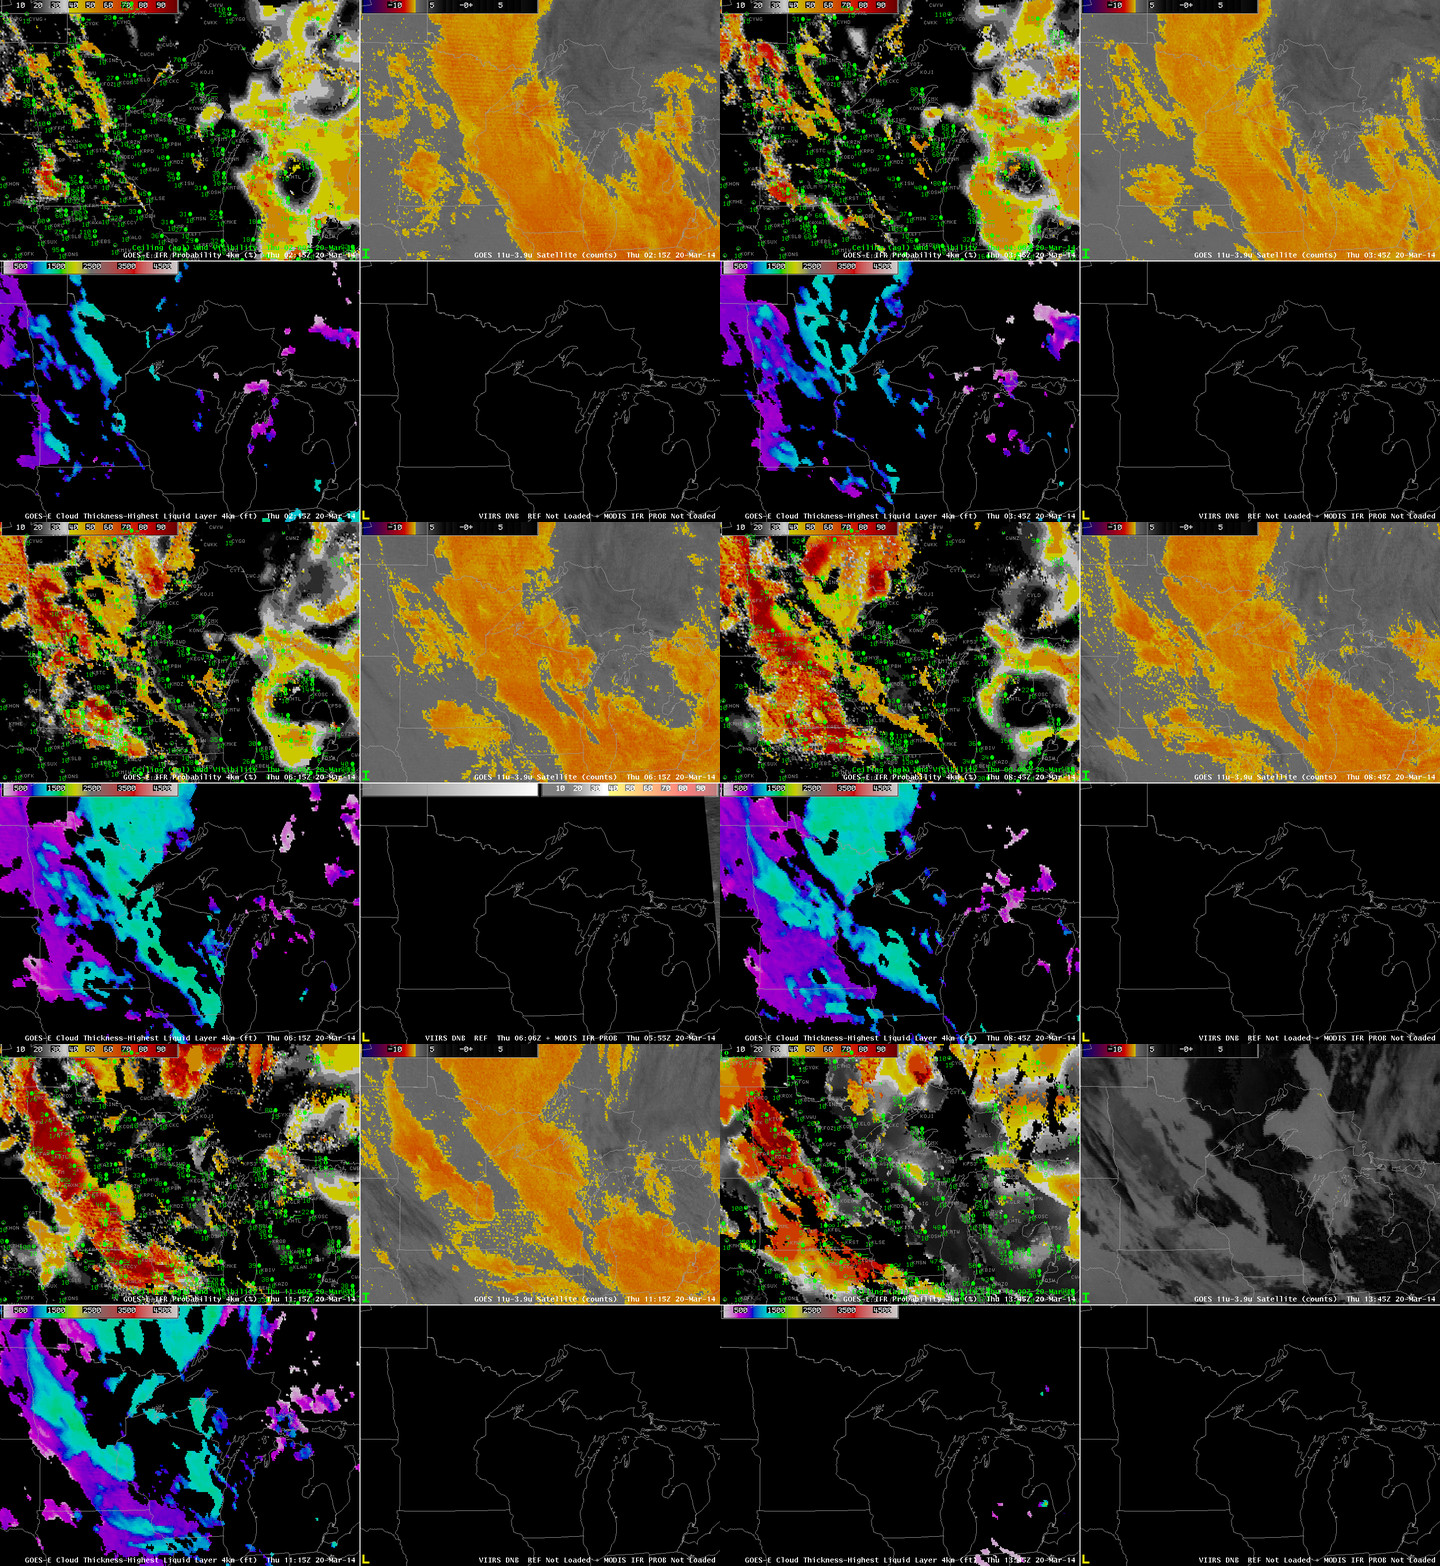
GOES-R IFR Probabilities computed from GOES-13 (Upper Left), GOES-East Brightness Temperature Differences (10.7 µm – 3.9 µm) (Upper Right), GOES-R Cloud Thickness (Lower Left), MODIS-based IFR Probabilities and Suomi-NPP Day/Night Band (Lower Right), times as indicated (click to enlarge)

An animation of the fields, above, shows the development of a low IFR conditions over western Minnesota. The brightness temperature difference fields also show their development, and the combination of satellite predictors and model predictors lead to very high IFR Probabilities in that region, both in the GOES-based fields, shown half-hourly, and in the MODIS-based fields, shown when available.

GOESVIIRS_FOG_20140320_0745

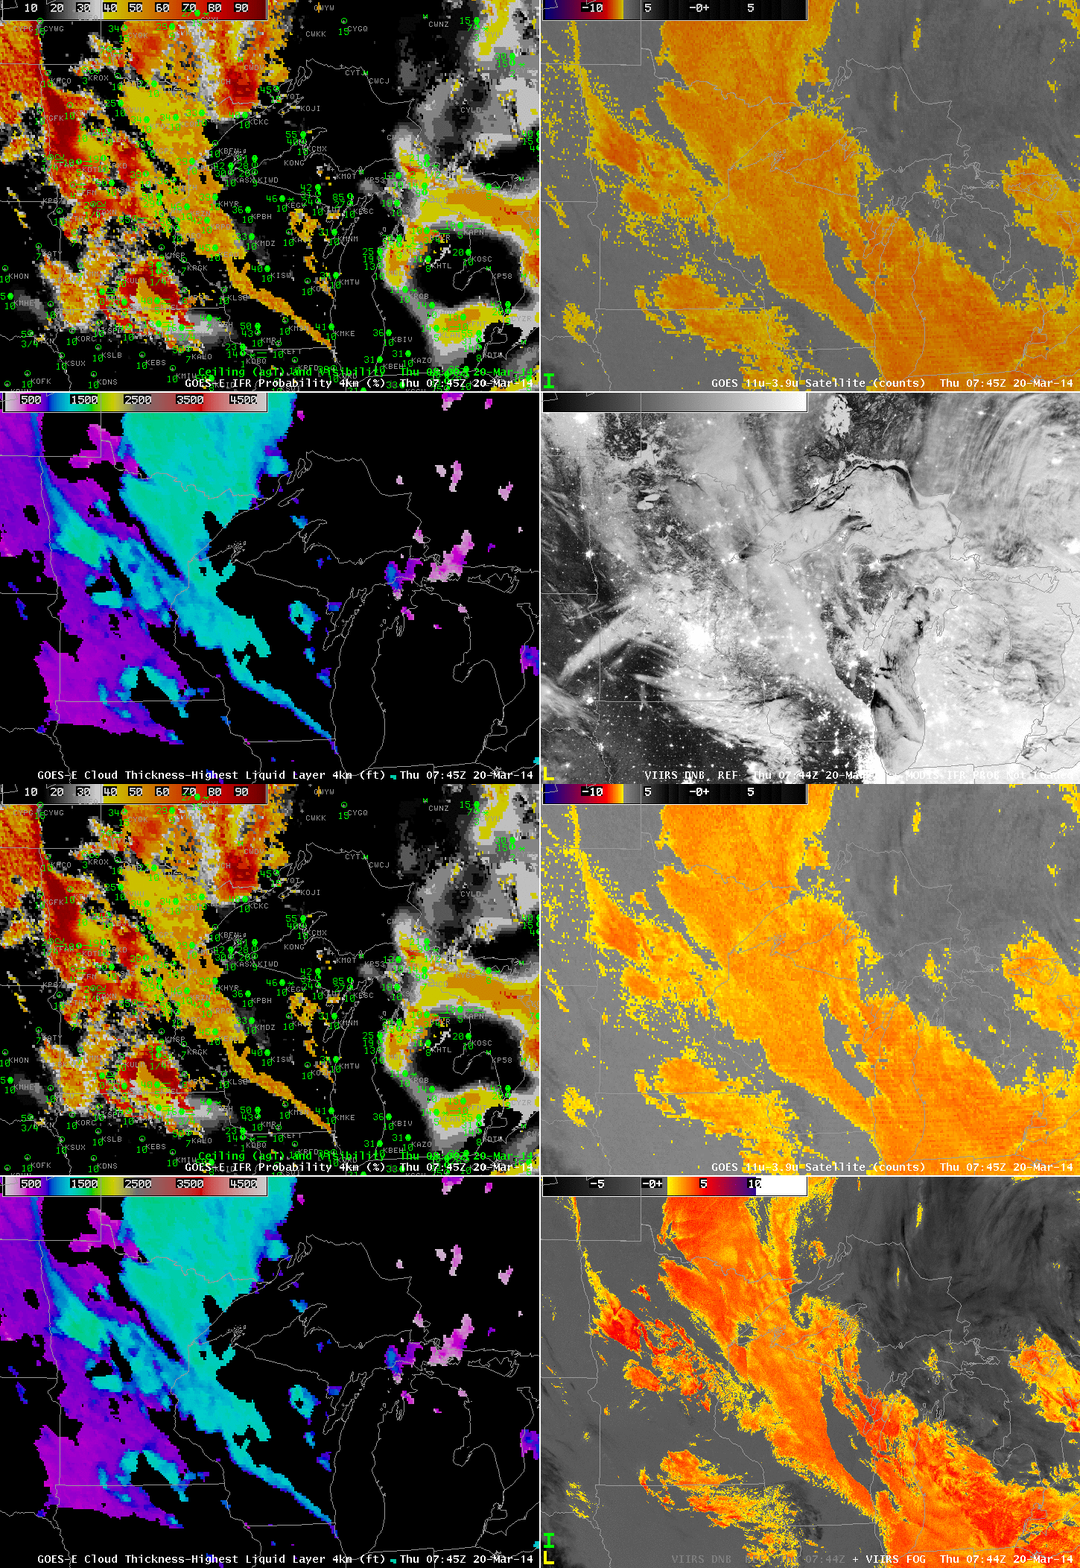
Suomi/NPP Day/Night band and brightness temperature difference field, 0744 UTC on 20 March 2014 (click to enlarge)

The near-full Moon provided ample illumination for the clouds, and the day/night band reveals the extensive cloud cover over the upper midwest, but as it only shows the top of the clouds, it is difficult to determine if visibility restrictions are also present. The Brightness temperature difference produce is also shown, which field is helpful in screening out snow cover and city lights.

Low clouds and Fog along the West Coast

Low clouds and fog developed along the west coast this morning. From the Monterey (CA) AFD:

FXUS66 KMTR 141143
AFDMTR

AREA FORECAST DISCUSSION
NATIONAL WEATHER SERVICE SAN FRANCISCO BAY AREA
443 AM PDT FRI MAR 14 2014

.SYNOPSIS…AFTER A BIT OF COOLING TODAY…A WARM AND DRY UPPER LEVEL
RIDGE OF HIGH PRESSURE WILL BUILD STRONGLY INTO THE WEST COAST
OVER THE WEEKEND. THIS WILL RESULT IN AFTERNOON TEMPERATURES
REACHING WELL ABOVE SEASONAL NORMS…AND POSSIBLY TO NEAR RECORD
LEVELS FOR THESE DATES. THIS WARM-UP WILL BE SHORT-LIVED HOWEVER…WITH
INCREASED ONSHORE FLOW AND A SIGNIFICANTLY COOLER AIR MASS MOVING
IN ALOFT THE FIRST PART OF NEXT WEEK. DRY CONDITIONS ARE EXPECTED
TO CONTINUE THROUGH MID WEEK…BUT THEN WITH UPPER LEVEL TROUGHING
AND A CHANCE OF RAIN FOR THE OUTER PORTION OF THE FORECAST PERIOD.

&&

.DISCUSSION…AS OF 4:10 AM PDT FRIDAY…THE DRY TAIL END OF A
WEATHER SYSTEM MOVING IN TO THE PACIFIC NORTHWEST IS APPROACHING
OUR DISTRICT…AND RESULTING IN ENHANCEMENT OF THE MARINE LAYER
AND A RETURN OF THE MARINE STRATUS. LATEST GOES FOG PRODUCT
IMAGERY…AND IN RATHER SPECTACULAR DETAIL JUST REC’D SUOMI VIIRS
NIGHTTIME HIGH RES VISUAL IMAGE…SHOW COVERAGE ALONG MUCH OF THE
COAST FROM PT REYES SOUTH TO THE VICINITY OF THE MONTEREY
PENINSULA…AND A BROAD SWATH EXTENDING INLAND ACROSS SAN
FRANCISCO AND THROUGH THE GOLDEN GATE TO THE EAST BAY. LATEST
BODEGA BAY AND FT ORD PROFILER DATA INDICATE A MARINE LAYER DEPTH
OF ABOUT 1300 FT. SOME THIN HIGH CLOUDS ARE ALSO PASSING THROUGH ABOVE.

NAM MODEL AND IN-HOUSE LOCAL WRF MODEL BOUNDARY LAYER RH OUTPUT
BOTH INDICATE STRATUS SHOULD GENERALLY CLEAR BY MIDDAY…EXCEPT
ALONG THE SAN MATEO COAST AND IN THE VICINITY OF THE MONTEREY
PENINSULA. EXPECT AFTERNOON HIGHS TO BE AROUND 3 TO 5 DEGS COOLER
THAN ON THURSDAY…BUT STILL WELL ABOVE SEASONAL NORMS ESPECIALLY
INLAND.
GOES_IFR_PROB_20140314loop

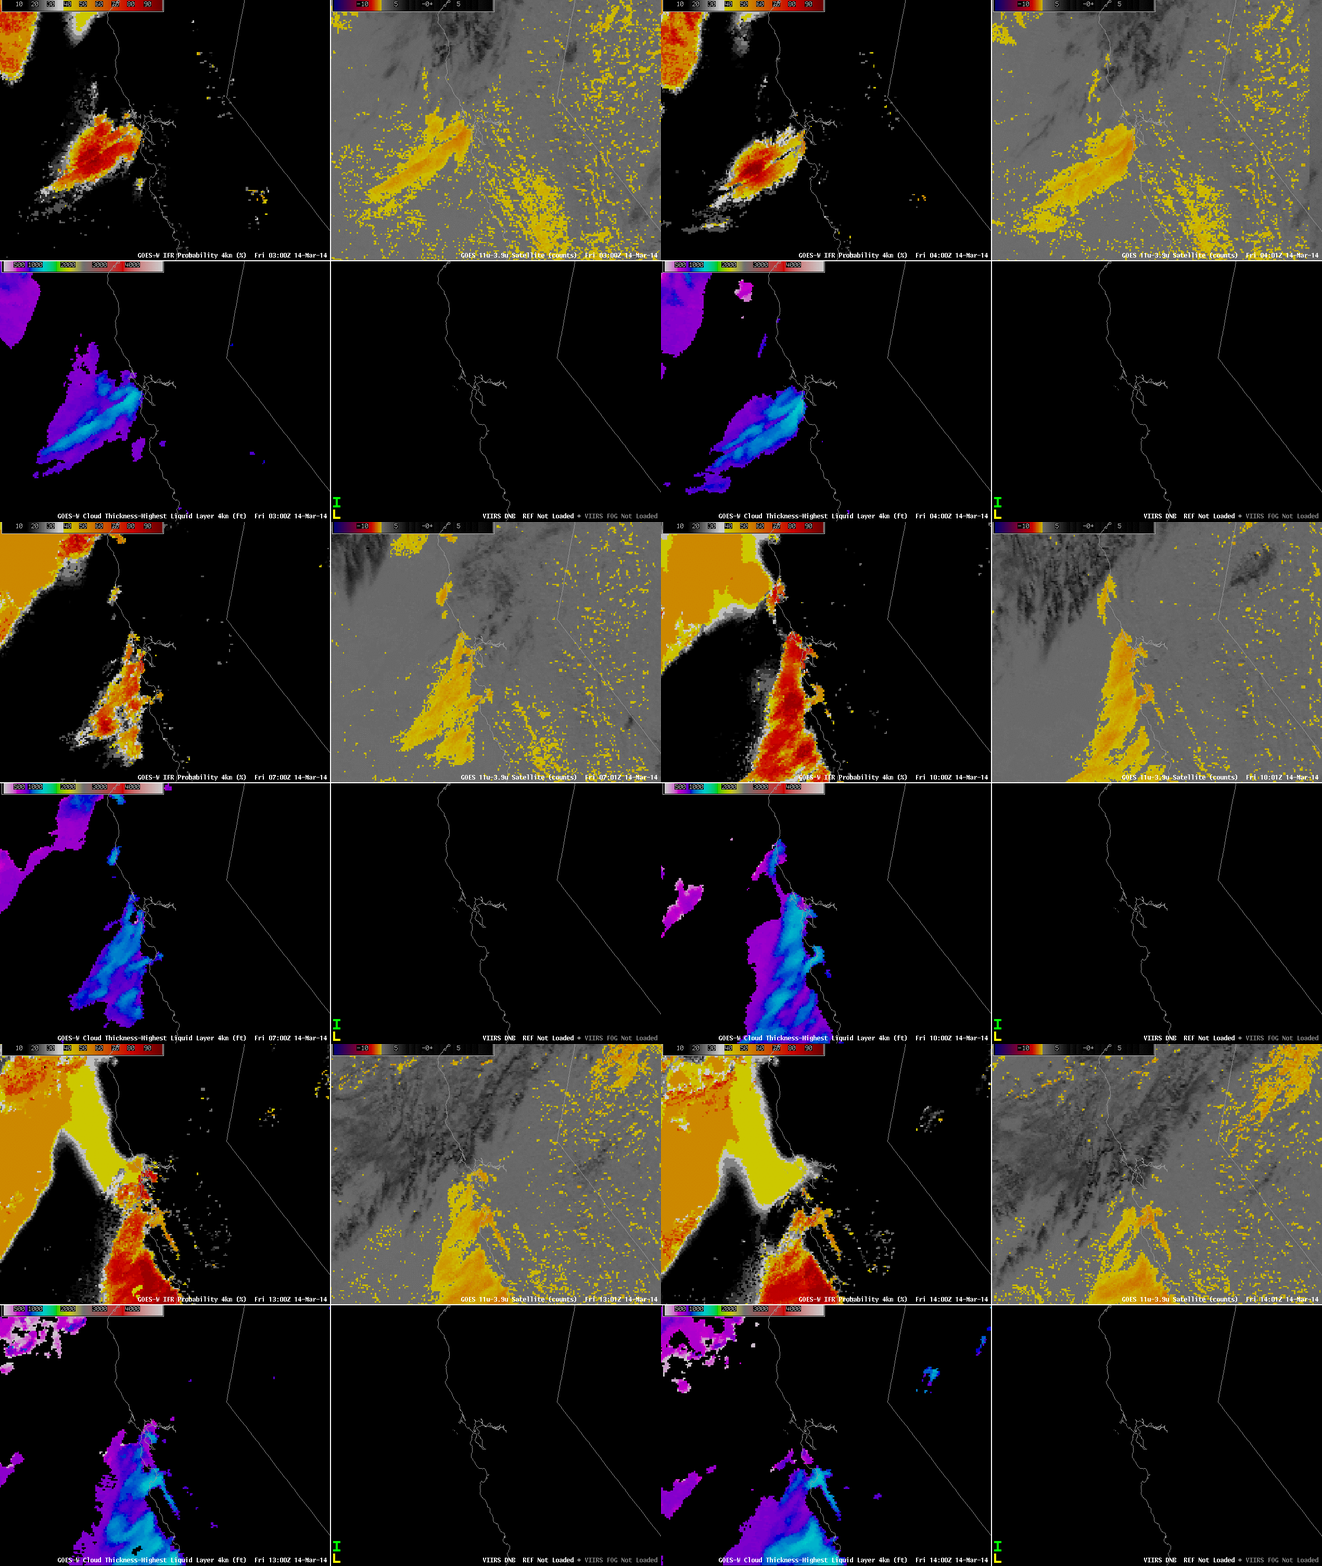
GOES-R IFR Probabilities computed from GOES-15 (Upper Left), GOES-West Brightness Temperature Differences (10.7 µm – 3.9 µm) (Upper Right), GOES-R Cloud Thickness (Lower Left), Suomi/NPP Day/Night Band (Lower Right), all hourly times as indicated (click to enlarge)

The animation of satellite and satellite-derived fields, above, shows how the GOES-R and GOES-West fields depicted the development of the low clouds. Note how the brightness temperature difference fields over CA and NV throughout the animation have a speckled appearance. These positive signals are due not to the presence of fog/low clouds but rather to differences in emissivity properties of the dry land. Near the end of the animation, high clouds are widespread over northern California. For such cases, the brightness temperature difference product provides little information about low-level clouds. However, the GOES-R IFR Probability field, because it blends together information from satellite and from Rapid Refresh does provide a signal under clouds. It is a much smoother signal because it does vary from one satellite pixel to the next, and the Probability values are smaller because satellite predictors cannot be used in the algorithm.

The AFD above notes the Day/Night band, and also the depth of the marine stratus. The toggle of Cloud Thickness, Day/Night Band, and brightness temperature difference, below (useful to distinguish white clouds from white city lights!), shows a nice overlap between the GOES-R product and the clouds detected at high resolution by Suomi/NPP. Cloud thickness is around 1150 feet at Bodega Bay, and closer to 1250 feet at Fort Ord, in good agreement with the profile data cited.
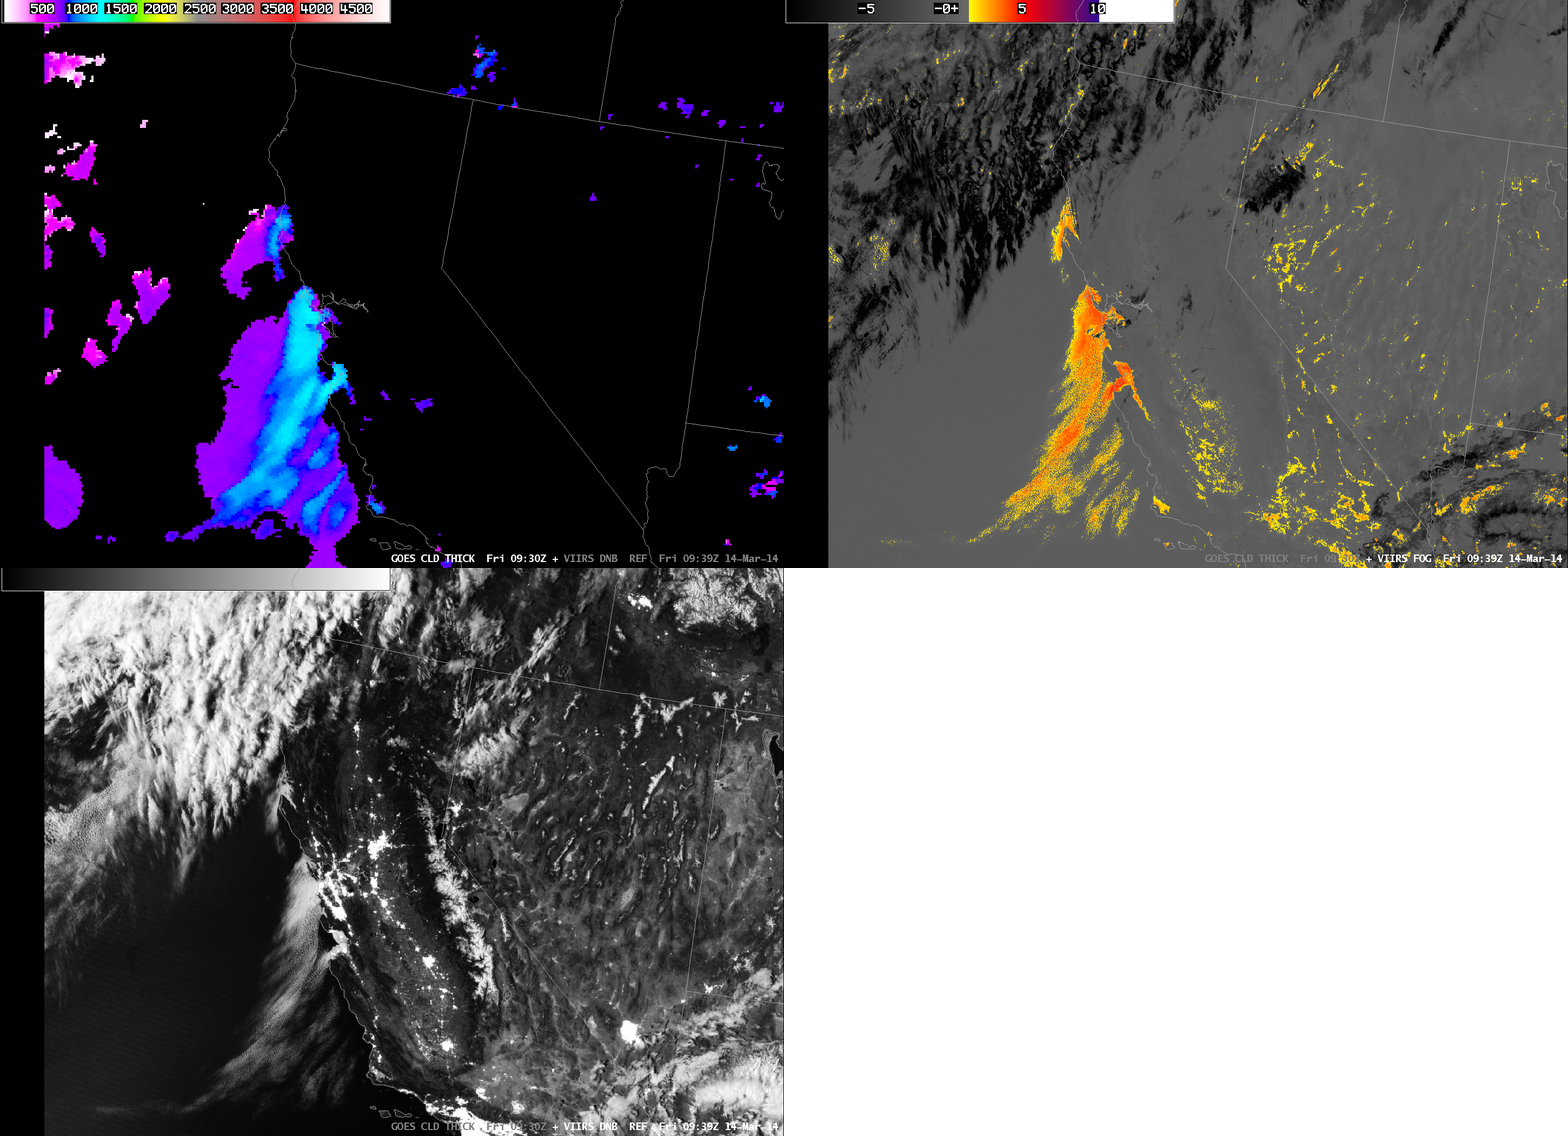
VIIRS_DNB__REF_GOES_CLD_THICK_20140314_09

Toggle of GOES-R Cloud Thickness, Suomi/NPP Brightness Temperature Difference and Day/Night Band (click to enlarge)
Identifying regions of fog under cirrus

IFR_BTD_20140305_0500

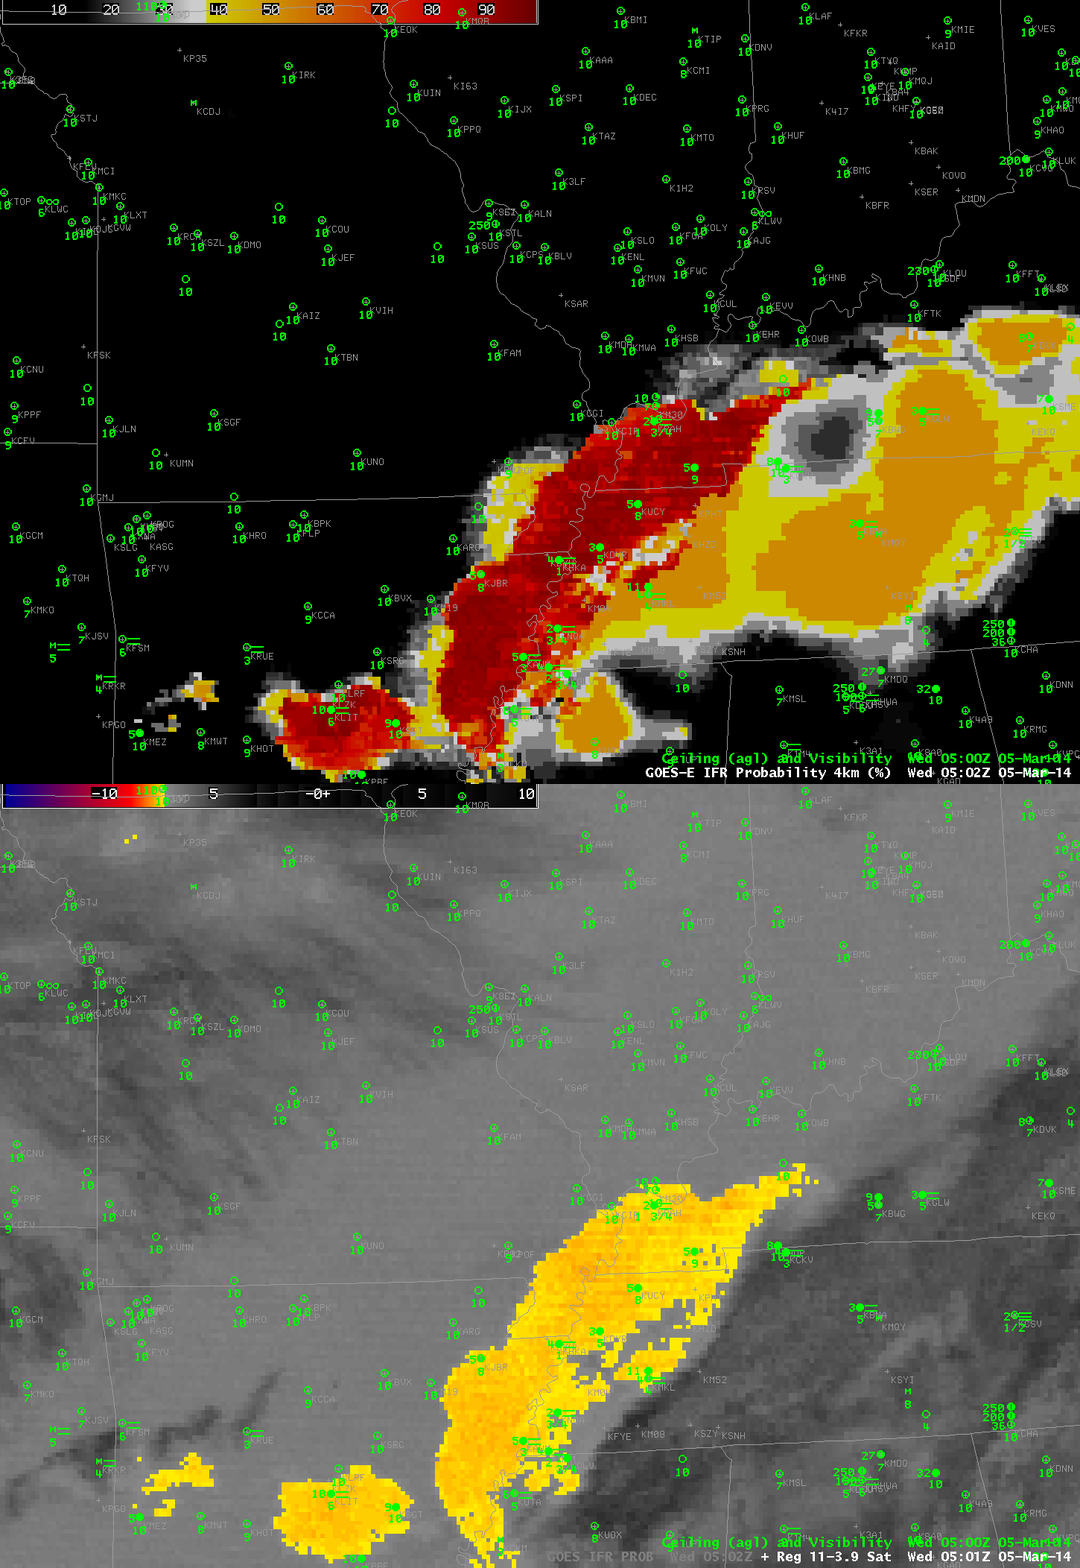
GOES-R IFR Probabilities computed from GOES-13 and GOES-East Brightness Temperature Differences (10.7 µm – 3.9 µm) at 0500 UTC on 5 March 2014 (click to enlarge)

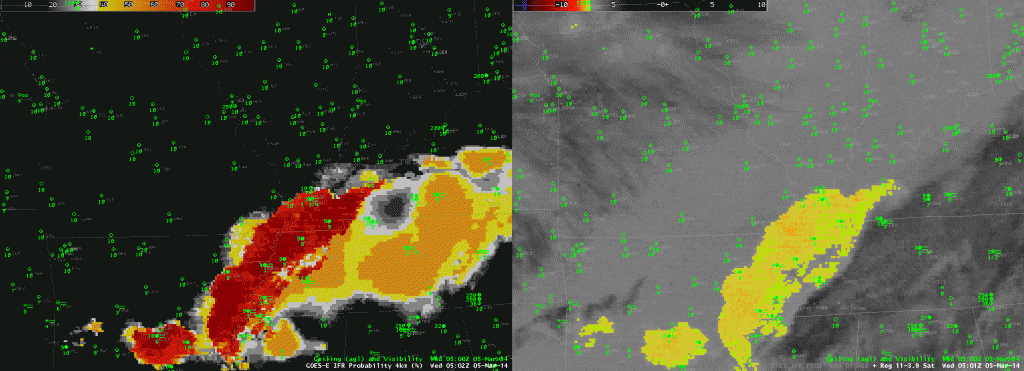
Fog developed overnight over Tennessee on March 5th, but Cirrus clouds prevented the traditional brightness temperature difference product from observing low-level water-based clouds. It is for events like this that the IFR Probability fields (that incorporate surface-based information by way of the Rapid Refresh Model) is important. The IFR Probability fields use predictors from the Rapid Refresh model to showcase where low ceilings and reduced visibilities are most likely. Satellite predictors are unavailable where cirrus clouds are present and the probability field shows lower values. So when you see low values, make sure you understand why the values are low: is it because cirrus clouds are present?

A side-by-side animation of the IFR Probabilities and the Brightness Temperature Difference Field is presented below. The effects of cirrus on the Probability field is obvious.

IFR_11-3.9_20140305loop

GOES-R IFR Probabilities computed from GOES-East (left) and GOES-East Brightness Temperature Differences (10.7 µm – 3.9 µm) (right), hourly from 0500 UTC through 1515 UTC on 5 March 2014 (click to enlarge)

Fog over northeast Florida and coastal Georgia and South Carolina

GOES_IFR_PROB_20140304loop

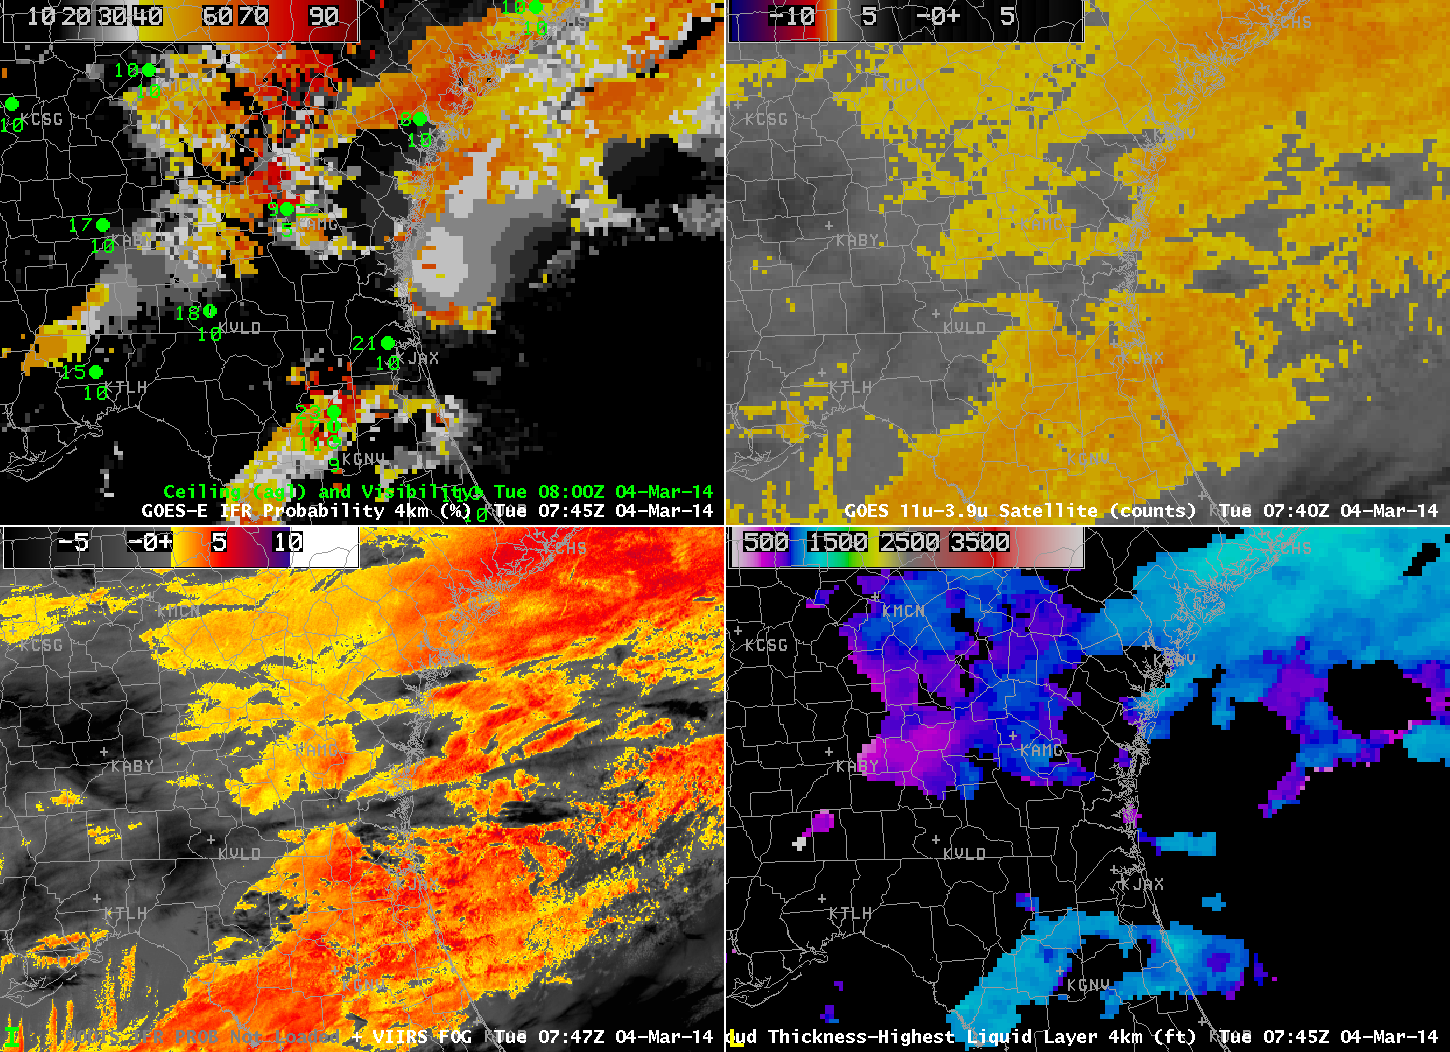
GOES-R IFR Probabilities computed from GOES-13 (Upper left); GOES-East Brightness Temperature Differences (10.7 µm – 3.9 µm) (Upper Right); MODIS-based IFR Probabilities or VIIRS-based Brightness Temperature Difference (11.35 µm – 3.74 µm) (Lower Left); GOES-R Cloud Thickness computed from GOES-East (Lower Right) (click to play animation)

Cold air has swept down the east coast into northern Florida, and the leading edge of that cold air, marked by a shift to northeasterly winds and low clouds, shows up well in the GOES-R IFR Probability fields, displayed above, because the airmass with the northeasterly winds also included low clouds/fog. Note in the animation how IFR conditions develop in Jacksonville as the higher IFR probabilities slide southward. Similarly, IFR conditions diminish over Savannah as IFR Probabilities drop.

This is a case for which the heritage method of detecting fog had difficulties because multiple cloud layers existed. For example, a stratus deck over central Florida shows up very well in the brightness temperature difference field from both GOES and VIIRS, but IFR conditions are not initially seen there (and GOES-R IFR Probabilities are small). The GOES-R Cloud Thickness is not computed in regions with multiple cloud layers, typically, because it shows the thickness of the highest water-based cloud layer. If any overlaying cloud layer at high levels contains ice, the field is not computed.