Category Archives: Deep South

Dense Fog in southern Louisiana

GOES-16 Low IFR Probability fields, 0406 – 1651 UTC, 10 December 2020 , along with surface observations of ceilings and visibility (Click to enlarge)

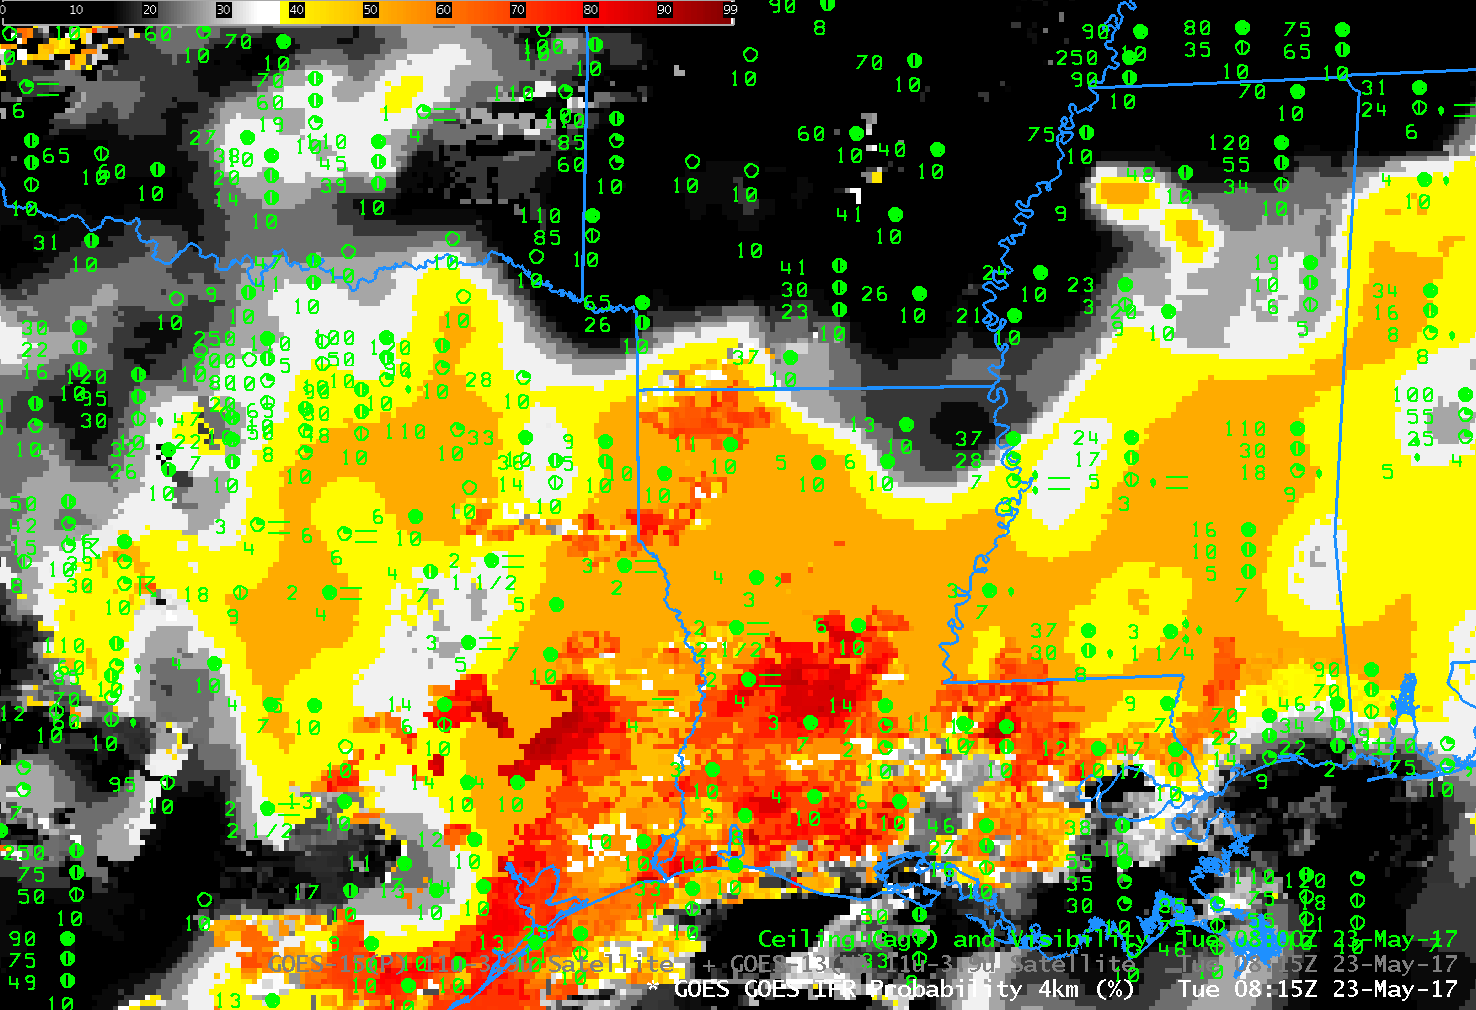
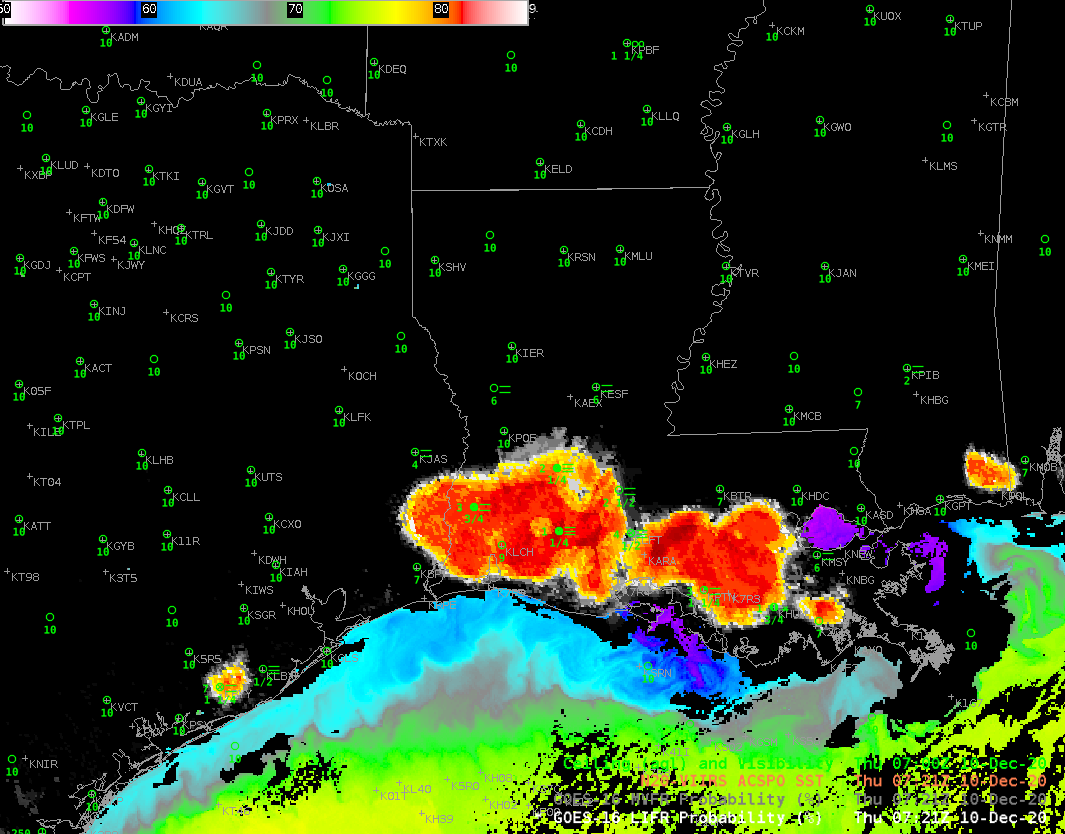
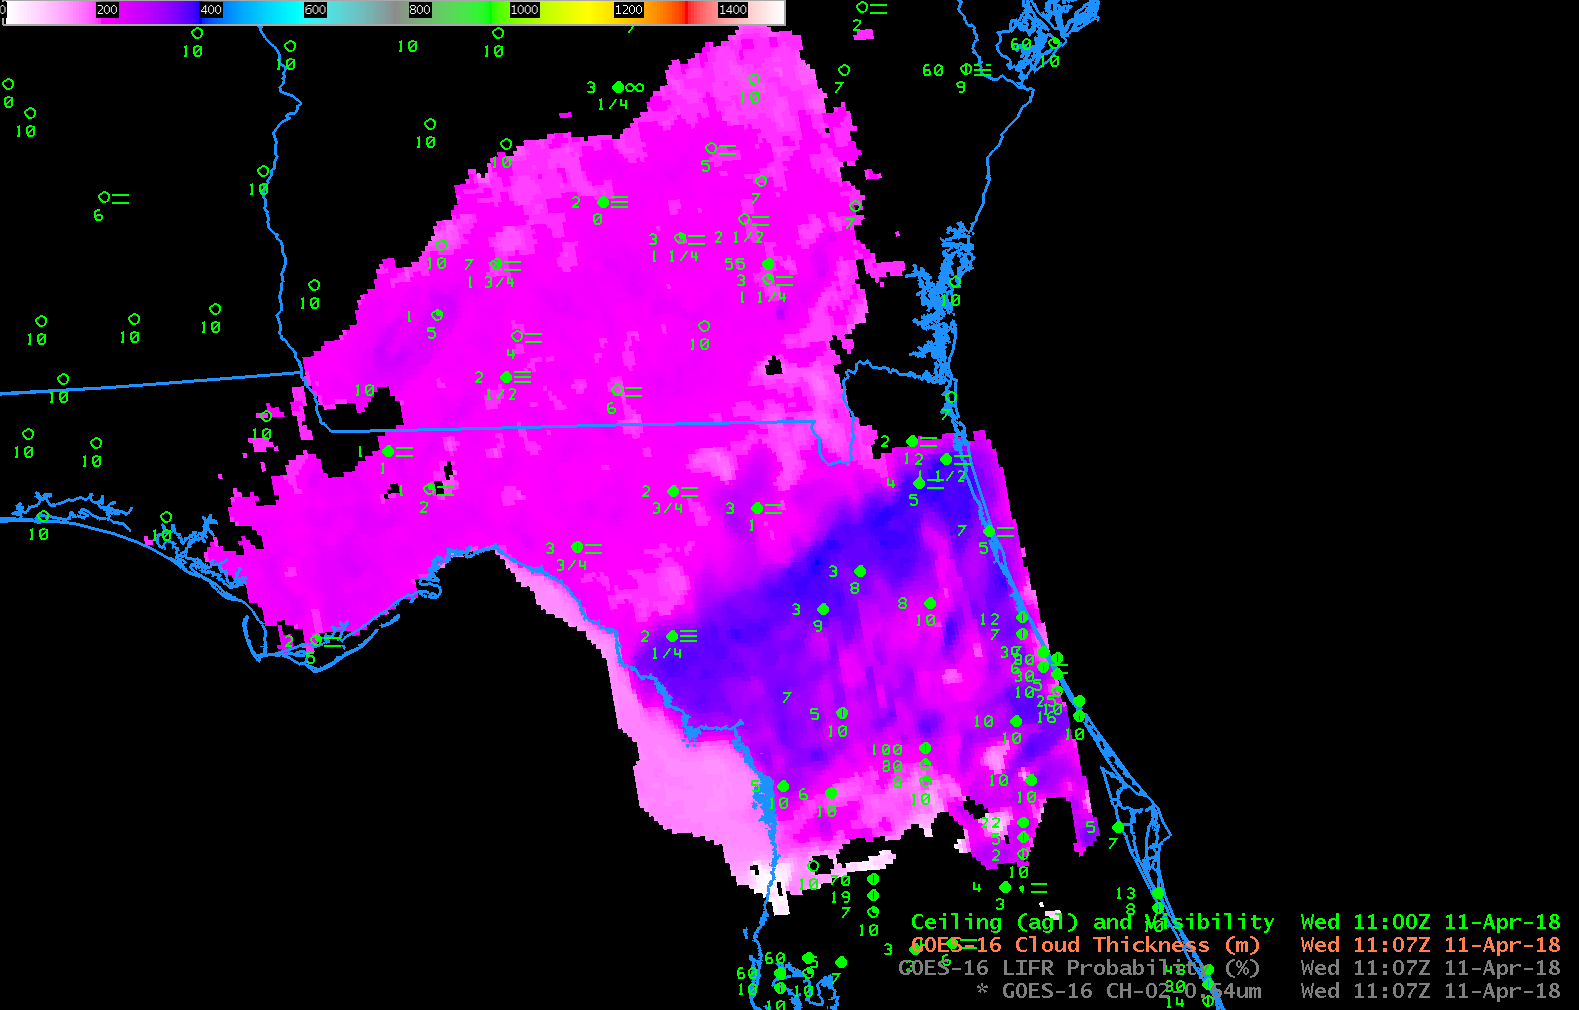
High Pressure (link), cold air, and proximity to warm Sea Surface Temperatures (image here, ACSPO SSTs from the Direct Broadcast Antenna at CIMSS) meant dense fog over southwestern Louisiana. The animation above shows Probabilty of Low IFR Conditions from 0400 UTC through sunrise. Low IFR Probability fields originate near Lake Charles and Franklin before consolidating into one large field over southern Louisiana. Surface observations of ceilings and visibilities also indicate dense fog.

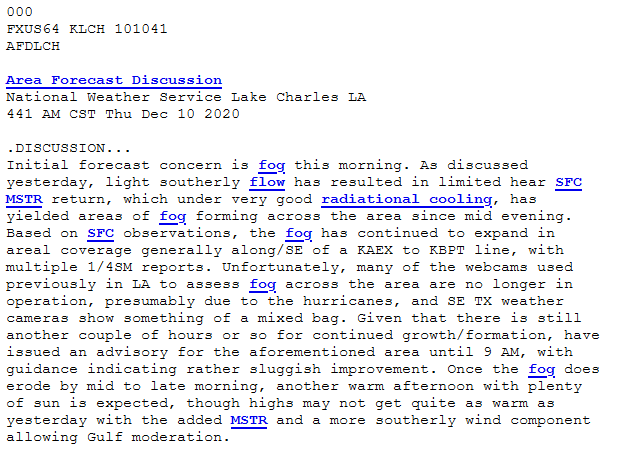
An after-effect of the landfall of Hurricanes is the destruction of webcams that can be used to monitor fog, as noted in the Area Forecast Discussion from WFO Lake Charles, below, from 441 AM CST on 10 December. IFR Probability products in AWIPS combine model predictions of low-level saturation and satellite observations of low cloud to mitigate this loss of information. Regions where low IFR Probability values are high are likely regions that would have dense fog on webcams.

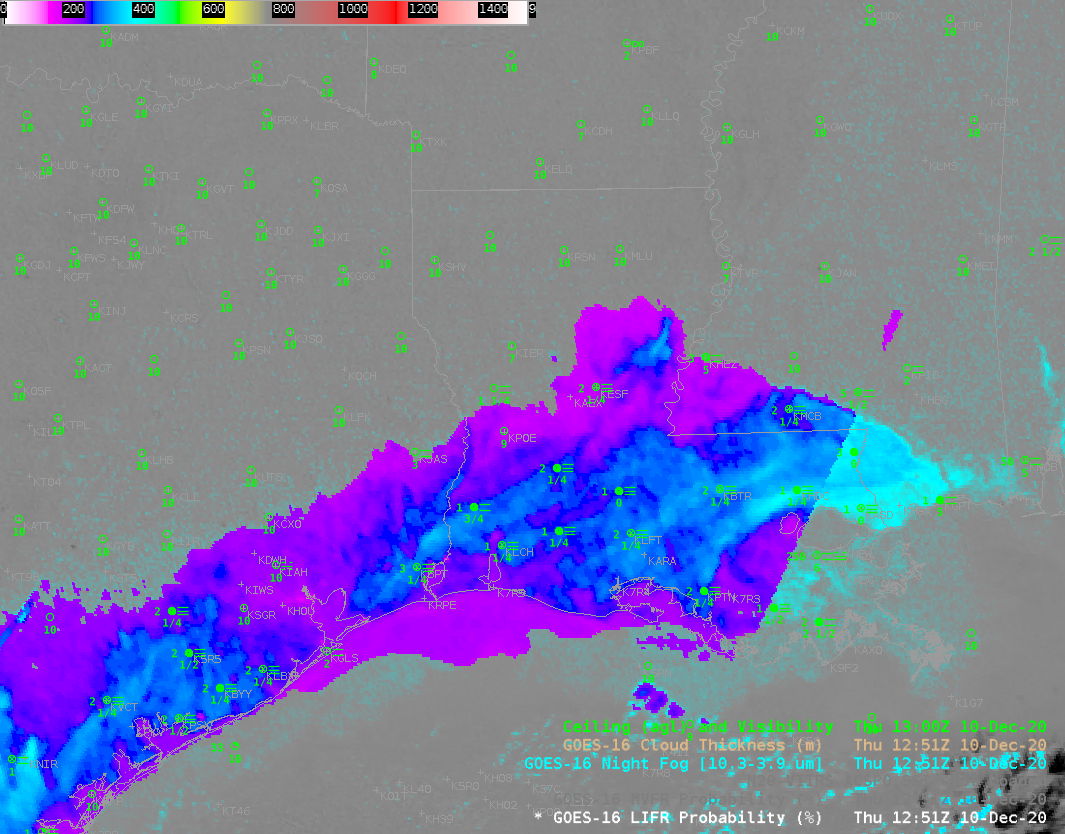
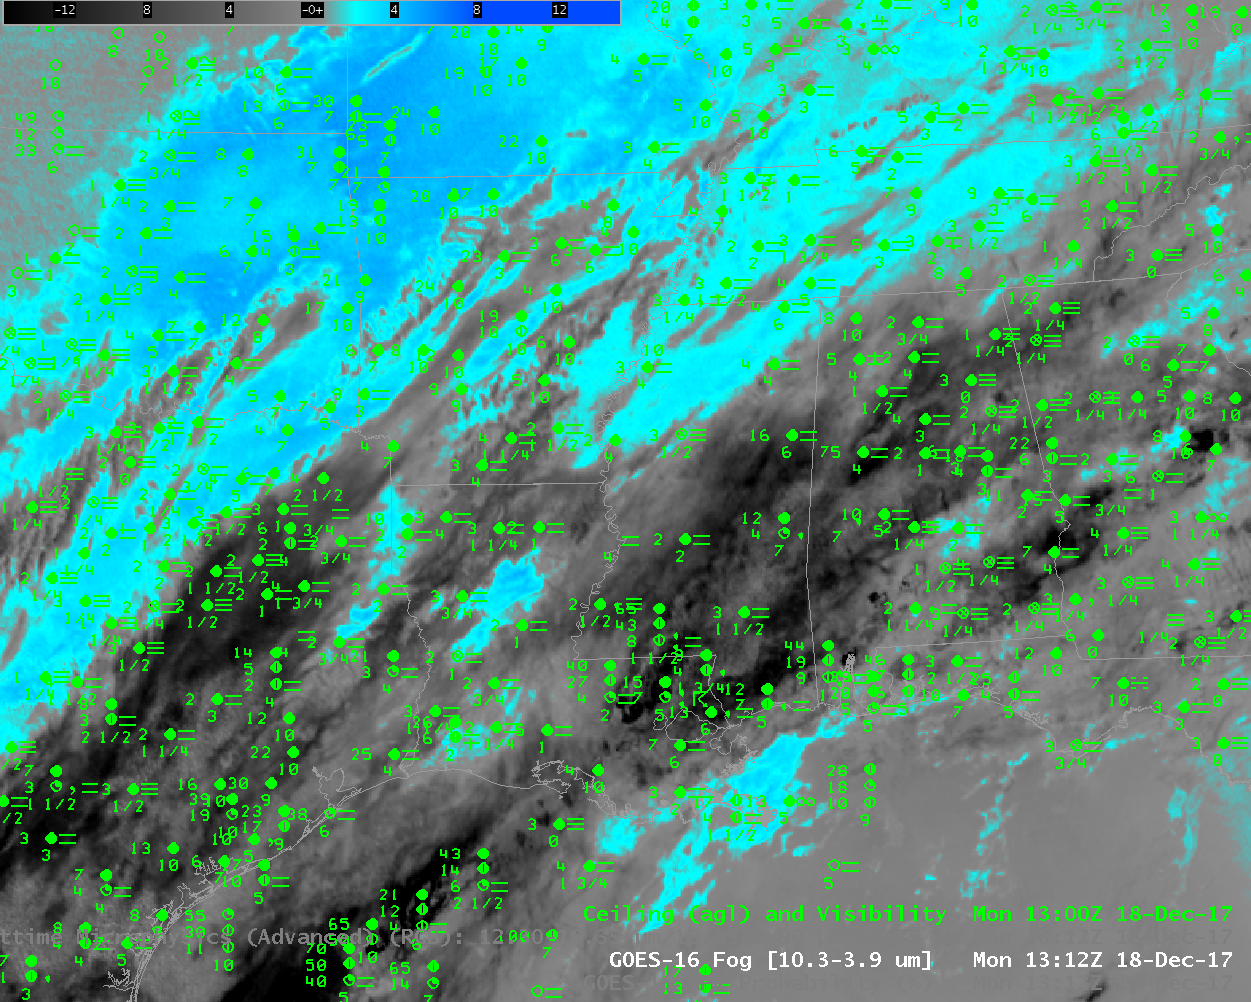
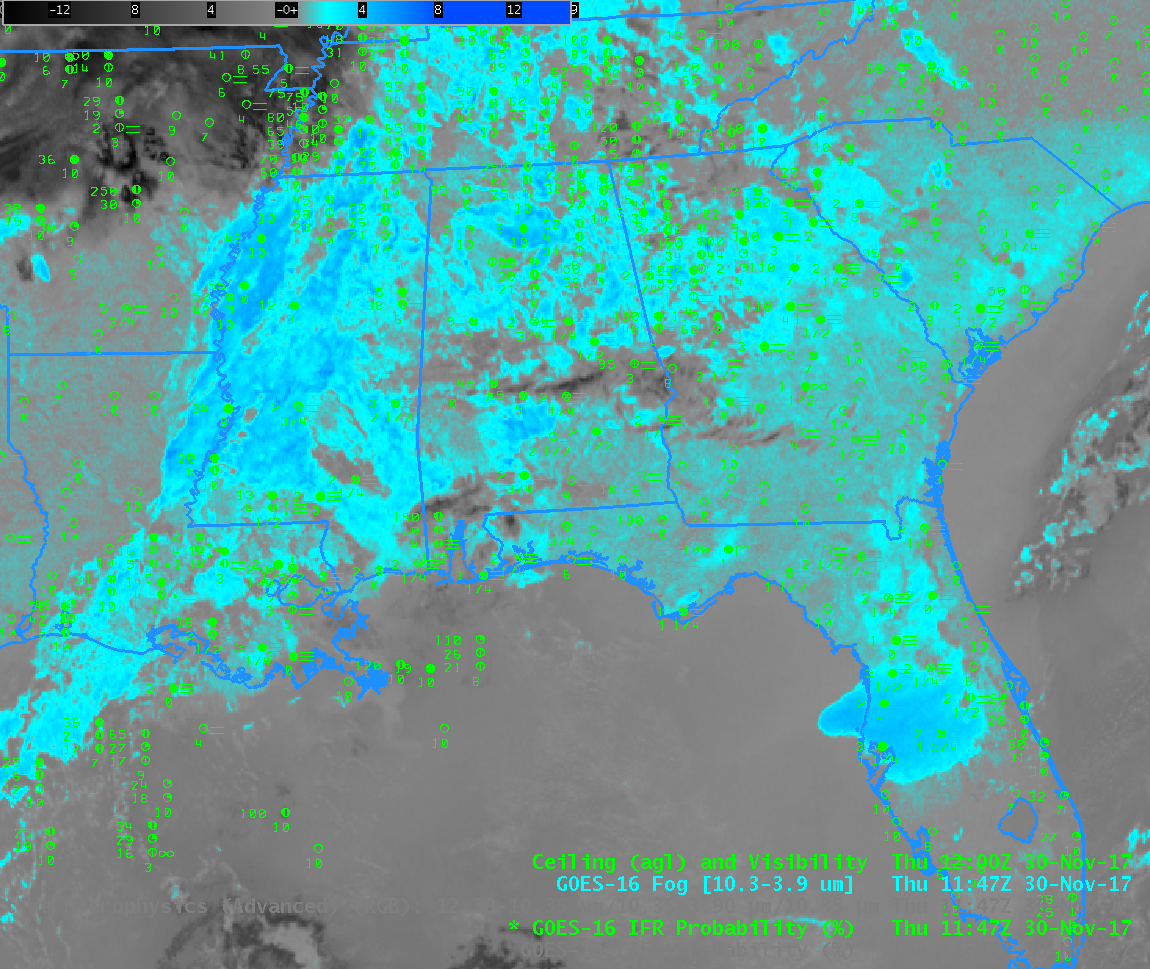
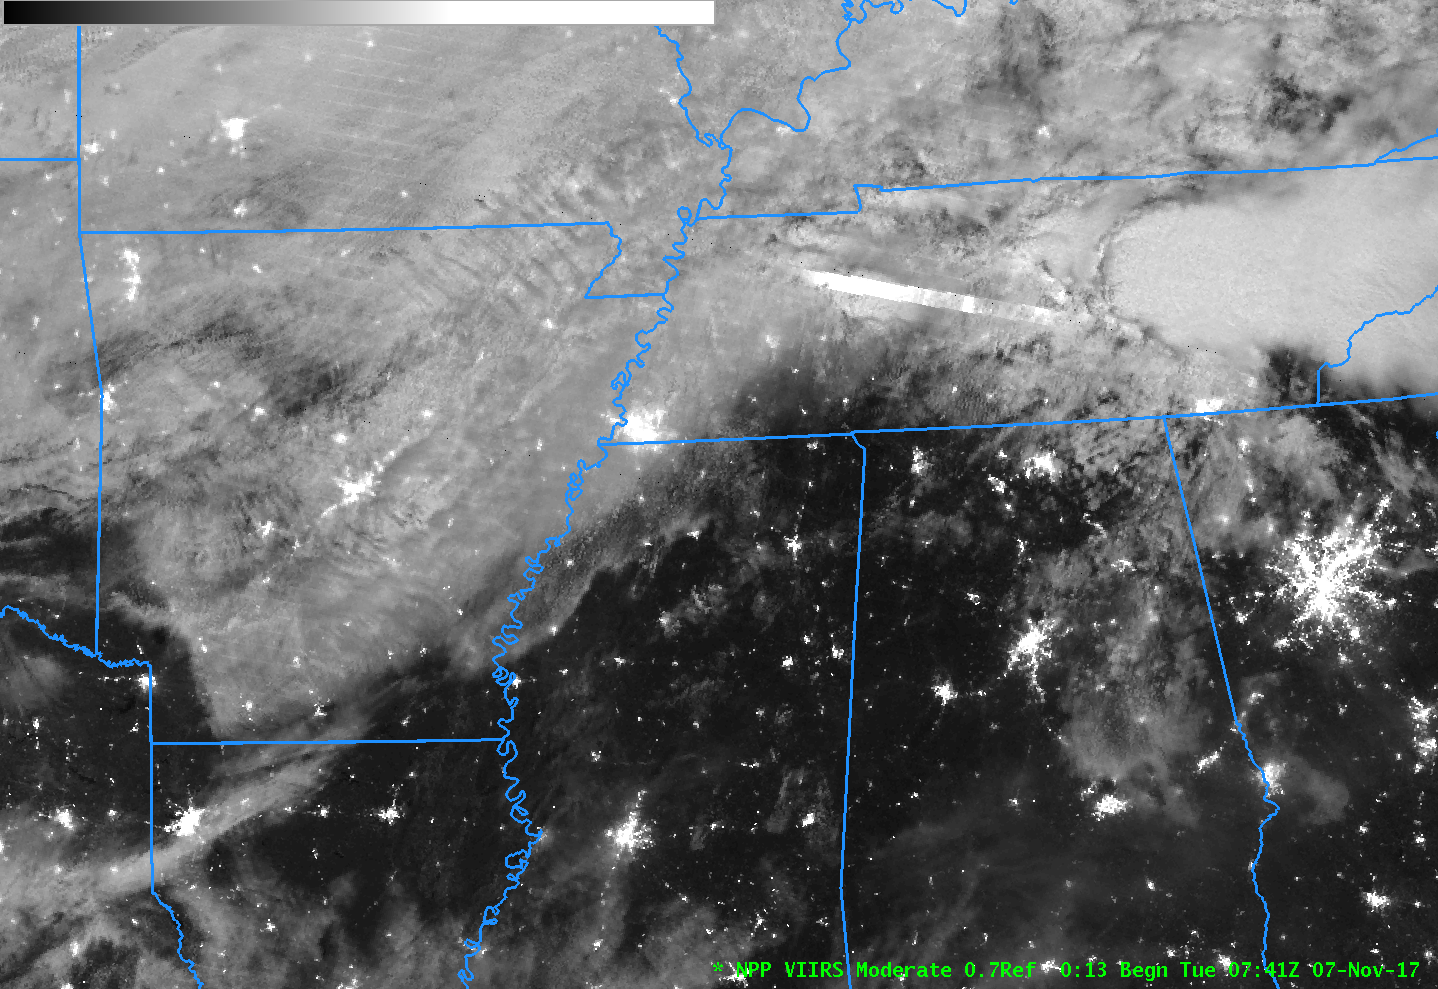
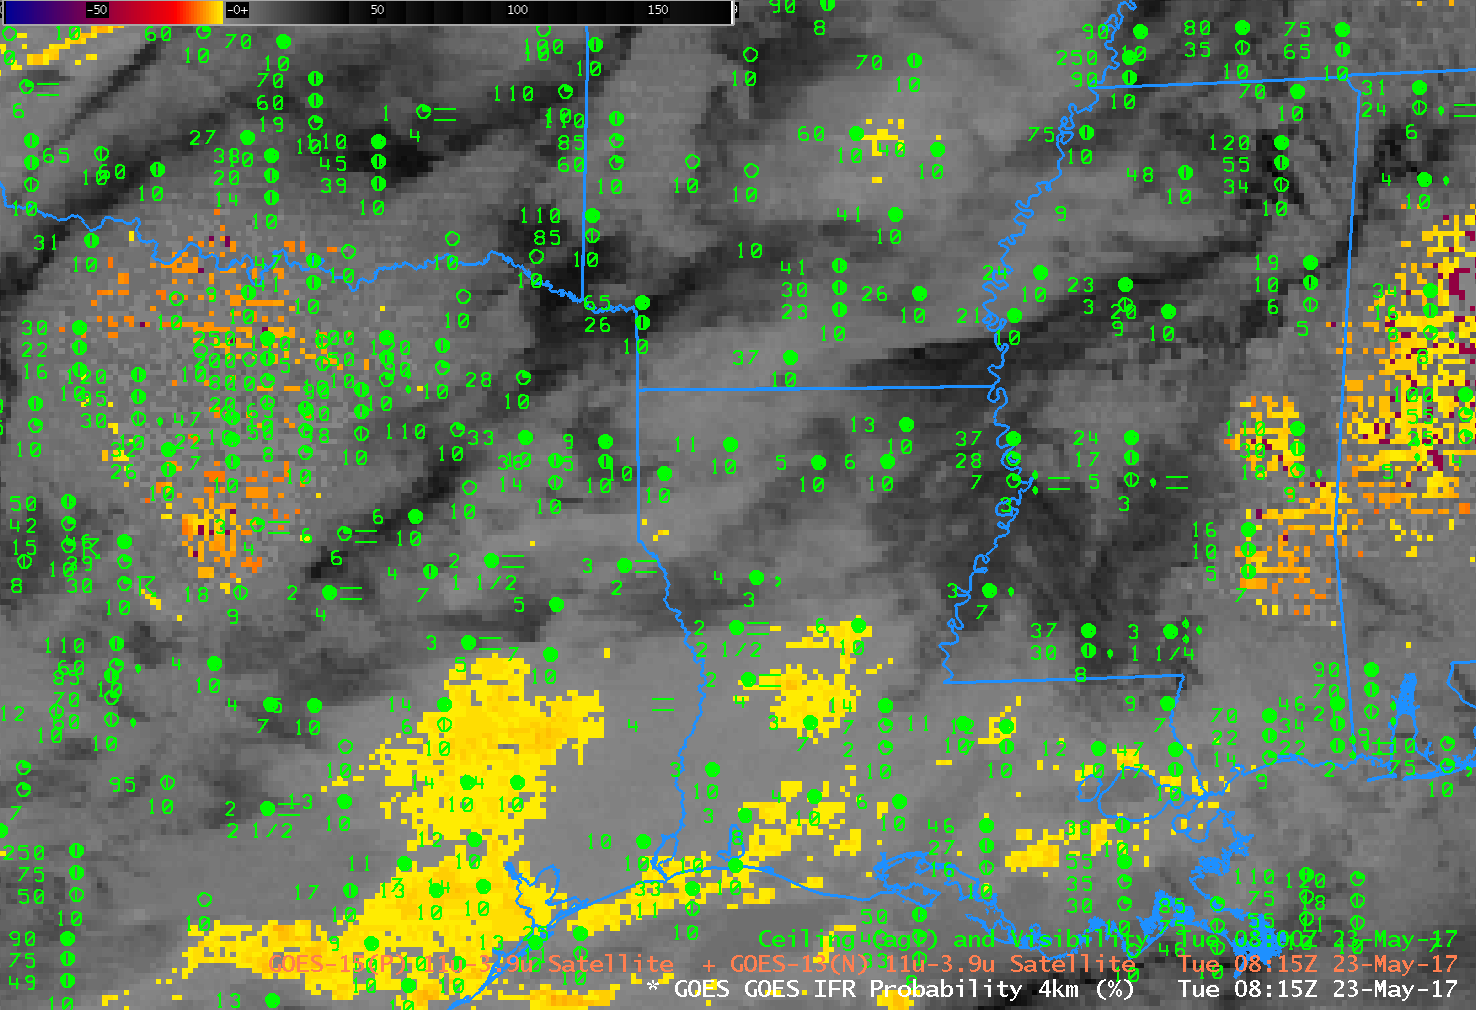
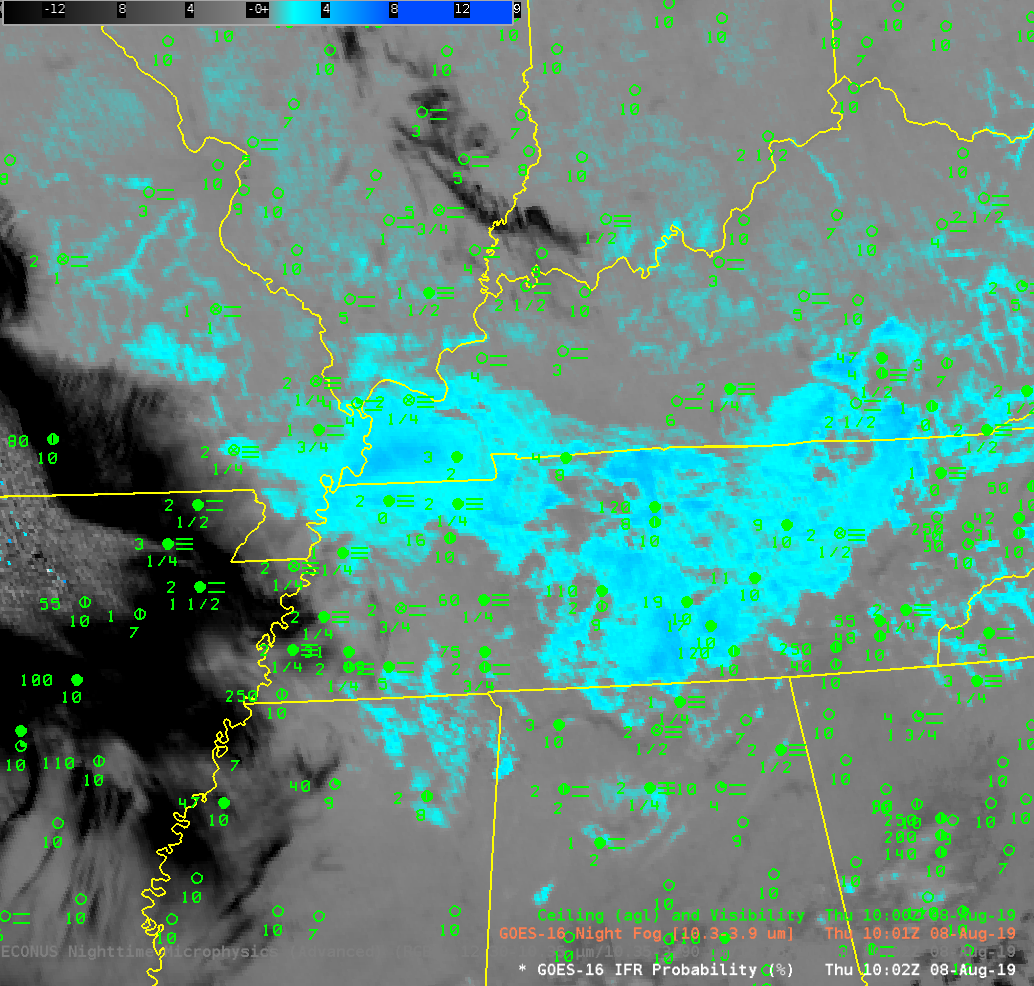
Night Fog Brightness Temperature difference (10.3 µm – 3.9 µm) fields, below, also show the region of stratus clouds. But this satellite-only product does not contain information on how dense the fog is underneath the cloud top (or even if the stratus cloud is also fog). The combination of model data and satellite data by IFR Probability products gives more information than satellite data alone.

GOES-16 Night Fog Brightness Temperature Difference (10.3 µm – 3.9 µm), 0406 – 1651 UTC on 10 December 2020 (Click to enlarge)

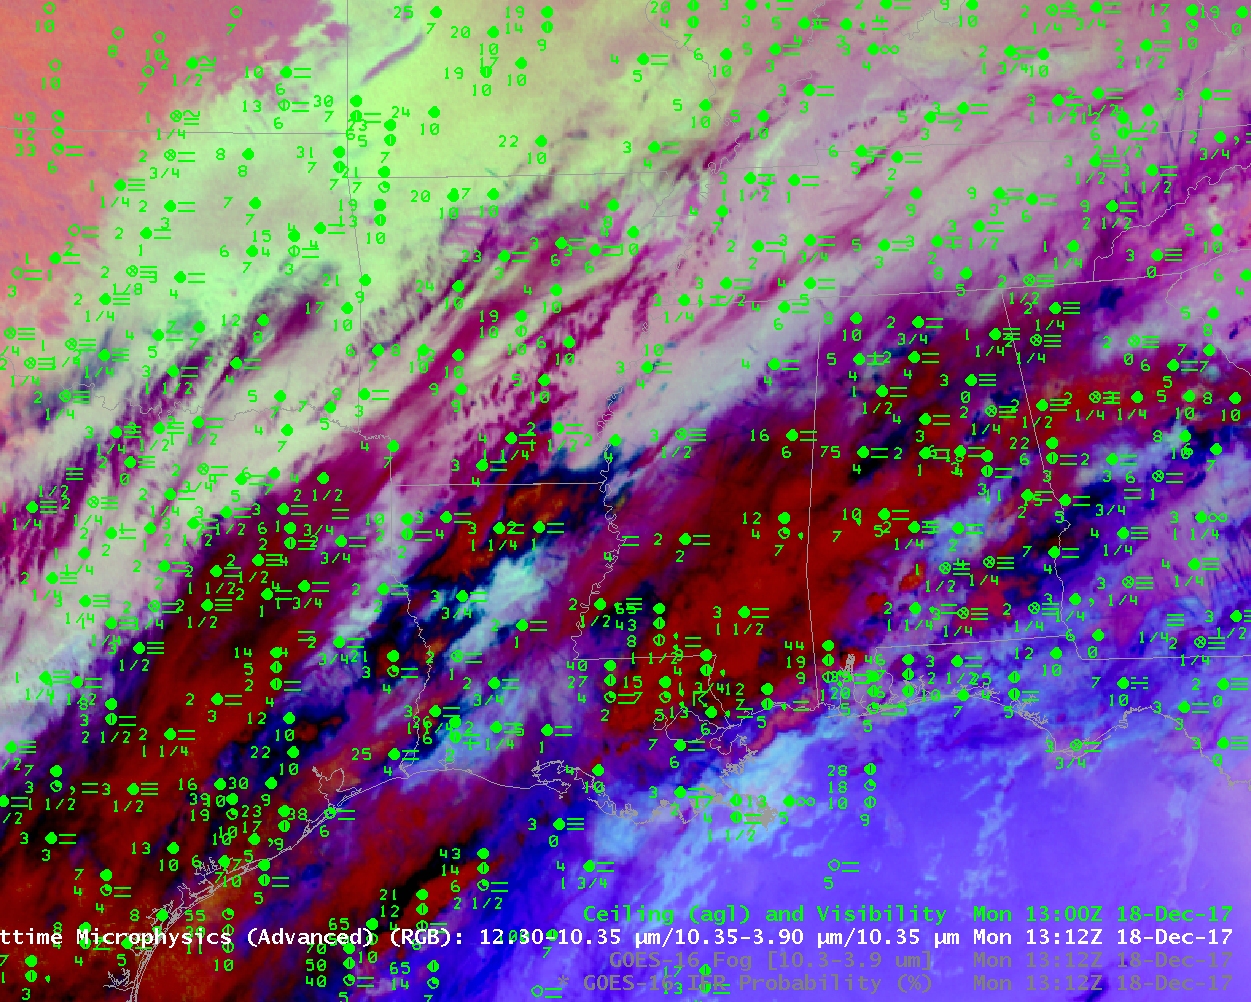
The suite of IFR Probability products includes a GOES-R Cloud Thickness field, shown below overlain on top of a Night Fog Brightness Temperature Difference field. Cloud Thickness is not computed in the 90-120 minutes surrounding sunrise, and the terminator is apparent in the image below, where the Night Fog Brightness Temperature Difference becomes apparent. The thickest cloud (nearly 400 m) is northwest of Lake Ponchartrain. That is where the fog should dissipate last, perhaps.

GOES-R Cloud Thickness field, 1251 UTC, displayed on top of the Night Fog Brightness Temperature Difference field (10.3 µm – 3.9 µm) from the same time (Click to enlarge)

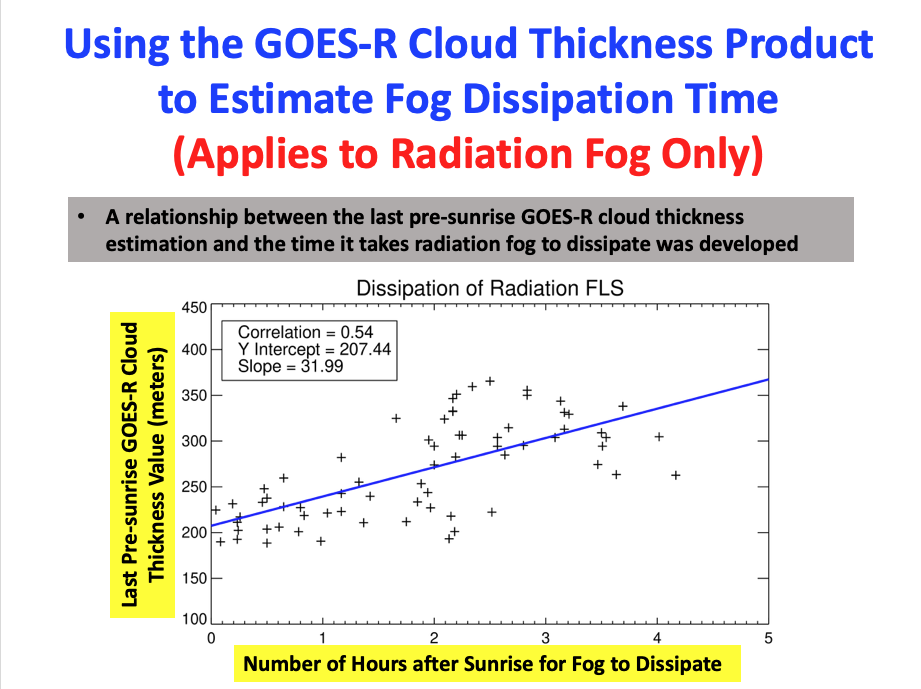
The scatterplot below can be used to estimate when radiation fog might dissipate. It relates the last pre-sunrise observation of GOES-R Cloud Thickness, as shown above, to the number of hours until burn-off. A value of almost 400 m suggests a burnoff nearly four hours after the image above: 1651 UTC. The Thickness field also suggests fog dissipation will be more rapid over southwestern Louisiana than over regions near Lake Ponchartrain. Animations of the Night Fog Brightness Temperature, above, and the visible imagery, below, show that the estimate was a good one on this day.

GOES-16 Band 2 (0.64 µm) visible imagery, 1336 – 1651 UTC on 10 December 2020 (Click to enlarge)

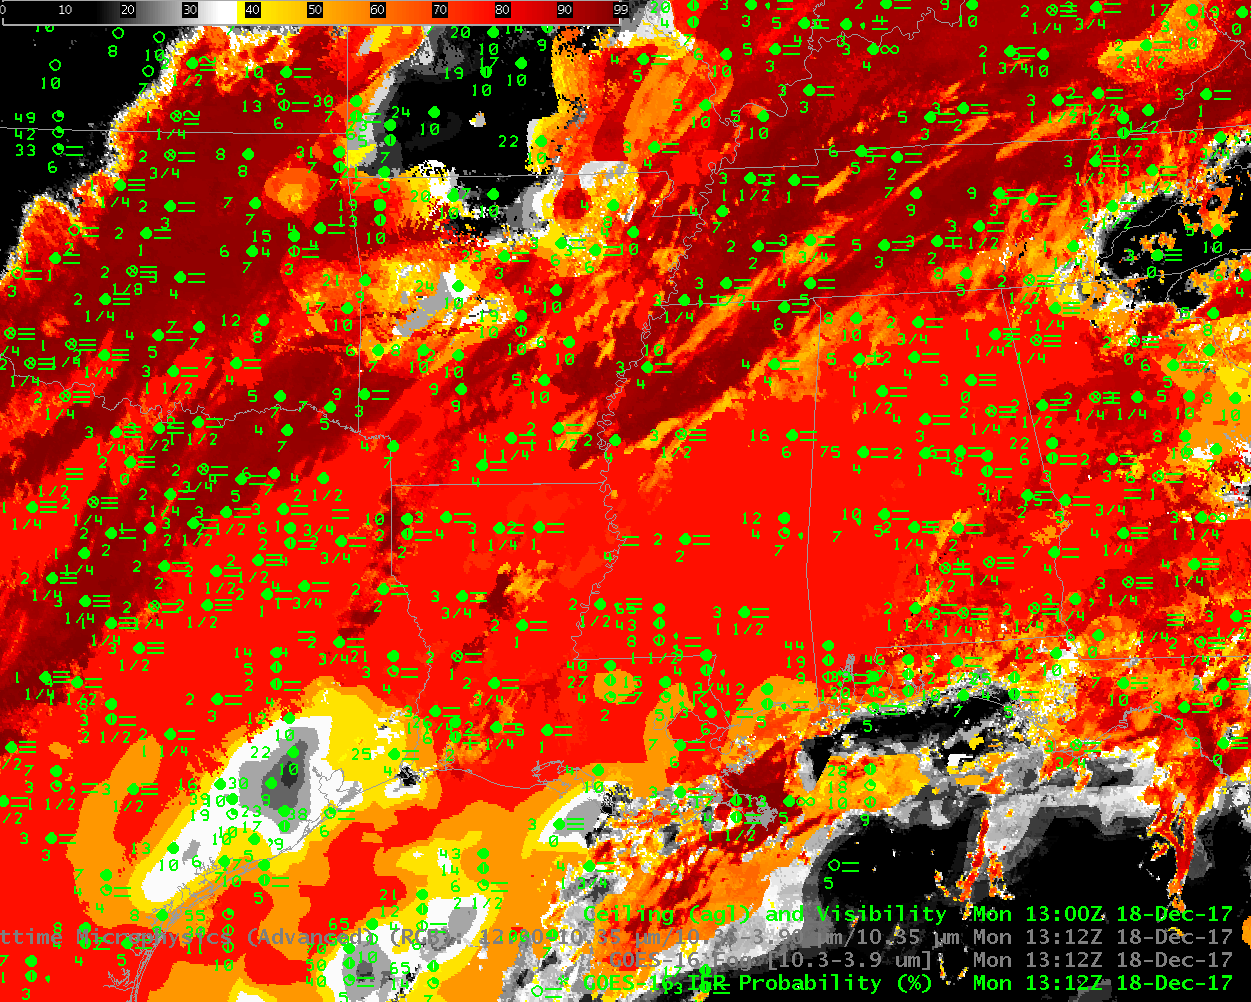
The IFR Probability products include Low IFR Probability, shown above, IFR Probability, and Marginal VFR (MVFR) Probability, in addition to Cloud Thickness. The toggle below, from 0906 UTC, shows that MVFR Probability and Low IFR Probability fields were co-located. As expected, probability of MVFR conditions are greater than probabilities of Low IFR conditions.

GOES-R Low IFR and MVFR Probability, 0906 UTC on 10 December 2020 (Click to enlarge)

Added: Lake Charles WFO also tweeted out this excellent image of a Fog Bow as the fog dissipated!

Fog in the Mid-South on August 8th

GOES-R IFR Probability, 1002 UTC on 8 August 2019, along with surface reports of ceilings and visibility (Click to enlarge)

GOES-R IFR Probability fields from 1002 UTC on 8 August 2019, above, show a region of high probabilities mostly colocated with surface observations of ceilings and visibilities.  IFR conditions are widespread from north of Memphis TN to southern Illinois.  IFR Probability is a fused product, using both satellite imagery to detect low clouds and Rapid Refresh model data to identify regions of low-level saturation.  Where both indicators are present (for example, over extreme western Kentucky and adjacent regions of southern Illinois and northwest Tennessee), IFR Probabilities are very high and IFR conditions are observed.  There are also regions where only model data can be used — because satellites are not detecting low clouds (because high clouds are blocking the view);  such a case is over northwest Arkansas, where IFR Probabilities are high (albeit not as high as over western Kentucky) and the field is not pixelated like a satellite image can be.  IFR Conditions are observed there as well.  (Click here for a screen shot from later in the morning of the Paducah National Weather Service office front page showing Dense Fog Advisories in Tennessee, issued by the Memphis Forecast Office).

The toggle below compares the IFR Probability field with the GOES-16 ‘Night Fog’ brightness temperature difference.  There is no consistent signal in the brightness temperature difference field to indicate fog on the ground.  The color enhancement for the brightness temperature difference is created so that teal to blue is positive.  Clouds made of liquid water droplets — such as stratus, or fog — will have a strong positive value because of the emissivity properties of small water droplets.  (That is, those droplets emit 10.3 µm radiation mostly as a blackbody would, but do not emit 3.9 µm radiation as a blackbody would).  Note in particular the very dark enhancement over northwest Arkansas (suggestive of cirrus there that will block any satellite view of low clouds) and the grey enhancement over west central Tennessee, north of Memphis, where mid-level clouds are similarly blocking a good view of the stratus at the surface.

GOES-16 IFR Probability and GOES-16 ‘Night Fog’ Brightness Temperature Difference field (10.3 µm – 3.9 µm) at 1002 UTC on 8 August 2019 (Click to enlarge)

The Nighttime Microphysics RGB can also be used to alert forecasters to fog — but a main component of that detection is the Night Fog brightness temperature difference field, and where the Night Fog brightness temperature difference fails to identify fog, as above, Nighttime Microphysics will as well, as shown in the toggle below.  Which color is useful for identifying fog in the RGB below?  Almost all of them!

Fog over the mid-South

GOES-16 IFR Probability fields with a 10-minute time step from 0752-1422 UTC on 25 April 2018 (Click to enlarge)

Dense Fog developed over the mid-south on April 25th, and Dense Fog Advisories were issued by the National Weather Service Forecast Office in Memphis for portions of western Tennessee and northern Mississippi.  GOES-16 IFR Probability fields above, show the development of strong signal in IFR Probability over western Tennessee starting after 0900 UTC.  The satellite signal for this event was weak (see below); the sudden appearance of an IFR Probability signal at 0900 UTC suggests that the Rapid Refresh model simulation quickly changed from insufficient saturation for a strong signal to a better signal of fog when the model simulation valid at 0900 UTC was used.  When IFR Probabilities suddenly change absent a big change in satellite signal, the cause is likely a change in the Rapid Refresh model output.

Night fog Brightness temperature difference, below, shows a weak signal over river valleys of western Tennessee and northwestern Mississippi.

GOES-16 Night Fog Brightness Temperature Difference (10.3 µm – 3.9µm) 0822-1452 UTC on 25 April 2018 (Click to enlarge)

Because the signal in the brighntess temperature difference field is weak, the signal for fog in the Nighttime Microphysics RGB (which has as its green component the Night Fog Brightness Temperature Difference) is also weak. The toggle below shows the Night Fog Brightness Temperature Difference, the RGB, and the IFR Probability fields, all at 0952 UTC on 25 April.

GOES-16 Night Fog Brightness Temperature Difference (10.3 µm – 3.9µm), NIghttime Microphysics RGB and GOES-16 IFR Probability fields, all at 0952 UTC on 25 April 2018 (Click to enlarge)

Cloud Thickness as a Fog Dissipation Predictor

GOES-R Cloud Thickness, 0922-1107 UTC on 11 April 2018 (Click to enlarge)

GOES-R Cloud Thickness can be used (along with this scatterplot) to estimate when fog or low clouds in a region will burn off. This look-up table is most appropriate when used with Radiation Fogs. GOES-R Cloud Thickness is created from a look-up table that was developed using SODAR observations of low clouds off the west coast of the USA and GOES-West (Legacy GOES) observations of 3.9 µm emissivity. These thickness values just before sunrise were then compared to subsequent imagery to determine when the observed fog/low clouds dissipated and the scatterplot was created.

In the case above, the final GOES-R Cloud Thickness field before sunrise conditions occurred at 1107 UTC (Note in the image how low clouds have vanished just off the coast of northeast Florida)   Values over southern Georgia and most of northeast Florida were in the 200-m range:  Very thin!  The scatterplot suggests that such a thickness (equal to about 700 m) will dissipate within an hour. A small strip of somewhat thicker clouds (blue enhancement, suggesting a thickness of 350-400 m) stretched southwestward from Jacksonville to the Gulf of Mexico.

IFR Probabilities during this time before sunrise show enhanced values where IFR and near-IFR conditions are present.  Note that that region of thicker clouds (thicker as diagnosed by the GOES-R Cloud Thickness product) shows higher IFR Probabilities.

GOES-16 IFR Probabilities, 0922 UTC to 1412 UTC on 11 April 2018 (Click to enlarge)

The GOES-16 ‘Night Fog’ Brightness Temperature Difference product, below, shows a small signal over southern Georgia where IFR Conditions are present, and where Cloud Thickness is small.  There is a stronger signal southwest of Jacksonville, which may be one reason that the IFR Probability value there are somewhat stronger than over southern Georgia and extreme northern Florida.  Note also : (1) the sign of the Brightness Temperature Difference flips when the sun rises as increasing amounts of reflected solar 3.9 µm radiation overwhelm the emissivity-driven differences and (2)  the Brightness Temperature Difference field gives little surface information under the cirrus shield over central Florida (or over the Atlantic Ocean).

GOES-16 ‘Night Fog’ Brightness Temperature Difference (10.3 µm – 3.9 µm) from 0922 through 1412 UTC on 11 April 2018 (Click to enlarge)

Visible imagery, below, shows a quick dissipation to the fog and low clouds as expected given their diagnosed thin nature by the Cloud Thickness product.

GOES-16 ABI Visible (0.64 µm) imagery, 1112-1412 UTC on 11 April 2018 (Click to enlarge)

IFR Conditions with a Spring storm over the central United States

GOES-16 IFR Probability fields, every 10 minutes, from 0202 through 1412 UTC on 19 March 2018 (Click to animate)

Dense Fog Advisories (click here for graphical image from this site) and widespread IFR Conditions (click here for graphical image from this site) occurred as a nearly-occluded system spun slowly eastward across the central part of the United States on 19 March 2018. (Surface; 500-hPa). GOES-16 IFR Probability, shown above, (Click the image to see the animation) outlines two large areas where consistent IFR conditions develop/persist: the upper Plains, in states around Nebraska, and the Deep South.

The GOES-16 Night Fog Brightness Temperature Difference field (10.3 µm – 3.9 µm), animation shown below, historically has been used to identify low stratus that is assumed to be fog at night. That detection suffers when high clouds are present (consistently on the morning of 19 March over Nebraska and surrounding states; occasionally over the Deep South as convection expels high-level cirrus into the atmosphere). Because IFR Probability fuses satellite data with Numerical Model estimates of low-level saturation (from the Rapid Refresh Model), it retains a strong signal of fog in regions where multiple clouds layers prevent the satellite from observing observed low stratus causing IFR conditions, such as over Nebraska, or over Mississippi at 0607 UTC.

GOES-16 Night Fog Brightness Temperature Difference (10.3 µm – 3.9 µm), 0202-1412 UTC on 19 March 2018 (Click to animate)

Note that there exists a Brightness Temperature Difference signal over the High Plains of Texas and New Mexico at, for example, 0800-0900 UTC. (See below). Persistent drought exists in that region (linked image from this site) and the dryness can alter the relative emissivities of the soils so that a signal develops (Click here for an earlier example).  There are no clouds in this region;  the Rapid Refresh model shows very dry air and the IFR Probability algorithm correctly diagnoses very small probabilities of IFR conditions.

GOES-16 Night Fog Brightness Temperature Difference (10.3 µm – 3.9 µm), 0802-0902 on 19 March 2018 (Click to enlarge)

Dense Fog over the Deep South

GOES-16 IFR Probability fields, 1312 UTC on 18 December 2017 (Click to enlarge). Ceilings and visibilities are also plotted.

Dense Fog was widespread across the south on Monday morning, 18 December 2017 (See the screen capture below from this site at 1319 UTC).  The GOES-16 IFR Probability field, above, highlights the regions of IFR and near-IFR conditions very well. It has a flat character over much of central Mississippi and Alabama.  These are regions where multiple cloud decks are preventing the satellite from viewing the near-surface clouds, and where Rapid Refresh data are being used as the sole predictor for the probability of IFR conditions.  In contrast, the IFR Probability field over much of Tennessee and Arkansas (for example) has a pixelated look to it — there are small variations over very small distances:  over these two states, higher clouds are not preventing the satellite from viewing near-surface clouds, and satellite data can also be used as a predictor in the IFR Probability fields (See the 10.3 µm – 3.9 µm Brightness Temperature difference field below).

Screen Capture from http://www.weather.gov at 1319 UTC on 18 December 2017 (Click to enlarge). Grey regions are under Dense Fog Advisories.

When high clouds are present, fog detection techniques that rely solely on satellite data struggle to detect low clouds.  Compare the above field, for example, to the 10.3 µm – 3.9 µm Brightness Temperature Difference field (sometimes called the ‘Fog Product’).  In the enhancement used (the default enhancement in AWIPS), fog is depicted as blue (a positive value in the brightness temperature difference) and cirrus/high clouds in black.  There is little signal of Fog over a region where Dense Fog advisories have been issued. Similarly, the Advanced Nighttime Microphysics RGB, below, that relies on the 10.3 µm – 3.9 µm to highlight low clouds that might be fog, also is not indicating fog (a light cream/cyan color, typically) over much of the Deep South.  When cirrus clouds are present, its use, like that of the Fog Brightness Temperature Difference, is of dubious value.

The last figure, at the bottom, toggles between all three fields at 1312 UTC.

GOES-16 Fog Brightness Temperature Difference (10.3 µm – 3.9 µm) field, 1312 UTC on 18 December 2017  (Click to enlarge)

Advanced Nighttime Microphysics RGB, 1312 UTC on 18 December 2017  (Click to enlarge)

GOES-16 IFR Probability, GOES-16 ‘Fog’ Brightness Temperature Difference (10.3 µm – 3.9 µm), and Advanced Nighttime Microphysics RGB, all at 1312 UTC on 18 December 2017 (Click to enlarge)

GOES-16 IFR Probabilities in AWIPS

Visible Imagery and GOES-16 IFR Probability Fields, 2202 UTC on 29 November 2017 (Click to enlarge)

GOES-16 data posted on this page are preliminary, non-operational and are undergoing testing

GOES-16 IFR Probabilities can now be displayed in AWIPS.  This site has included the product for several months now.  The imagery above, however, is from AWIPS, showing a toggle between Visible GOES-16 Imagery (with and without observations of ceiling heights and visibilities), MVFR (Marginal Visible Flight Rules) Probabilities, IFR (Instrument Flight Rules) Probabilities and LIFR (Low Instrument Flight Rules) Probabilities.  GOES-16 IFR Probability fields are Bayesian and have been trained using about 2 months’ worth of GOES-16 Data.  The LDM data feed will be providing data once GOES-16 Data are flowing again, sometime between 14 December and 20 December, when GOES-16 is on station at 75.2 º W Longitude.

GOES-16 IFR Probability, 0642-1137 UTC on 30 November 2017 (Click to enlarge)

Dense Fog covered parts of Florida early on 30 November, and the animated GOES-16 IFR Probability field, above, shows the benefit of GOES-16’s routine 5-minute temporal cadence:  the motion of the fog field is well-captured, and it’s straightforward to use the field to estimate the onset of IFR conditions.  The Advanced Nigthtime Microphysics RGB for the same time period is shown below, and that product does not well indicate the widespread nature of the reduced ceilings and visibilities over northern Florida.

GOES-16 Night-time Microphysics RGB, 0642-1137 UTC on 30 November 2017 (Click to enlarge)

Screen Capture for http://www.weather.gov at 1148 UTC on 30 November 2017 (Click to enlarge)

Dense Fog Advisories were widespread over the southeastern US on the morning of 30 November, as shown by the screen capture above, from 1148 UTC 30 November. The toggle below shows IFR Probabilities and the Advanced Microphysics RGB for 1147 UTC on 30 November.  The 10.3 µm – 3.9 µm Brightness Temperature Difference (BTD) for the same time shown at the bottom. Evidence of multiple cloud decks is apparent in the image. Such mid- and high-level clouds result in an ambiguous signal as far as fog detection goes in both the BTD and in the RGB. IFR Probabilities give a consistent signal in those regions that relies on Rapid Refresh Model output suggesting low-level saturation is present.

GOES-16 IFR Probabilities and the GOES-16 Advanced Microphysics RGB at 1147 UTC on 30 November 2017 (Click to enlarge)

GOES-16 Fog Brightness Temperature Difference (10.3 µm – 3.9 µm), 1147 UTC on 30 November 2017 (Click to enlarge)

Dense Fog Advisories over Memphis

Dense Fog Advisories were issued over Memphis and adjacent portions of the mid-south on Tuesday morning, 7 November. (Click here for a 1230 UTC screen capture from the Memphis National Weather Service webpage). The Advisory text is at the bottom of the post.

GOES-16 Brightness Temmperature Difference field (10.3 µm – 3.9 µm) from 0502 through 1252 UTC on 7 November 2017 (Click to enlarge)

GOES-16 data posted on this page are preliminary, non-operational and are undergoing testing

GOES-R IFR Probabilities are computed using Legacy (Operational) GOES (GOES-13 and GOES-15) and Rapid Refresh model information; Preliminary IFR Probability fields computed with GOES-16 data are available here. IFR Probability fields based on GOES-16 will be available via LDM Request when GOES-16 becomes operational as GOES-East (currently scheduled for some time between 11 and 20 December 2017).

The animation above shows the GOES-16 Brightness Temperature Difference Product (at every 10 minutes, rather than the typical 5-minute temporal cadence of GOES-16 over the continental US) during the night on 7 November.  In the default color enhancement shown, clouds made up of water droplets are show up as cyan and blue whereas higher clouds are black.  Note also the effects of increasing solar reflectance at the end of the animation:  the brightness temperature difference is switching sign as increasing amounts of 3.9 µm radiation are reflected off the clouds.

It could be difficult to use the animation above, alone, to heighten situational awareness of a developing region of fog because of the confounding effects of higher clouds.  Additionally, infrared satellite imagery is challenged to detect cloud thickness:  are the stratus clouds detected (cyan/blue in the enhancement) mid-level, low-level or both?

IFR Probability fields can screen out regions of mid-level stratus, regions that are not so important from the point of view of transportation.  This is because Rapid Refresh Model output is used as a predictor in the statistical model underlying IFR Probability fields.  If the Rapid Refresh Fields do not show low-level near-saturation, the IFR Conditions are less likely.

Consider, for example, the animation below of IFR Probability fields computed for GOES-13 data.  At the beginning of the animation, the fields clearly distinguish between regions where dense fog is occurring near Memphis, and where mid-level stratus is more common (over northern Mississippi).  As dawn approaches, reports of fog become more widespread over Mississippi — but the product has given a timely alert to how conditions might differ over a short region that was not possible with the single brightness temperature difference product alone.

GOES-13 IFR Probability fields, hourly from 0315-1215 UTC on 7 November 2017 (Click to enlarge)

GOES-R IFR Probabilities are available via an LDM feed to National Weather Service Offices. At present, IFR/Low IFR and Marginal IFR Probabilities (and Cloud Thickness) fields that are sent are those created by the operational GOES-East Satellite, GOES-13.  IFR Probability Products based on GOES-16 are being produced now, however, and are available here. The short animation below shows a behavior similar to the product based on GOES-13, but GOES-16 has far better temporal and spatial resolution!  Click here for a toggle between GOES-13 IFR Probabilities, GOES-16 Brightness Temperature Difference Fields, and GOES-16 IFR Probabilities at 0715 UTC.

When GOES-16 is operational as GOES-East, currently scheduled to occur between 11 and 20 December 2017, the LDM feed will supply GOES-East IFR Probabilities computed with GOES-16 data.

GOES-16 IFR Probabilities, 0402-0557 UTC on 7 November 2017 (Click to enlarge)

Suomi NPP flew over the region at 0740 UTC on 7 November, and there was ample illumination to see the clouds. Multiple cloud decks and levels are apparent below.

Suomi-NPP Day Night Visible Imagery (0.70 µm) Near-Constant Contrast Product, 0741 UTC on 7 November 2017 (Click to enlarge)

URGENT – WEATHER MESSAGE
National Weather Service Memphis TN
1228 AM CST Tue Nov 7 2017

…A Dense Fog Advisory is in Effect for Portions of the Midsouth
including the Memphis Metro Area…

ARZ036-048-049-MSZ001>004-007-008-TNZ088>090-071500-
/O.EXT.KMEG.FG.Y.0025.171107T0700Z-171107T1500Z/
Crittenden-St. Francis-Lee AR-DeSoto-Marshall-Benton MS-Tippah-
Tunica-Tate-Shelby-Fayette-Hardeman-
Including the cities of West Memphis, Forrest City, Marianna,
Southaven, Olive Branch, Holly Springs, Ashland, Ripley MS,
Tunica, Senatobia, Bartlett, Germantown, Collierville, Memphis,
Millington, Somerville, Oakland, and Bolivar
1228 AM CST Tue Nov 7 2017

…DENSE FOG ADVISORY NOW IN EFFECT UNTIL 9 AM CST THIS MORNING…

* VISIBILITY…Less than one-half mile.

* TIMING…Through 9 AM CST Tuesday.

* IMPACTS…Dense fog will most commonplace outside of the
Memphis urban center and near bodies of water. Travel may
become difficult due to limited visibilities.

PRECAUTIONARY/PREPAREDNESS ACTIONS…

A Dense Fog Advisory means visibilities will frequently be
reduced to less than one quarter mile. If driving…slow down…
use your low beam headlights…and leave plenty of distance ahead
of you.

&&

$$

JAB

Dense Fog over Missouri and over Alabama

GOES-R IFR Probability Fields, Hourly from 0215-1315 UTC on 19 September 2017 (Click to enlarge)

GOES-R IFR Probabilities are computed using Legacy GOES (GOES-13 and GOES-15) and Rapid Refresh model information; GOES-16 data will be incorporated into the IFR Probability algorithm in late 2017

Dense fog developed over Missouri on Tuesday 19 September and Dense Fog Advisories were issued. The animation above shows the hourly development of GOES-R IFR Probability fields; values increased from northern Missouri to southern Missouri as dense fog developed, first north of I-70, then south into the rest of the state. The morning of 19 September was mostly devoid of mid-level and high-level clouds over Missouri (exception: west-central Missouri starting after 0900 UTC), and that kind of night means that traditional methods of fog detection work well. The brightness temperature difference field between the shortwave Infrared and the Longwave Infrared (3.9 µm and 10.3 µm on GOES-16, 3.9 µm and 10.7 µm on GOES-13) shows the fog development.

Note that the IFR Probability field, above, does not show fog dissipating around sunrise. That’s in contrast to the Brightness Temperature Difference field below. As the sun rises, the amount of solar radiation at 3.9 µm that is reflected off the clouds increases; this changes the brightness temperature difference from positive (cyan in the color enhancement shown) to negative (grey or black in the enhancement shown).

GOES-16 has better spatial resolution than GOES-13; thus, the small valley fogs that can develop in the rugged (ish) terrain of southern Missouri are resolved in GOES-16, but not in GOES-13. When GOES-R IFR Probability is created using GOES-16 data (slated to begin in late 2017), the resolution improvements in GOES-16 will migrate to IFR Probability fields.

GOES-16 data posted on this page are preliminary, non-operational and are undergoing testing.

GOES-16 Brightness Temperature Difference (10.3 µm – 3.9 µm), hourly from 0412 to 1112 UTC on 19 September (Click to enlarge)


==========================================================
On 20 September, Dense Fog developed over Tennessee and Alabama, leading to the issuance of Dense Fog Advisories. The GOES-R IFR Probability field, below, shows good agreement between high probabilities and reduced ceilings/visibilities.

GOES-R IFR Probability Fields, Hourly from 0415-1315 UTC on 20 September 2017 (Click to enlarge)

As on the 19th over Missouri, top, this was a night with relatively few middle- and upper-level cloud decks. On such nights, the GOES-16 Brightness Temperature Difference field can capably identify regions of stratus (it’s up to a human to decide if the stratus deck extends to the surface; on this night, much of the stratus did). The 2-hour animation of Brightness Temperature Difference, below, highlights two particular strengths of GOES-16: Better spatial resolution that allows small valleys to be sampled correctly, and good temporal resolution (every 5 minutes vs. every 15 minutes for GOES-13) that allows superior monitoring of the cloud evolution with time. Note that the rising sun is eroding the GOES-16 Brightness Temperature Difference signal by the end of the animation below.

GOES-16 Brightness Temperature Difference (10.3 µm – 3.9 µm), hourly from 1002 to 1202 UTC on 20 September (Click to enlarge)

The Brightness Temperature Difference field (10.3 µm – 3.9 µm) is a key component to the Nighttime Microphysics Red/Green/Blue Composite. As the toggle below shows, the Brightness Temperature Difference field overwhelmingly controls the region identified by the RGB as one with a potential for fog.

Dense Fog under high clouds in the Deep South

GOES-13 Brightness Temperature Difference (3.9 µm – 10.7 µm) Values at 0815 UTC on 23 May 2017 (Click to enlarge)

Note: GOES-R IFR Probabilities are computed using Legacy GOES (GOES-13 and GOES-15) and Rapid Refresh model information; GOES-16 data will be incorporated into the IFR Probability algorithm in late 2017

The legacy method of detecting fog/low clouds from satellite is the Brightness Temperature Difference product that compares computed brightness temperatures at 3.9 µm and at 10.7 µm. At night, because clouds composed of water droplets do not emit 3.9 µm radiation as a blackbody, the inferred 3.9 µm brightness temperature is colder than the brightness temperature computed using 10.7 µm radiation. In the image above, the brightness temperature difference has been color-enhanced so that clouds composed of water droplets are orange — this region is mostly confined to southeast Texas. Widespread cirrus and mid-level clouds are blocking the satellite view of low clouds. IFR and near-IFR conditions are widespread over east Texas, Louisiana and Mississippi. The GOES-R IFR Probability field, below, from the same time, suggests IFR conditions are likely over the region where IFR conditions are observed.

This is a case where the model information that is included in this fused product (that includes both satellite observations where possible and model predictions) fills in regions where cirrus and mid-level clouds obstruct the satellite’s view of low clouds.. As a situational awareness tool, GOES-R IFR Probability can give a more informed representation of where restricted visibilities and ceilings might be occurring.

IFR Conditions continued into early morning as noted in this screenshot from the Aviation Weather Center.

GOES-R IFR Probability fields, 0815 UTC on 23 May 2017 (Click to enlarge)