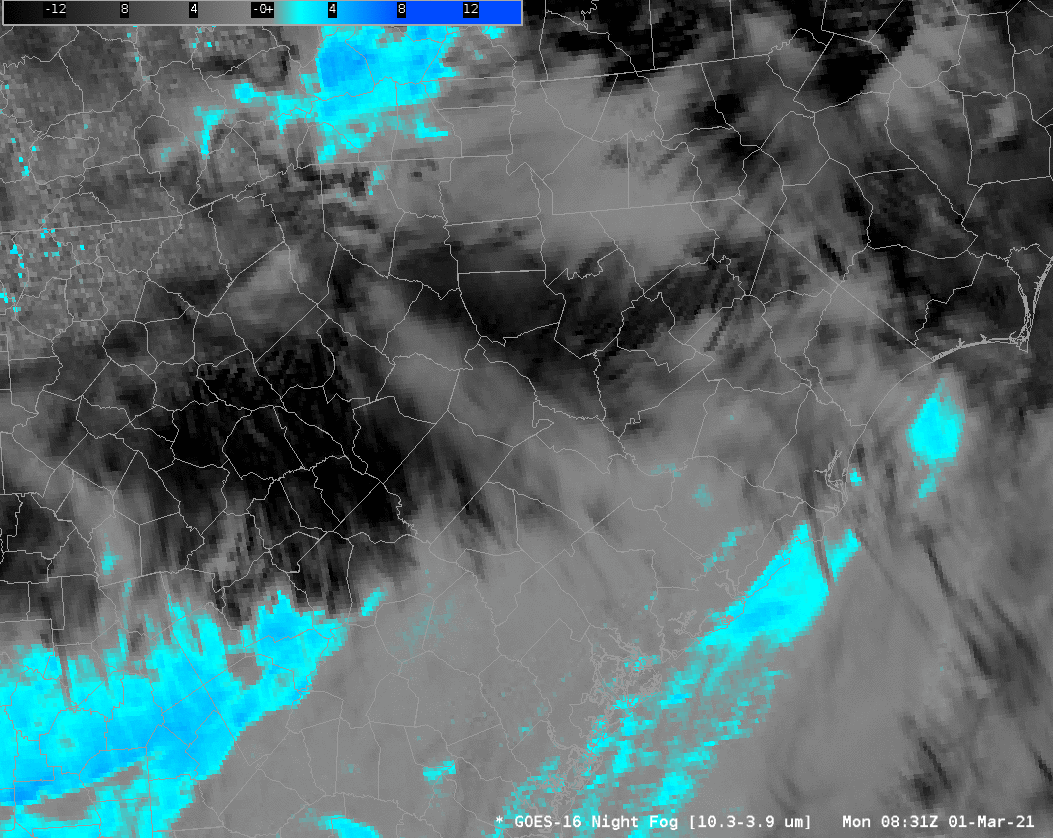
GOES-16 Night Fog Brightness Temperature Difference (BTD) fields (10.3 µm – 3.9 µm), above, show different cloud types in and around South Carolina before and through sunrise on 1 March 2021. Before sunrises, low clouds — stratus and fog — are characterized by blue/cyan/aqua colors in this enhancement. The positive brightness temperature difference arises because of emissivity differences in small cloud droplets for shortwave (3.9 µm) and longwave (10.3 µm) infrared radiation. Negative brightness temperature differences occur for higher clouds.
The presence of high clouds interferes with the satellite’s ability to view low clouds. Although one can infer a low cloud’s presence from an animation (and the assumption that the cloud doesn’t substantively change when a high cloud overspreads it), it’s a bit more difficult to extrapolate the cloud base from the cloud top behavior. In other words: Are the low clouds highlighted actually fog? Note also how the BTD enhancement changes as reflected solar radiation around sunrise starts to overwhelm any differences attributable to emissivity.
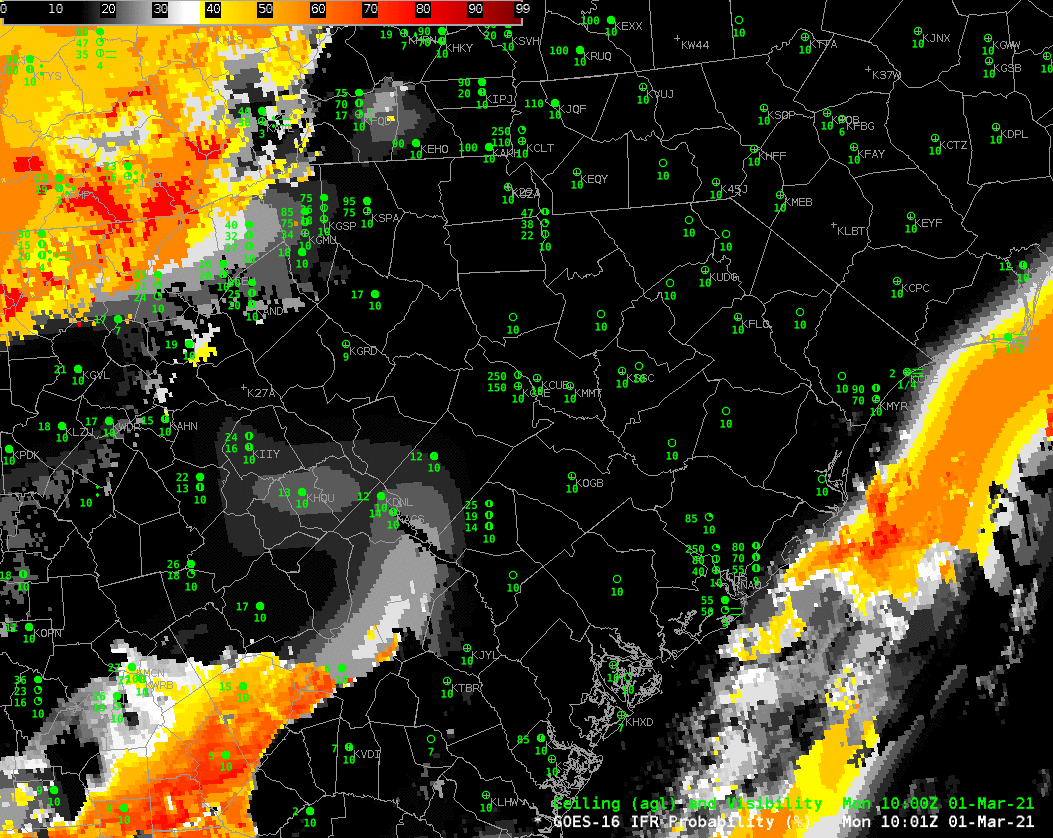
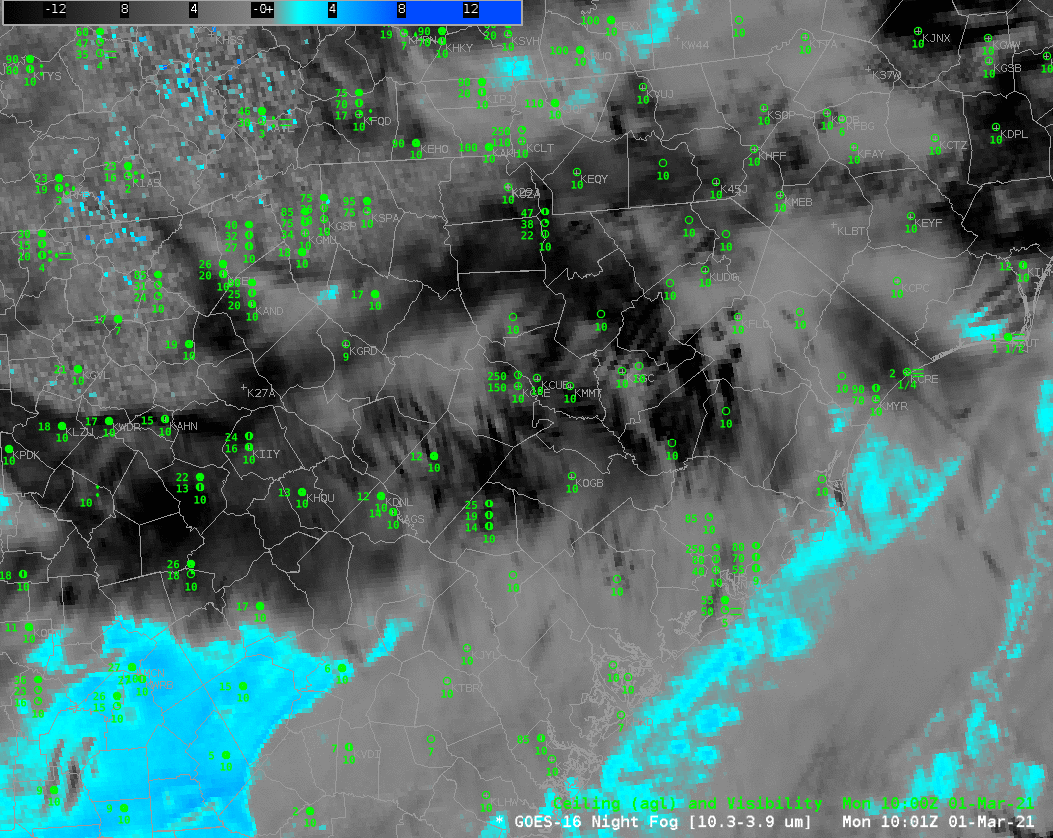
IFR Probability fields, shown below, combine the strength of satellite detection of low clouds with the strength model depiction of low-level saturation. IFR Probabilities will be quite high where satellites detect low clouds, and where Rapid Refresh model simulations show near-surface saturation. But if high clouds are in the way, IFR Probabilities can still be large if the Rapid Refresh model shows low-level saturation. This is occurring off the coasts of South and North Carolina. Note also: IFR Probability fields aren’t changing radically as the sun rises.
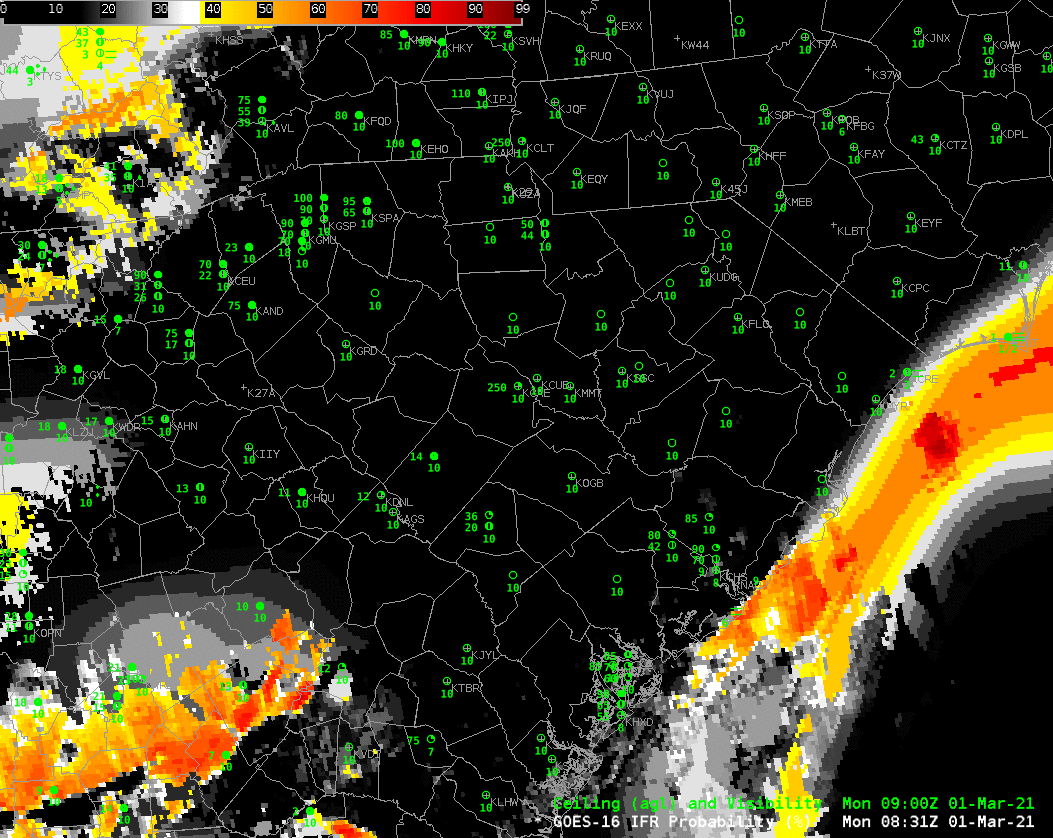
The toggle above compares the Night Fog BTD with the Night time microphysics RGB (an RGB that takes as its green component the Night Fog BTD), and the GOES-16 IFR Probability fields at 1001 UTC on 1 March, shortly before sunrise. There is an obvious relationship between the RGB color and the regions of low clouds highlighted in the BTD by blue/cyan/aqua colors; the color of the RGB is tempered by the cloud temperature, however: the blue component of the RGB is the longwave infrared brightness temperature, and that is different over the ocean compared to over southwestern Georgia (for example). Note also how IFR Probability shows large values under the deep clouds over northwest South Carolina/western North Carolina.
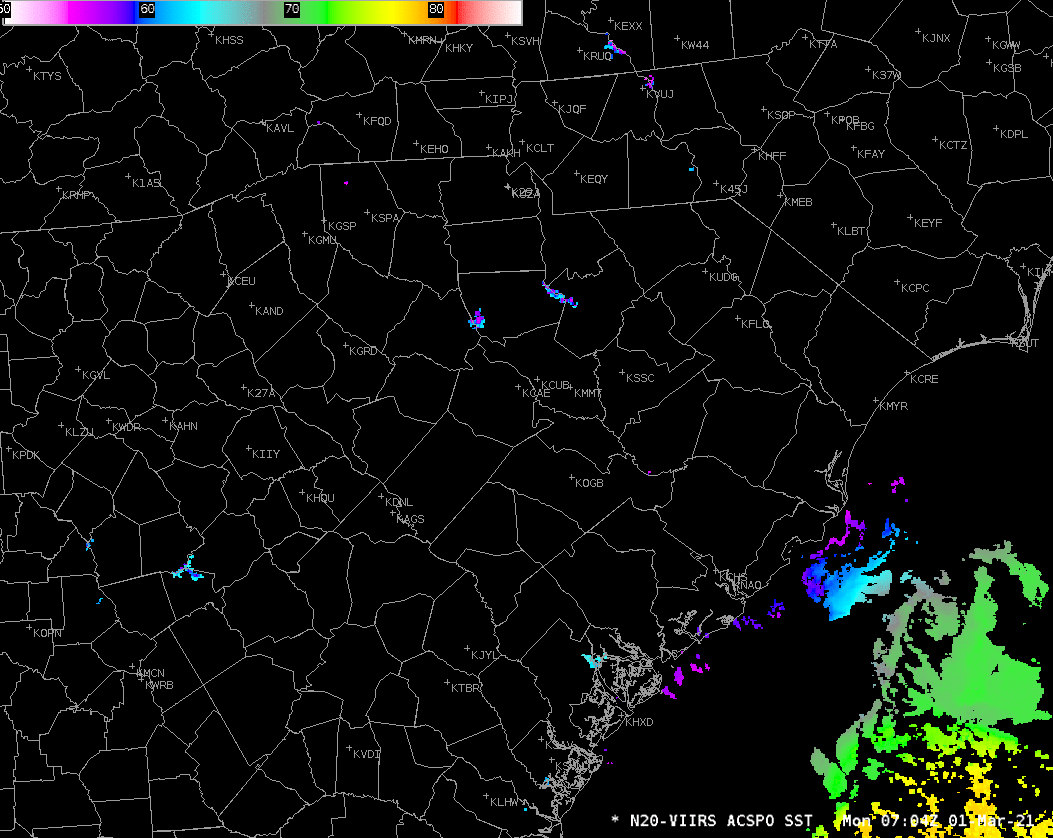
Why is fog occurring offshore? Moist air over South Carolina is moving over relatively cool shelf waters, and cooled to its dewpoint; advection fog is the result. The toggle below shows surface dewpoints in the low 60s over coastal South Carolina. Sea-surface temperatures, shown at bottom from VIIRS at 0700 UTC and GOES-16 at 1300 UTC, show cool shelf waters with surface temperatures in the 50s (F).