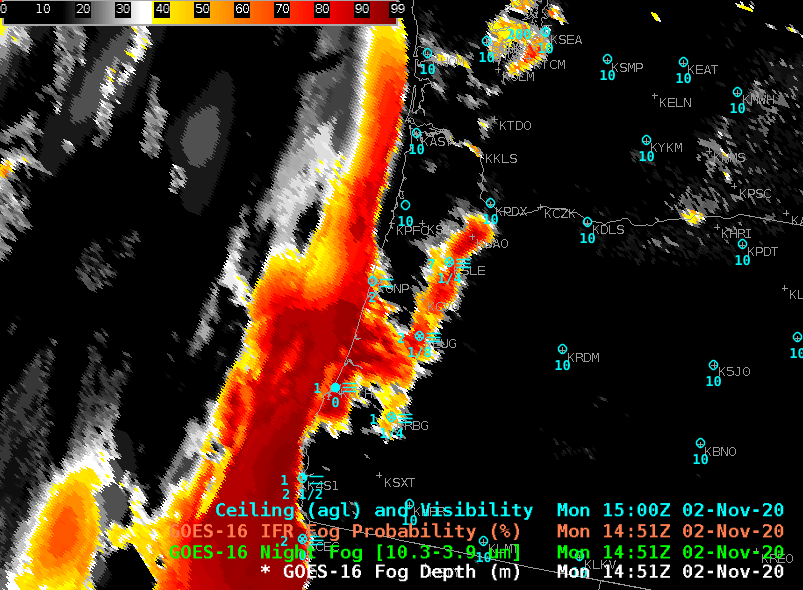
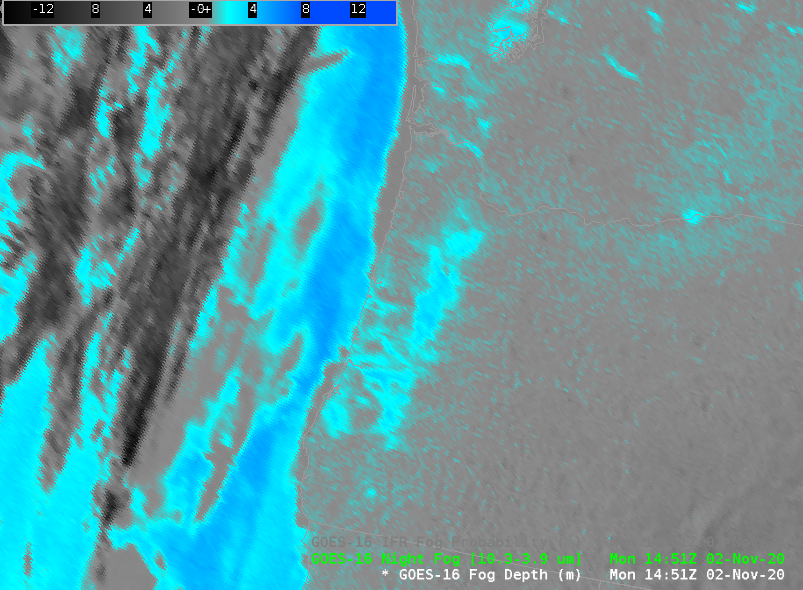
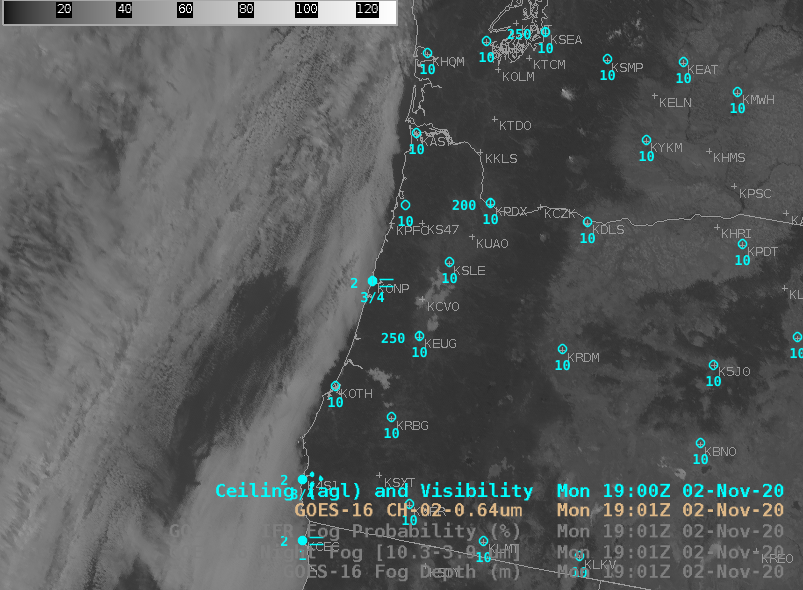
GOES-16 IFR Probability fields, above, show very high IFR Probability values over the Willamette Valley of Oregon to the south of Portland; surface observations in the region show IFR conditions from Salem (KSLE) southward through Eugene (KEUG) to Roseburg (KRBG). IFR Probability is also large along the coast, with IFR conditions reported at Newport (KONP) and North Bend (KOTH). The 10.3 µm – 3.9 µm “Night Fog” Brightness Temperature Difference field, below, also has a modest signal in the Valley, and along the coast, giving a qualitative (but not quantitative) estimate of fog.
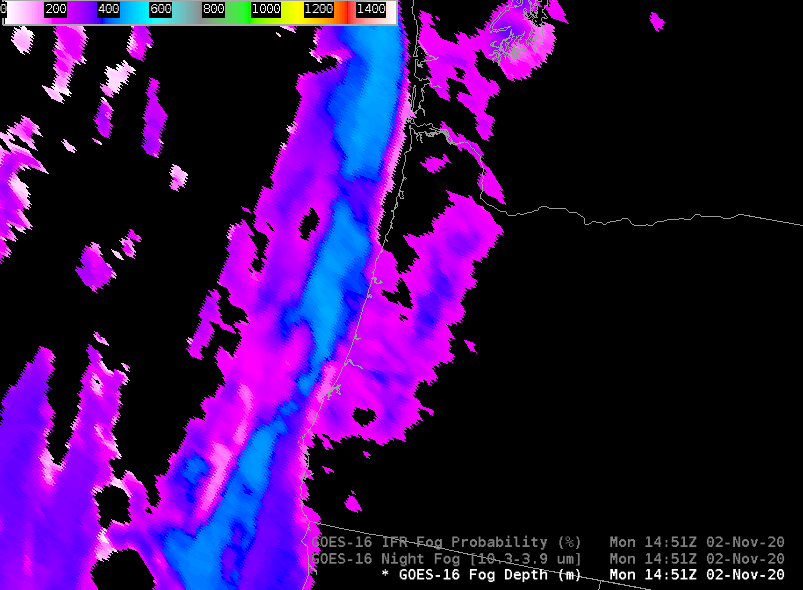
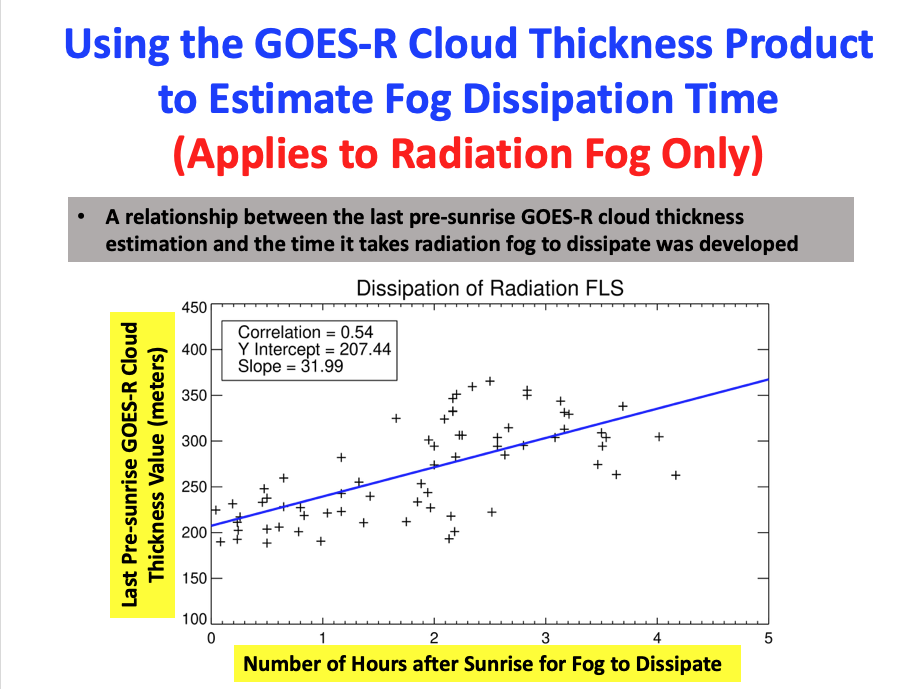
GOES-R Cloud Thickness (labeled as Fog Depth in TOWR-S Build 19) can be used to estimate radiation fog dissipation time. Values are not computed during the time of rapidly-changing reflected solar radiance (i.e., for the times around sunrise and sunset); the last pre-sunrise value can be used in concert with this scatterplot to estimate burn-off times. Values at 1451 UTC in the Willamette valley peak at around 380 m. This suggests a burn-off time (if this is radiation fog and not advection fog) of about two hours according to the scatterplot below, i.e., shortly before 1700 UTC.
Visible imagery, below, at 1601 and 1706 UTC do show a trend towards clearing. The scatterplot can underestimate clearing time if (1) the sun angle is lower than at the points used to create the scatterplot or (2) if the fog is not strictly a radiation fog. In either event, however, the values from day to day should give useful information. For example, if today’s last pre-sunrise cloud thickness is greater than yesterday’s, then the burn-off time today should be later than yesterday.
Fog/low stratus dissipated shortly after the 1901 UTC image shown above.