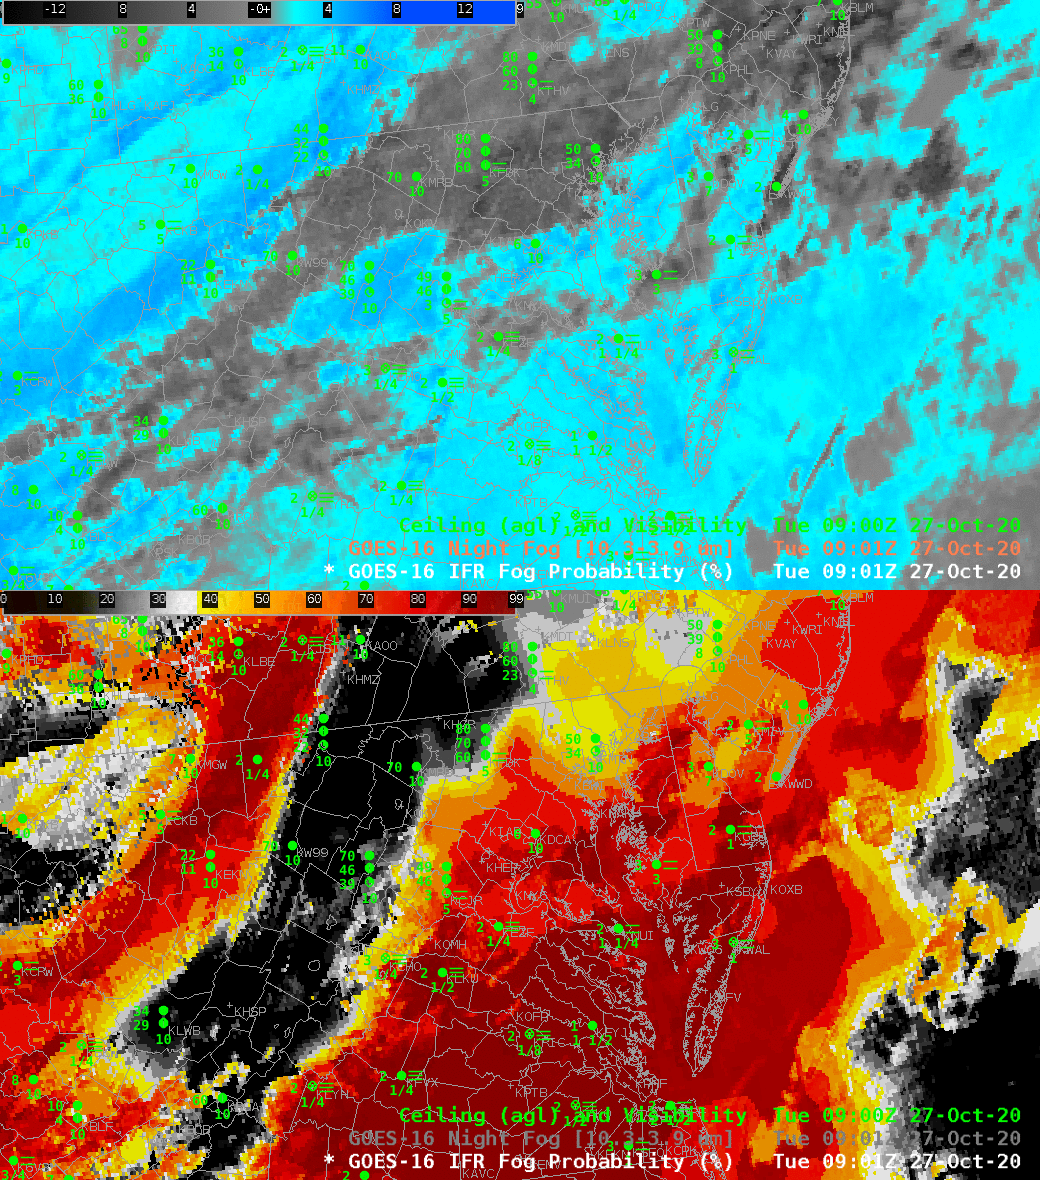
GOES-16 IFR Probability fields, above, from 0901 UTC on 27 October 2020 (in a toggle with the Night Fog Brightness Temperature Difference), outline two regions of likely IFR conditions over Virginia and surrounding states. Southern Virginia shows restricted conditions, as does the high terrain along the spine of the Appalachians, extending up to Johnstown PA. (Surface observations largely agree with IFR Probability fields: IFR Probability is high where ceilings are low and visibilities are restricted; IFR Probability is low in regions where IFR conditions are not occurring).
Night Fog Brightness Temperature Difference fields (10.3 µm – 3.9 µm), struggle to identify regions of IFR conditions — elevated stratus (over western Virginia and western Maryland, for example) has a similar signal to fog over southeastern Virginia. There are also regions of high clouds above the low stratus over Maryland and Virginia surrounding middle Chesapeake Bay. In such regions, high IFR Probability is being driven by Rapid Refresh model predictions of low-level saturation.
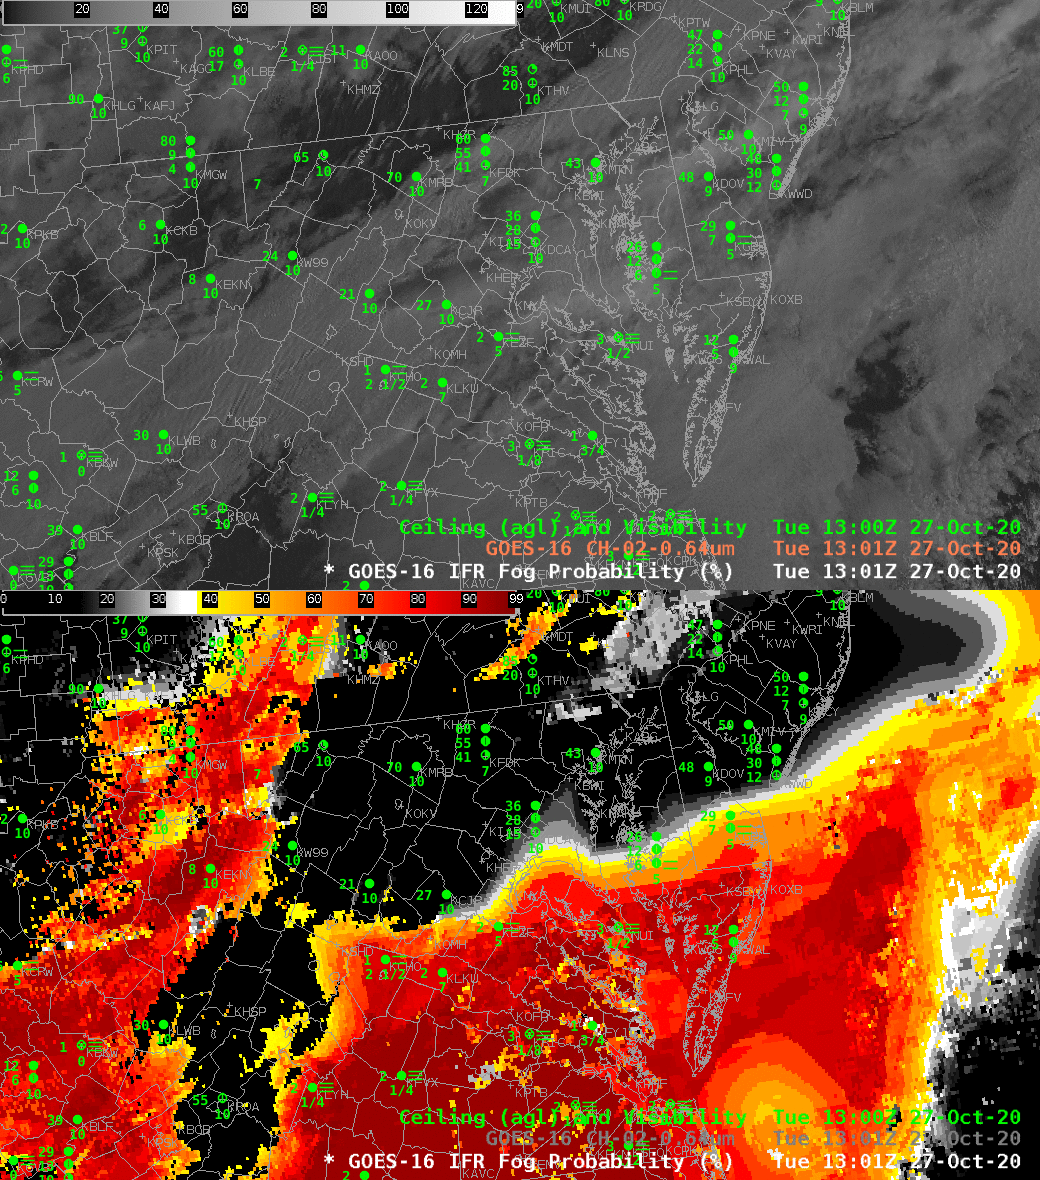
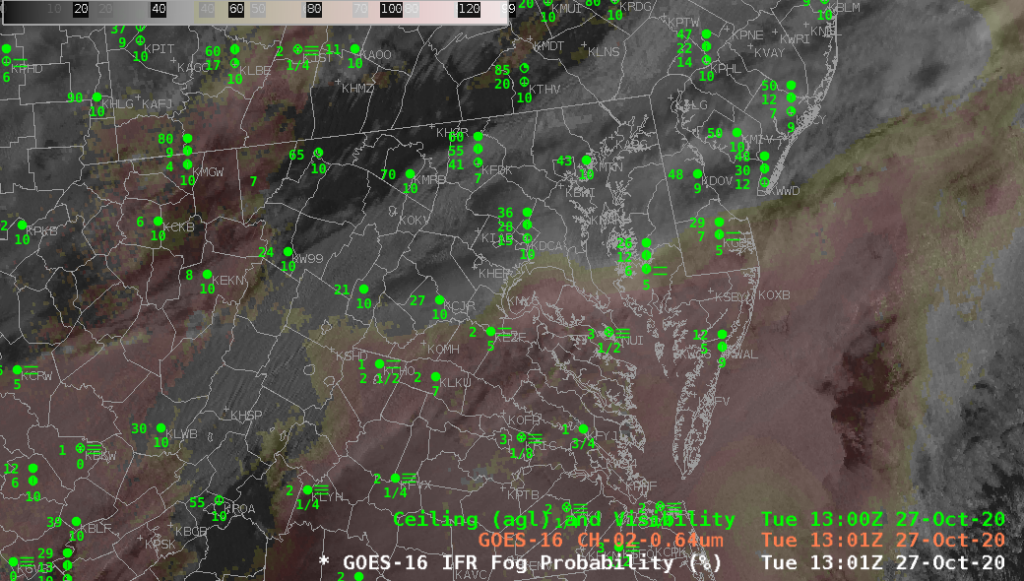
Visible imagery (0.64 µm) toggled with the IFR Probability fields at 1301 UTC, below, show how IFR Probability fields can better discriminate between stratus and fog than visible imagery alone.

Use IFR Probability fields to identify regions that have low ceilings and reduced visibilities when Visible imagery (in the day) and Night Fog Brightness Temperature difference (at night). During the day time, this can be achieved by displaying both images at once.

