
Dense Fog Advisory issued by Goodland Kansas on 19 August 2019 (Click to enlarge)
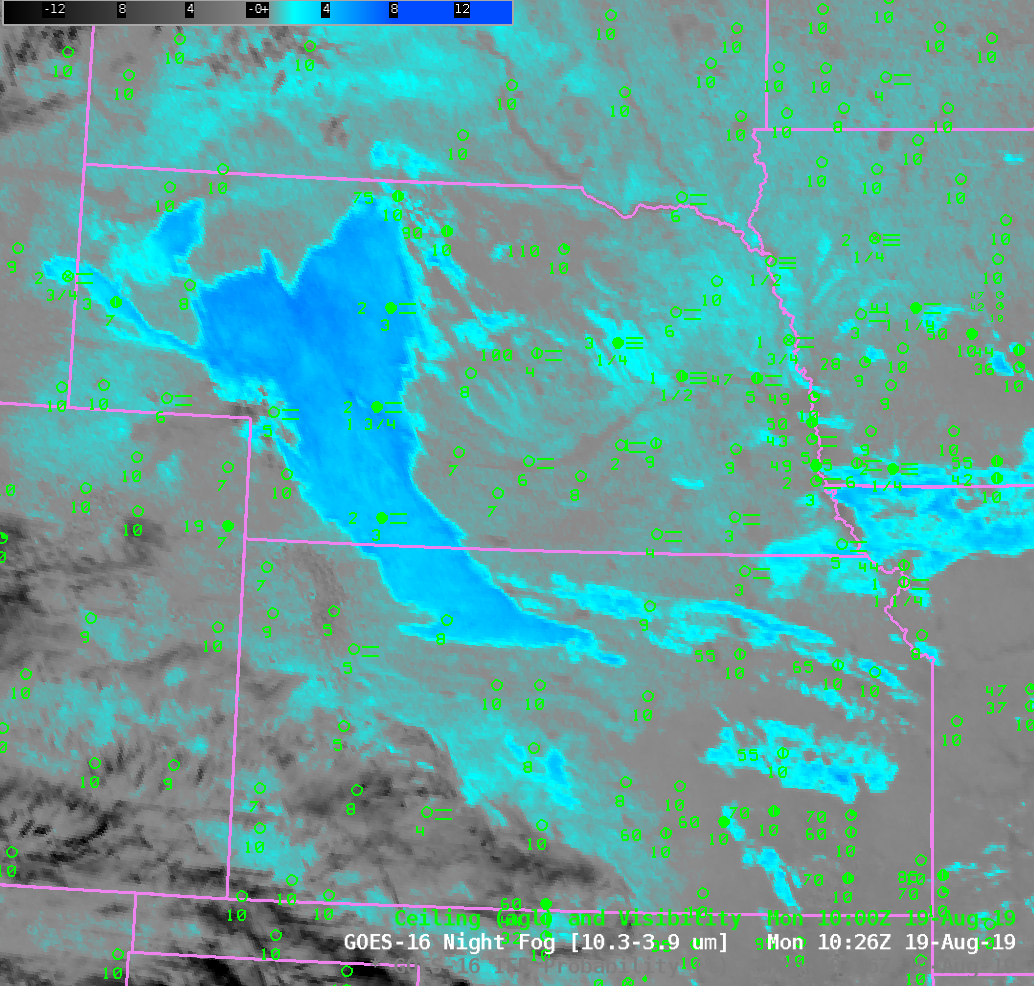
Dense Fog developed over portions of the central Plains on Monday morning, 19 August 2019; The Goodland Kansas office of the National Weather Service issued Dense Fog Advisories for part of their County Warning Area, as shown above. A variety of satellite-based products are useful for monitoring dense for from satellite. The one used for the longest time is the so-called Night Fog Brightness Temperature Difference field, shown below, that detects (in blue/cyan, in the default AWIPS color enhancement used) clouds that contain water droplets. Small water droplets do not emit 3.9 µm radiation as a blackbody would, but they do emit 10.3 µm radiation as a blackbody. Thus the brightness temperature that is computed by detecting via satellite the amount of radiation emitted and converting those numbers of photons to an emitting temperature (a conversion that does assume blackbody emission!) will be warmer for 10.3 µm radiation than for at 3.9 µm radiation. An animation of that field is shown below.

GOES-16 ABI ‘Night Fog’ brightness temperature difference field (10.3 µm – 3.9 µm), 1026 – 1421 UTC on 19 August 2019 (Click to animate)
Note in the animation above that dense fog over the higher Plains or western Kansas and Nebraska is well-articulated by this field; dense fog over Iowa and eastern Nebraska is not depicted with clarity. The animation also shows a well-known feature of the Night Fog Brightness Temperature difference field — it loses a signal during sunrise as the amount of reflected 3.9 µm radiation increases.
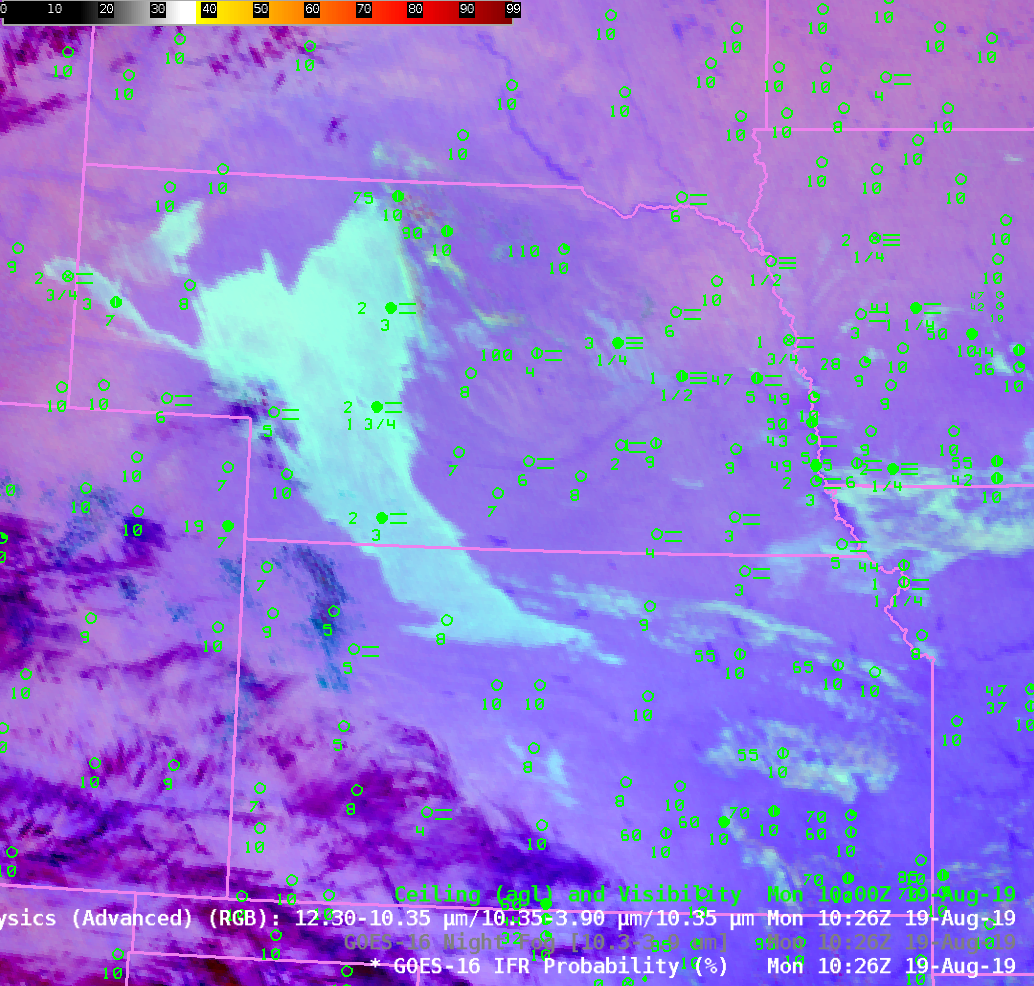
GOES-R IFR Probability fields, below for the same time, better capture the horizontal extent of low ceilings and reduced visibilities (i.e., IFR conditions) in this case by marrying the brightness temperature difference field with low-level saturation as predicted by the Rapid Refresh model. If satellite detection suggests clouds are present — or likely — and low-level saturation is predicted by the model, then IFR Probabilities will be large. The animation below highlights the IFR conditions over western Nebraska and Kansas — but it also highlight IFR conditions in eastern Nebraska and western Iowa, regions that the Night Fog brightness temperature difference does not capture dramatically. Note that during the animation, IFR probability fields can change quickly — as updated Rapid Refresh data (that is, a more recent model run that is often more accurate) are incorporated into the algorithm.
GOES-R IFR Probabilities, 1026 – 1431 UTC on 19 August 2019 (Click to enlarge)
Because the Night Fog brightness temperature difference does not outline fog features well in eastern Nebraska and Iowa, the Nighttime microphysics Red/Green/Blue composite, that uses the Night Fog Brightness temperature difference as its green component (Night Time Microphysics Quick Guide), similarly does not outline them, unlike IFR Probability. Be alert to the strengths and weaknesses of the product used for detecting fog.
Night time Microphysics RGB, Night Fog Brightness Temperature Difference, and GOES-16 IFR Probabililty, all at 1026 UTC on 19 August 2019 (Click to enlarge)