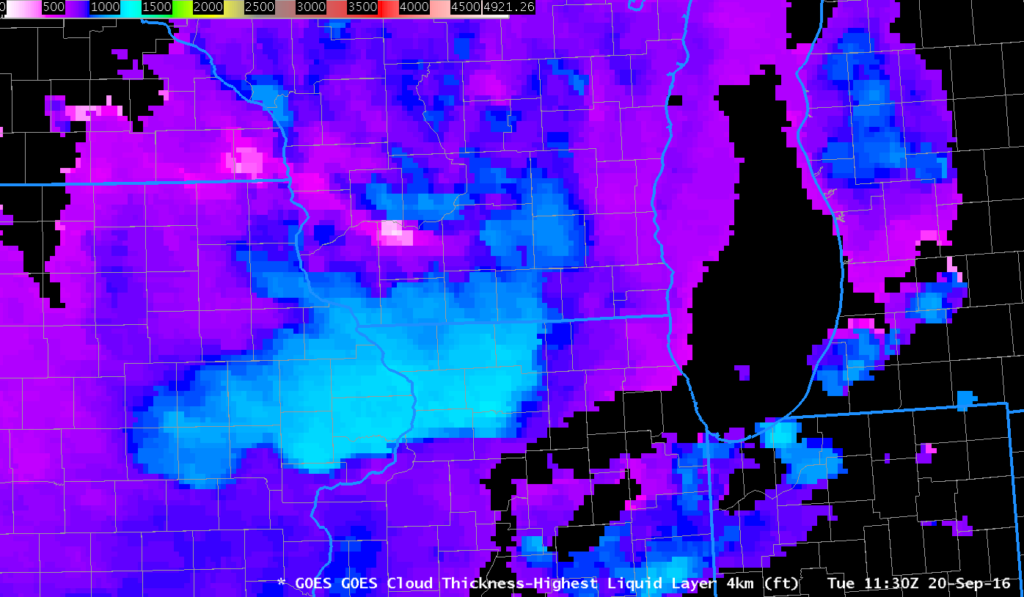
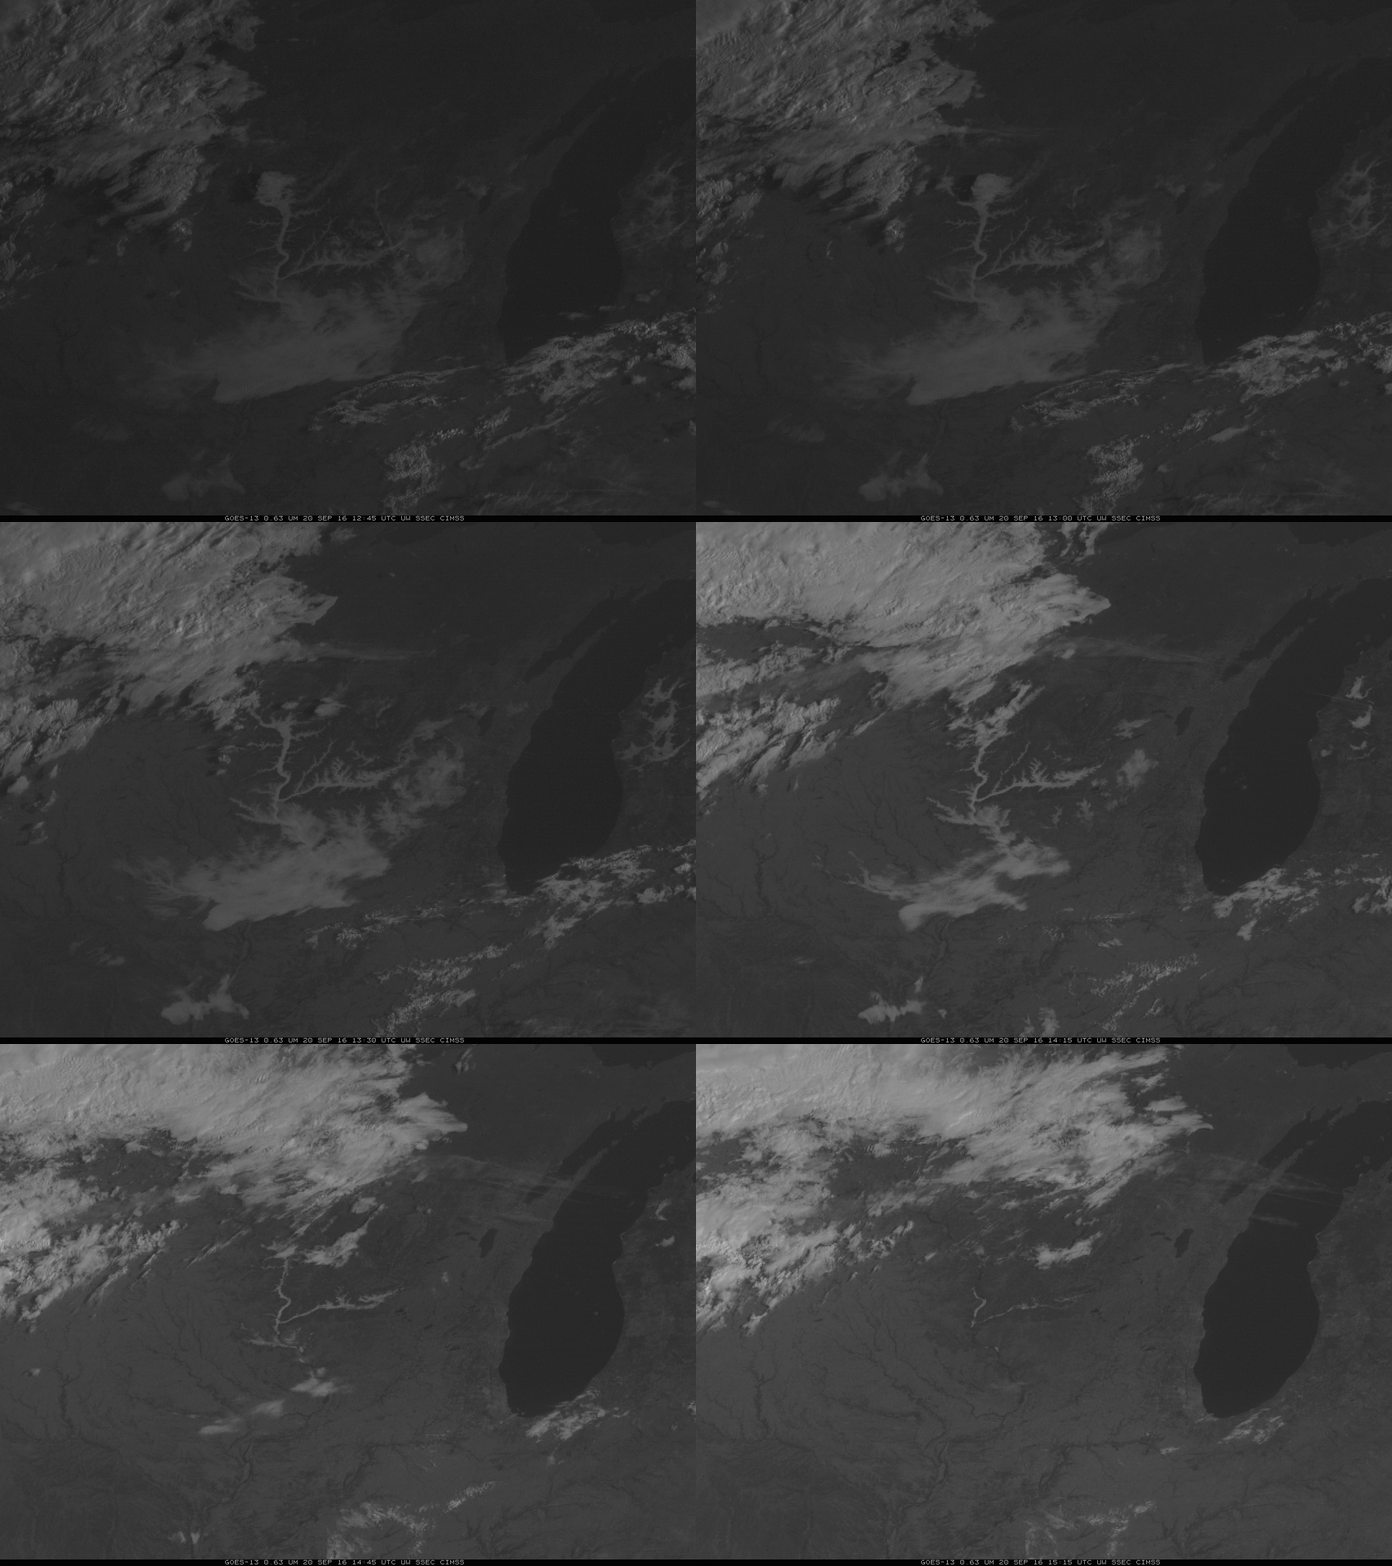
GOES-R Cloud Thickness is created from a look-up table created from observations of 3.9 µm emissivity and sodar observations of cloud thickness off the west coast of the United States. The product is not computed during twilight conditions when rapid changes in reflected solar radiation (either increases around sunrise or decreases around sunset). The image above shows the GOES-R Cloud Thickness field over the midwest just before sunrise on 20 September 2016 (Radiation fog formed subsequent to late-afternoon and evening thunderstorms over Wisconsin and Illinois). This scatterplot relates the last pre-sunrise value to dissipation time. GOES-R Cloud thickness shows values over the Wisconsin River Valley in southwest Wisconsin, and over regions south of Military Ridge. Largest values — 1100 feet over Illinois and Iowa — suggest (from the scatterplot) a dissipation time of around 4 hours, which would be 1130 UTC (the time of the image) + 4 hours, or 1530 UTC. There is also a region of thick clouds on northwest Indiana on the shore of Lake Michigan. It’s these regions where you should expect large-scale fog/low clouds to dissipate last. The animation below shows that to be true. Fog over the river valleys is taking a bit longer to dissipate than expected, however. Note: navigation in the animation shows the effect of the loss of one star-tracker on GOES-13.
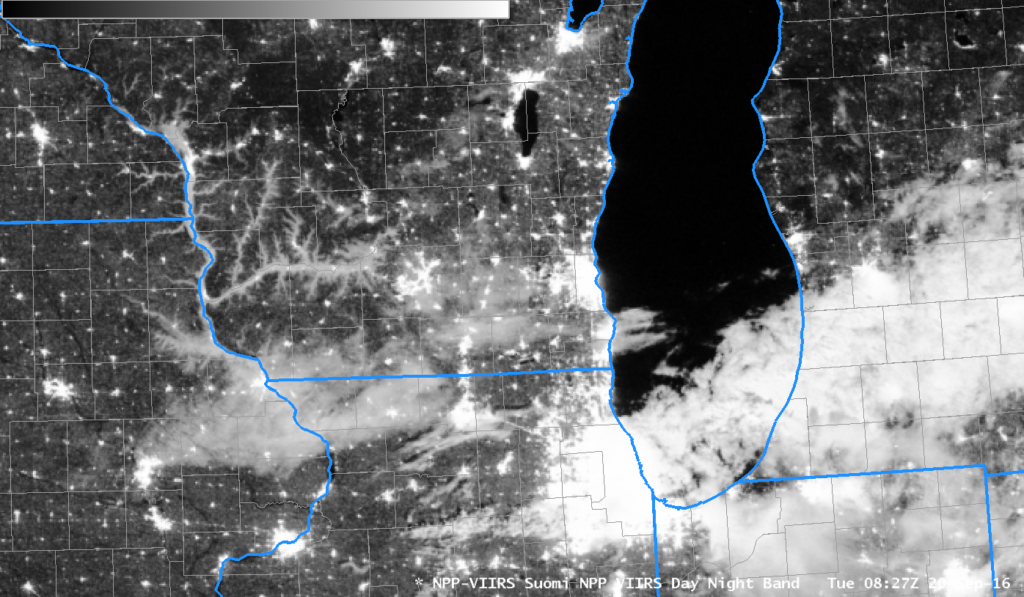
The Day Night band on the VIIRS instrument on board Suomi NPP produces visible imagery at night that showed the regions of fog distinctly shortly after 0800 UTC on 20 September as shown below.


