Monthly Archives: September 2016

Fog after convection in Virginia and North Carolina

ifrp_28sept2016_0215_1125anim

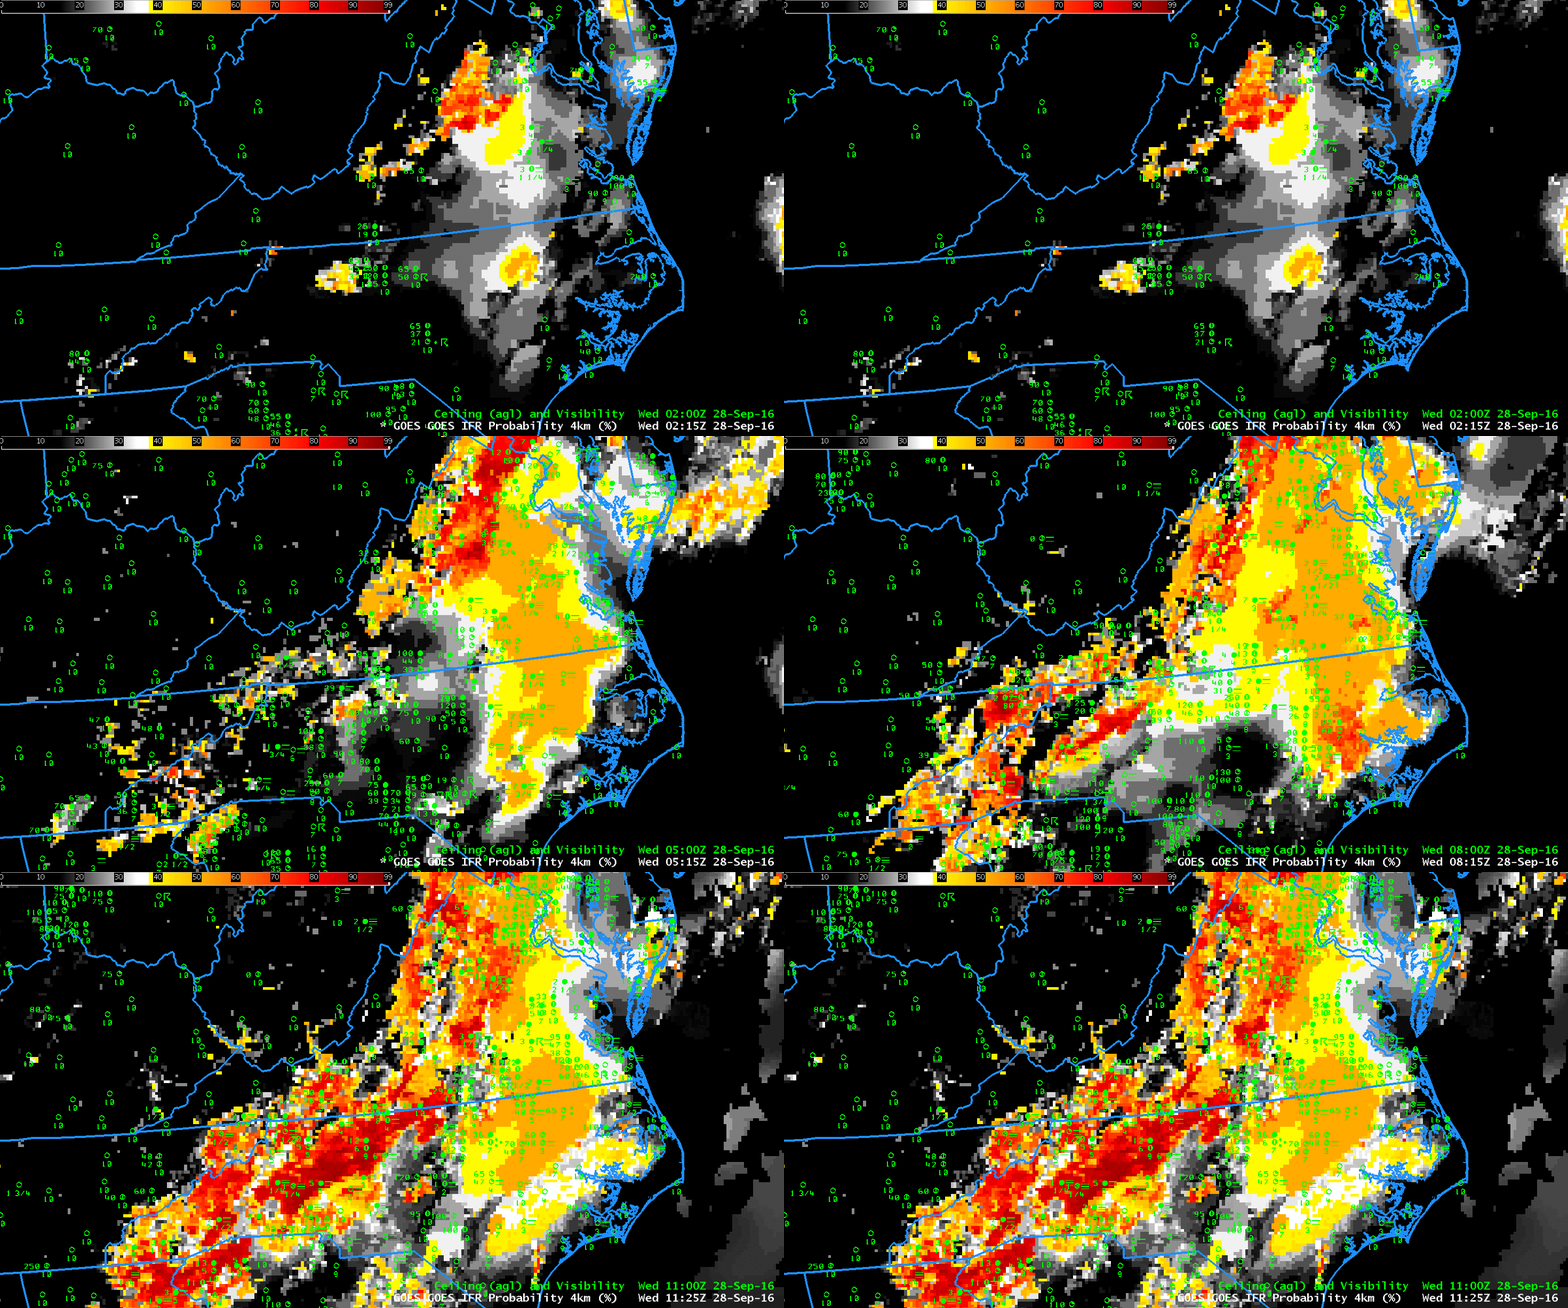
GOES-R IFR Probability fields, hourly from 0215 UTC through 1115 UTC on 28 September 2016 (Click to enlarge)

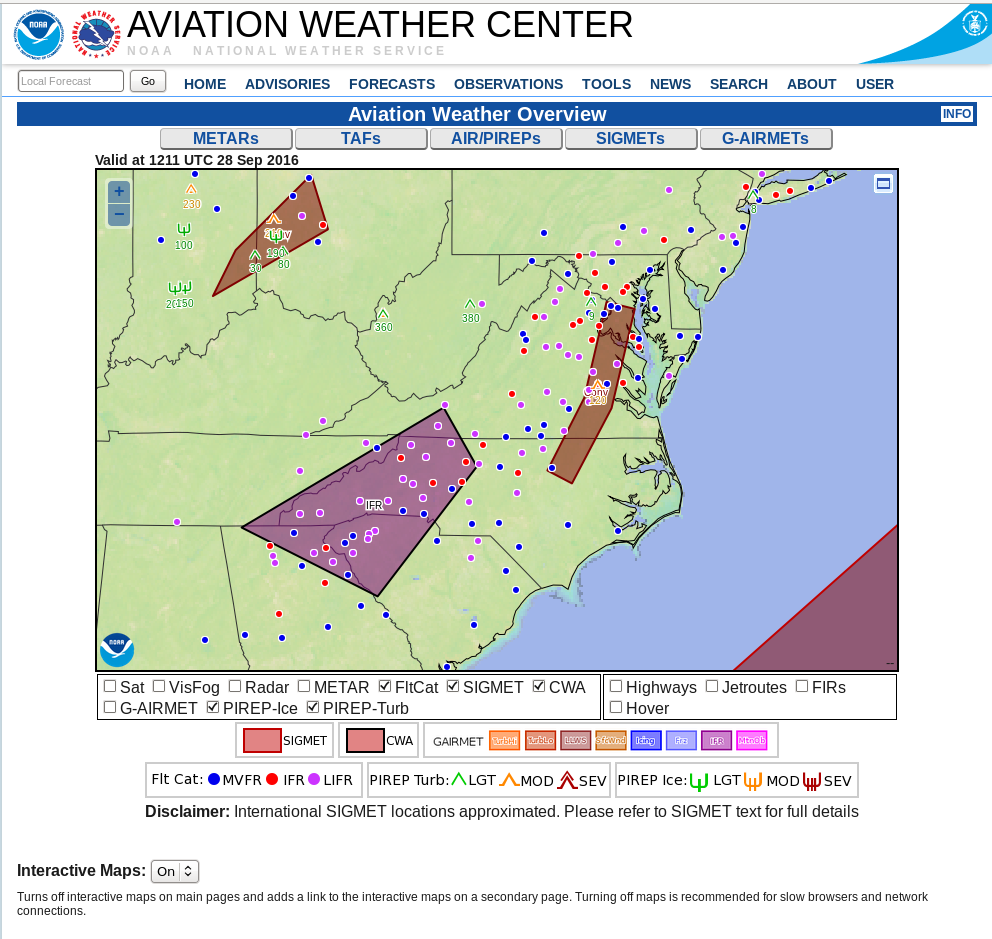
IFR and Low IFR Conditions developed over parts of Virginia and the Carolinas Piedmont Region during the morning of 28 September 2016. The screengrab below, from the Aviation Weather Center, shows the areal extent of the reduced visibilities and/or low ceilings.  (The text of the IFR Sigmet is here.)  Fog over southeastern  Virginia is developing under multiple cloud decks associated with the convection near a front.  IFR Probabiities in this region are determined by Rapid Refresh data that shows low-level saturation; the flat-looking field over that region is characteristic of model-only IFR Probability fields.  Farther to the southwest, over western North Carolina, IFR Probabilities are determined by both satellite and model data;  notice how pixelated the data are in that region.

awc_1213utc_28sept

Screengrab from the Aviation Weather Center at 1215 UTC on 28 September 2016 (Click to enlarge)

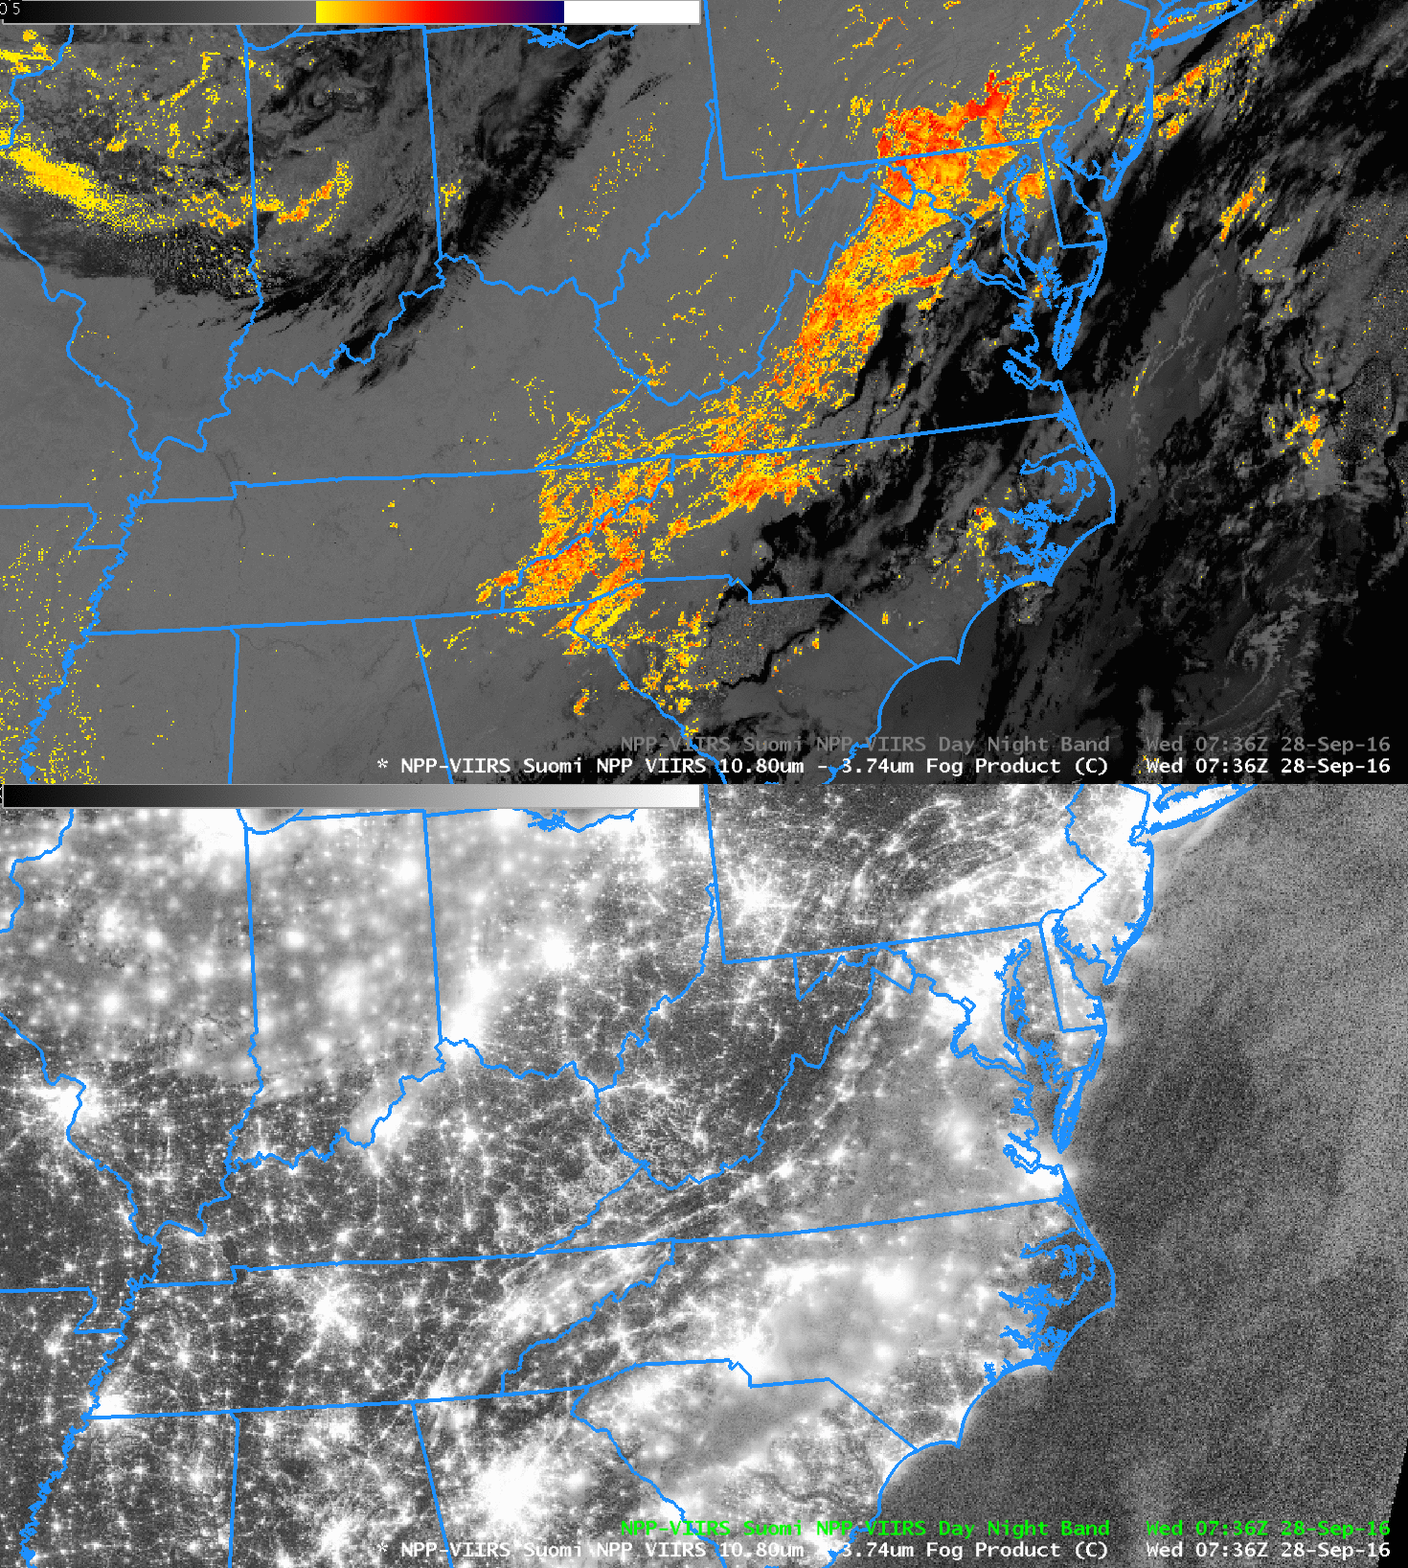
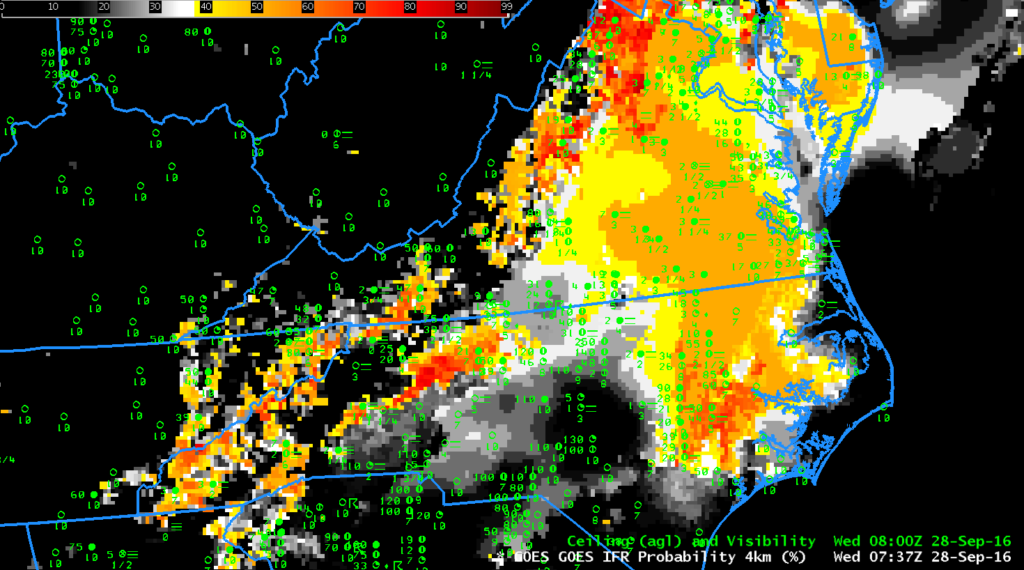
Suomi NPP overflew the eastern United States shortly after 0730 UTC, and the toggle below shows the Day Night Visible Band and the Brightness Temperature Difference field (11.45 – 3.74 ).   Water-based clouds (yellow and orange in the enhancement used) are detected just to the west of cirrus and mixed-phase clouds (black in the enhancement used).  The 0737 UTC IFR Probability field, at bottom, had model-data only as predictors in regions where Suomi NPP shows multiple cloud layers.  Note also that the 1-km resolution of Suomi NPP is resolving the developing valley fogs in the Appalachian mountains of Ohio, West Virginia and Kentucky.  There are only a few pixels in the IFR Probability field that are suggesting valley fog development — but note in the end of the animation at the top of this post that more valley pixels show IFR Probability signals.  When GOES-R is flying, its superior (to GOES-13) 2-km resolution should mitigate this too-slow identification of valley fogs.

snpp_btd_dnb_0736_28sep2016toggle

Suomi NPP Day Night Band Visible (0.70) and Brightness Temperature Difference (11.45 – 3.74) fields at 0736 UTC on 28 September 2016 (Click to enlarge)

ifrp_28sept2016-35

GOES-R IFR Probability fields at 0737 UTC, and surface observations of ceilings and visibilities at 0800 UTC (Click to enlarge)

Cloud Thickness and Dissipation Time

goes-rcloudthickness_1130utc_20sept2016

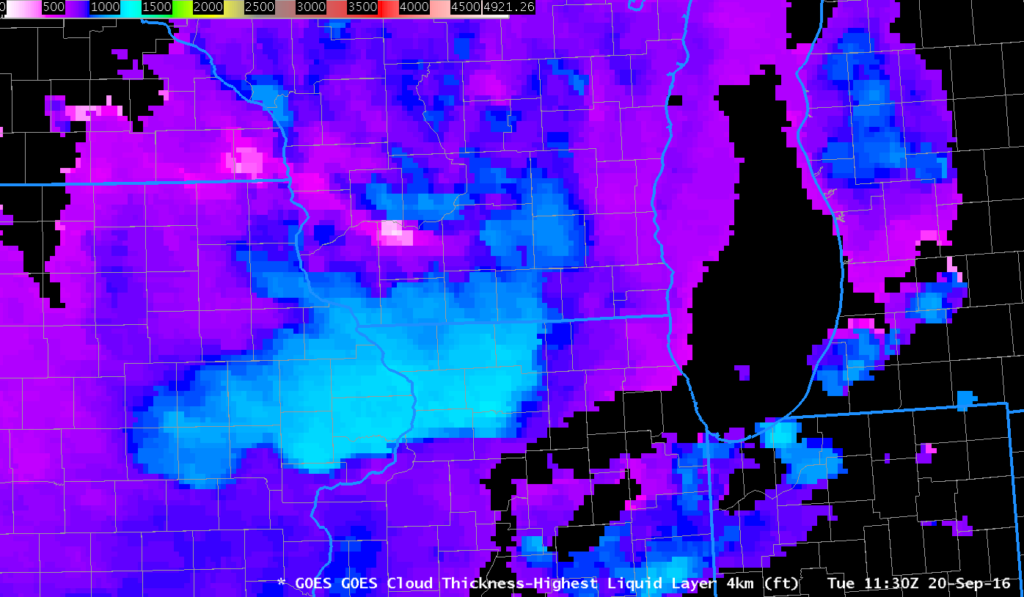
GOES-R Cloud Thickness Fields, 1130 UTC on 20 September 2016 (Click to enlarge)

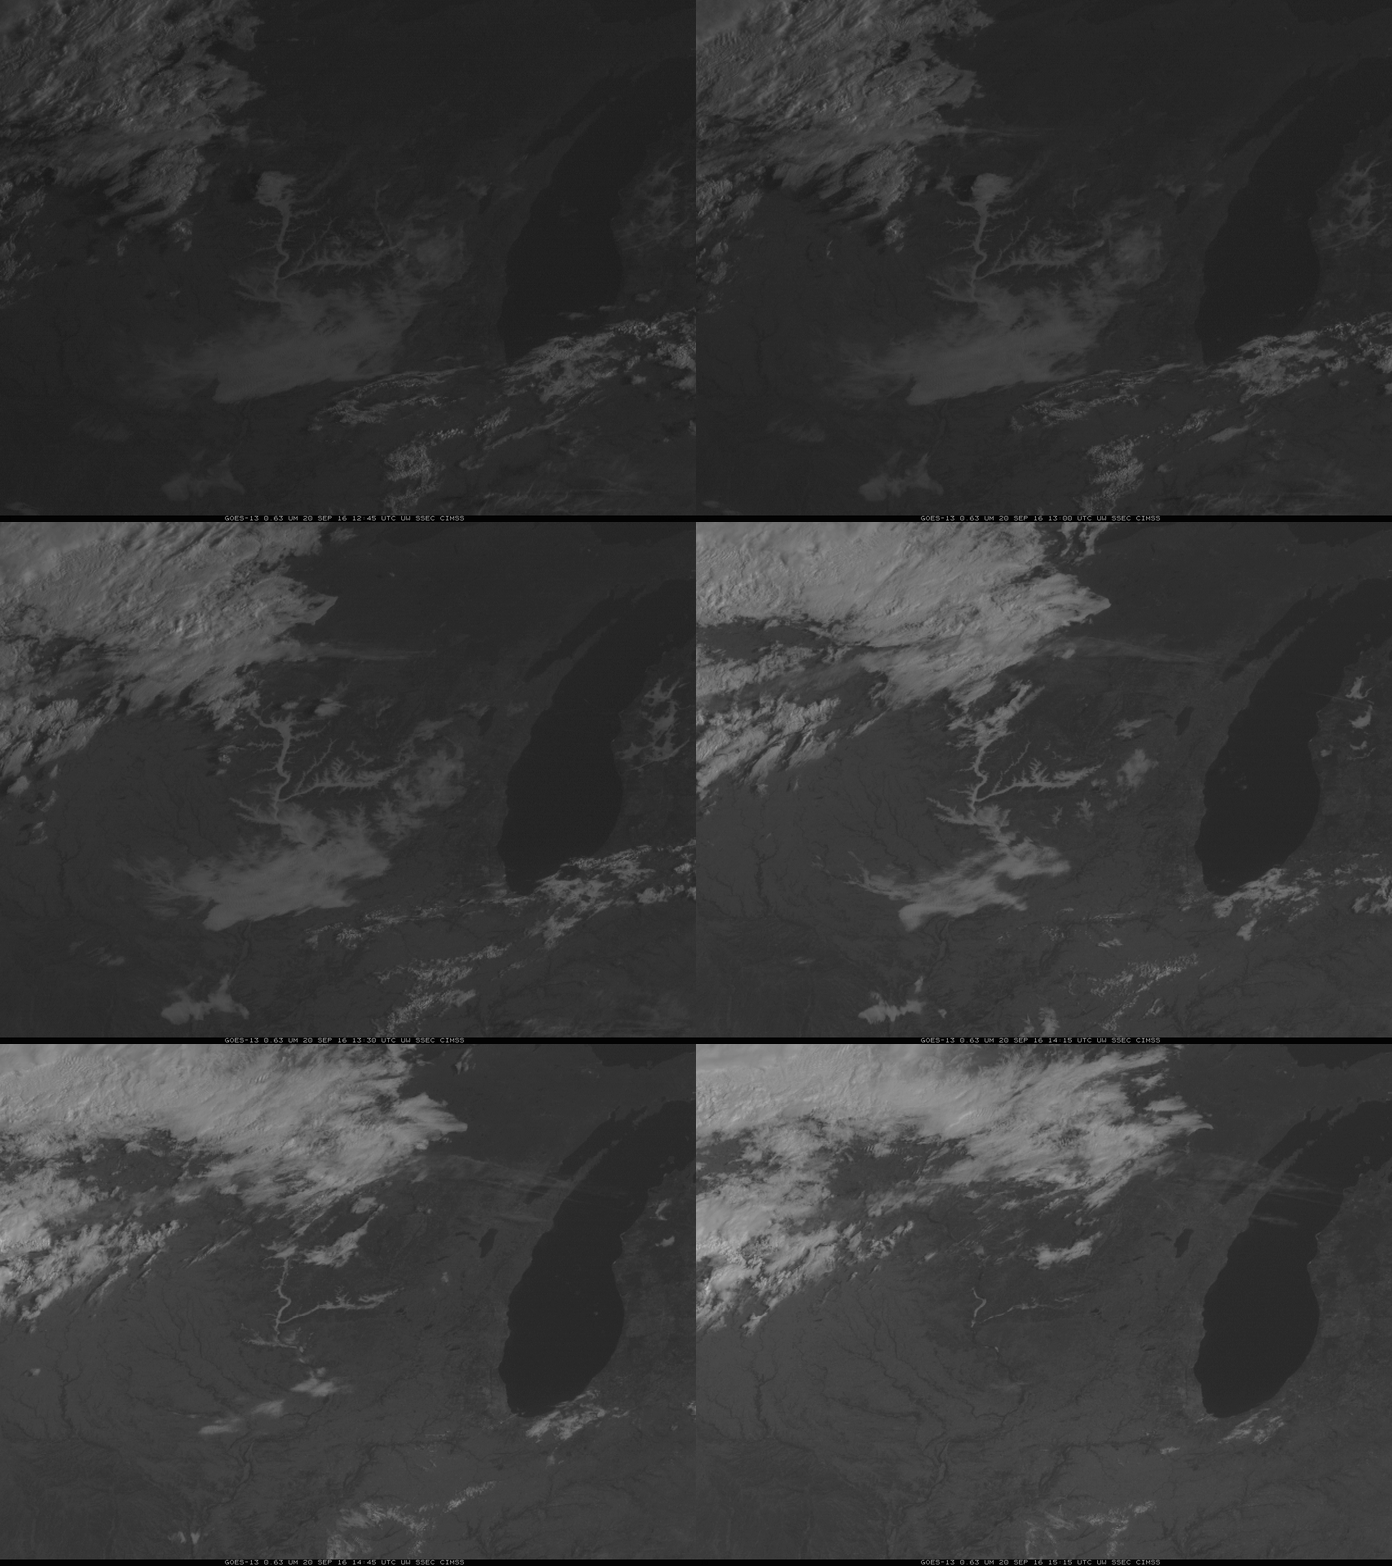
GOES-R Cloud Thickness is created from a look-up table created from observations of 3.9 µm emissivity and sodar observations of cloud thickness off the west coast of the United States.  The product is not computed during twilight conditions when rapid changes in reflected solar radiation (either increases around sunrise or decreases around sunset).  The image above shows the GOES-R Cloud Thickness field over the midwest just before sunrise on 20 September 2016 (Radiation fog formed subsequent to late-afternoon and evening thunderstorms over Wisconsin and Illinois).  This scatterplot relates the last pre-sunrise value to dissipation time.  GOES-R Cloud thickness shows values over the Wisconsin River Valley in southwest Wisconsin, and over regions south of Military Ridge. Largest values — 1100 feet over Illinois and Iowa — suggest (from the scatterplot) a dissipation time of around 4 hours, which would be 1130 UTC (the time of the image) + 4 hours, or 1530 UTC.  There is also a region of thick clouds on northwest Indiana on the shore of Lake Michigan.  It’s these regions where you should expect large-scale fog/low clouds to dissipate last.   The animation below shows that to be true.  Fog over the river valleys is taking a bit longer to dissipate than expected, however. Note: navigation in the animation shows the effect of the loss of one star-tracker on GOES-13.

goes13_flswi_20sept2016_1245_1515anim

GOES-13 Visible (0.63 µm) animation, 1245-1515 UTC on 20 September 2016 (Click to enlarge)

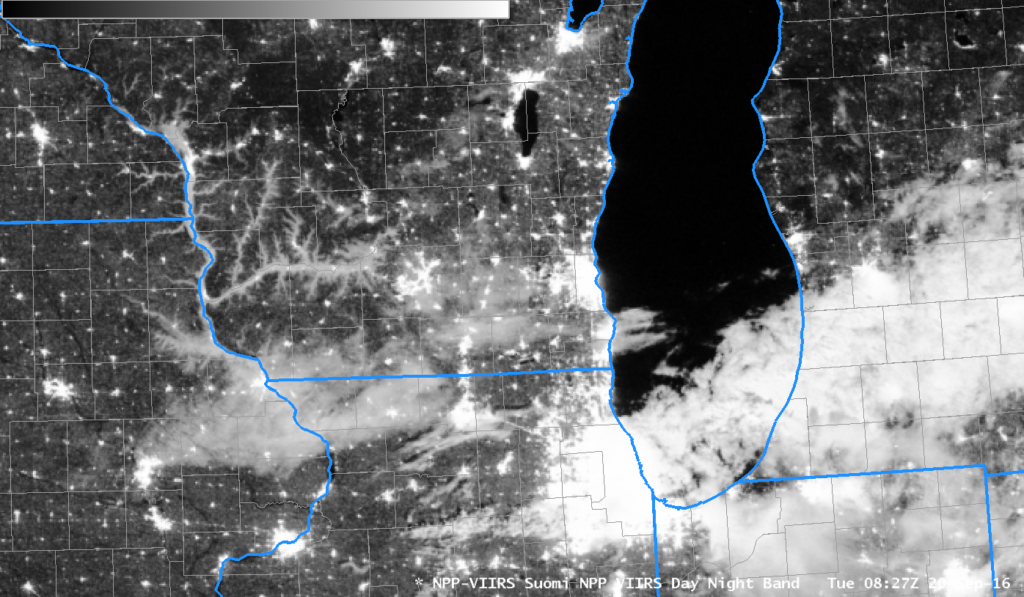
The Day Night band on the VIIRS instrument on board Suomi NPP produces visible imagery at night that showed the regions of fog distinctly shortly after 0800 UTC on 20 September as shown below.

daynightband_wi_0827_20sep2016

VIIRS Day/Night Band Visible (0.70 µm) Imagery from Suomi NPP at 0827 UTC on 20 September (Click to enlarge)

Radiation Fog over South Carolina

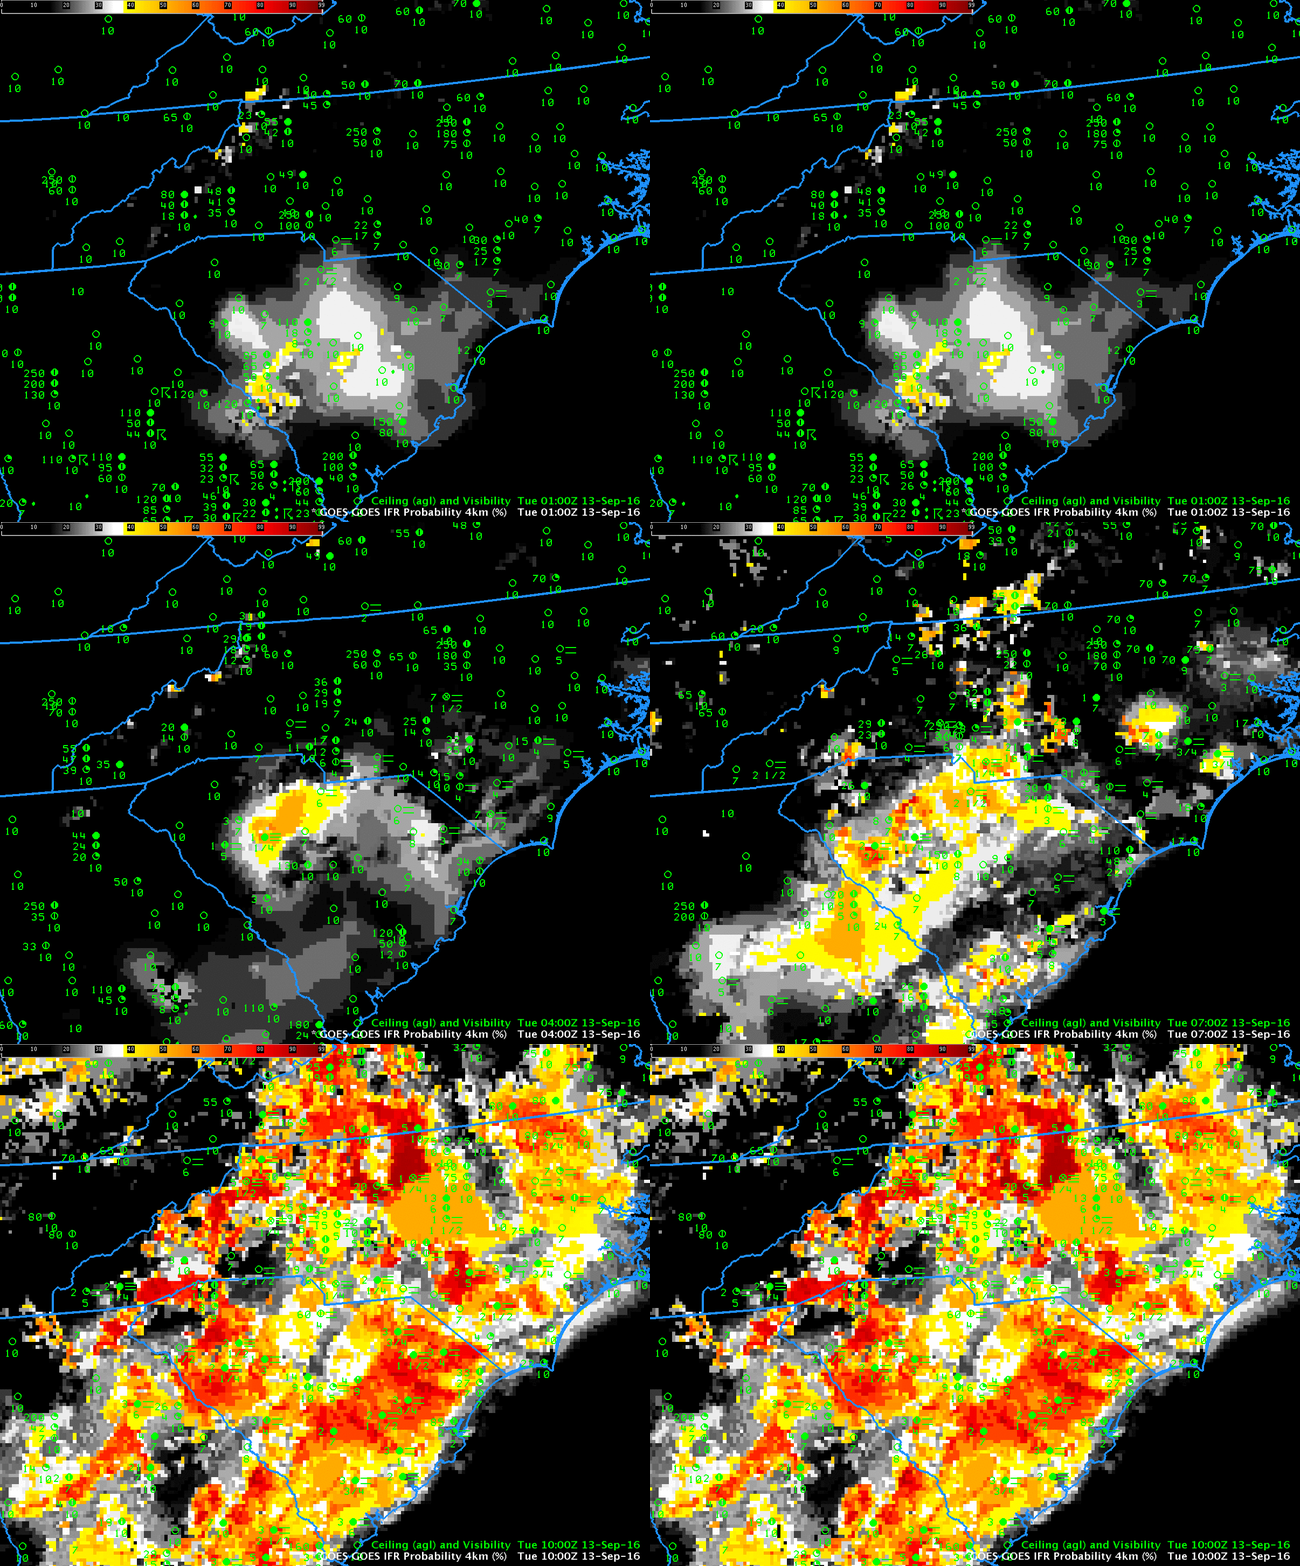
goesr_ifrp_13sept2016anim_0200_1000

GOES-R IFR Probability Fields and surface reports of ceilings and visibilities, 0100-1000 UTC on 13 September 2016 (Click to enlarge)

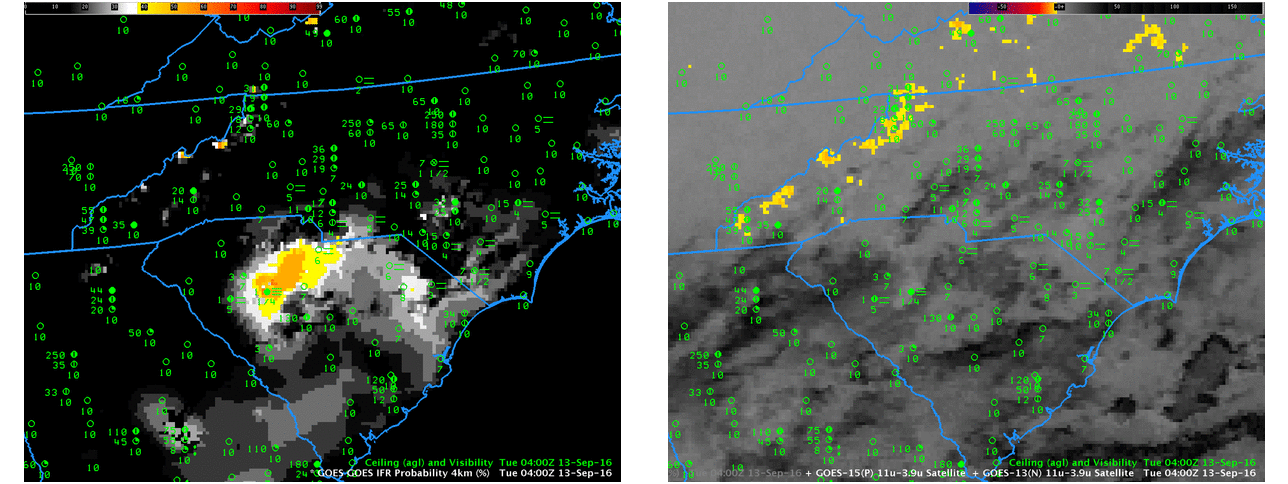
High Pressure over the eastern United States allowed Radiation Fog to form over much of the southeast early on the morning of 13 September 2016.  The GOES-R IFR Probability hourly animation, above, shows increasing probabilities of IFR conditions over much of North and South Carolina, with IFR conditions observed at many stations by sunrise (graphic from here).  IFR Probabilities provided an earlier alert to the fog development (as such, it’s a good situational awareness tool) than was possible from the traditional brightness temperature difference field (see the 0400 UTC image below — click here for a much larger image) because of multiple cloud layers present over the Carolinas in the wake of departing showers. The enhancement for the brightness temperature difference field is such that clouds composed of water droplets are typically shaded orange or yellow.  In the 0400 UTC brightness temperature difference field below (right), fog is not indicated over South Carolina.

tifrp_btd_0400_13sept

GOES-R IFR Probability fields (left) and GOES-13 Brightness Temperature Difference Fields (right), both from 0400 UTC on 13 September 2016 (Click to enlarge)

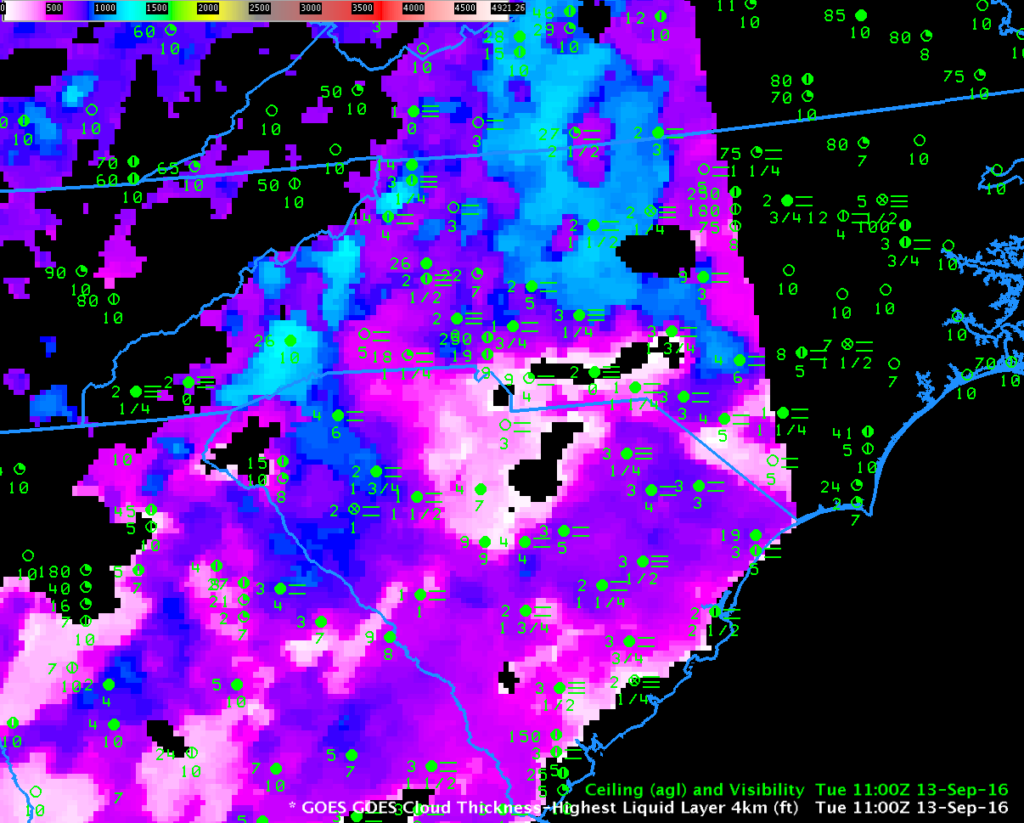
GOES-R Cloud Thickness fields can be used to estimate fog dissipation time for radiation fog. This scatterplot shows a rough relationship between the last thickness field produced before twilight conditions and the dissipation time. That field is shown below — note that portions of eastern North Carolina have slipped into twilight conditions already by 1100 UTC. Maximum values over South Carolina are around 850 feet (near Greenville/Spartanburg), while those over North Carolina exceed 1200 (near Asheville). Fog dissipation should occur first over South Carolina, then over North Carolina.

goes_r_cloudthickness_1100_13sept

GOES-R Cloud Thickness Field, 1100 UTC on 13 September 2016 (Click to enlarge)