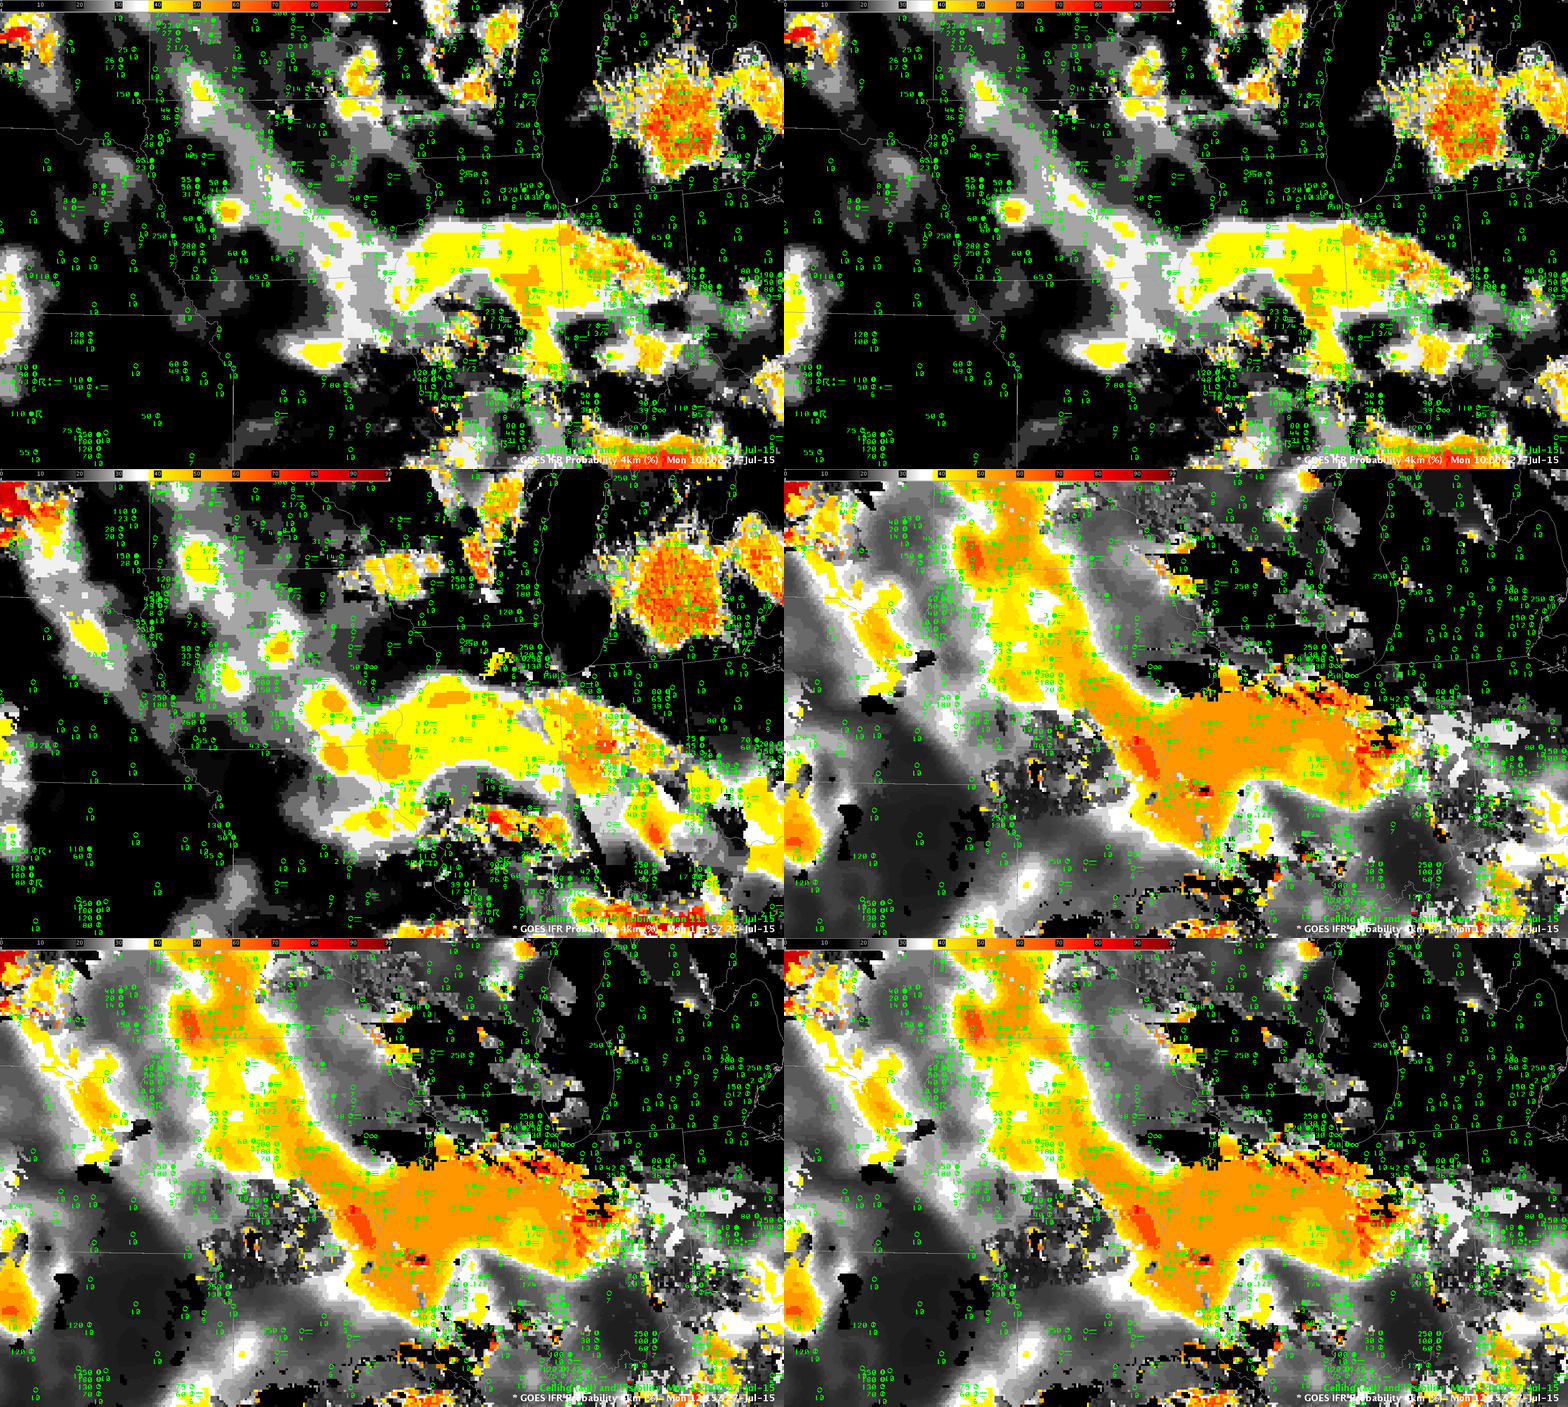
GOES-R IFR Probability fields, 1000, 1115 and 1215 UTC on July 27 2015 along with surface plots of ceilings and visibility (Click to enlarge)
Regions of dense fog developed over the Midwest during the morning of July 27 2015, and the GOES-R IFR Probability fields are shown above for 1000 through 1215 UTC. There is a good spatial relationship to where IFR Probabilities are large(ish) and where IFR conditions are present. This example is a good reminder that GOES-R IFR Probability fields should be interpreted with knowledge of other fields. On this day, an extensive cirrus shield (Click the link to view the Brightness Temperature Difference field at 1000 UTC) prevented GOES-13 from viewing low clouds over much of the midwest; thus, the IFR Probability field was driven mostly by model fields over Illinois and Iowa. This is why the field there is mostly uniform. When satellite data is not used in computing the probabilities (because of cirrus clouds), the magnitude of the IFR Probability is reduced.
