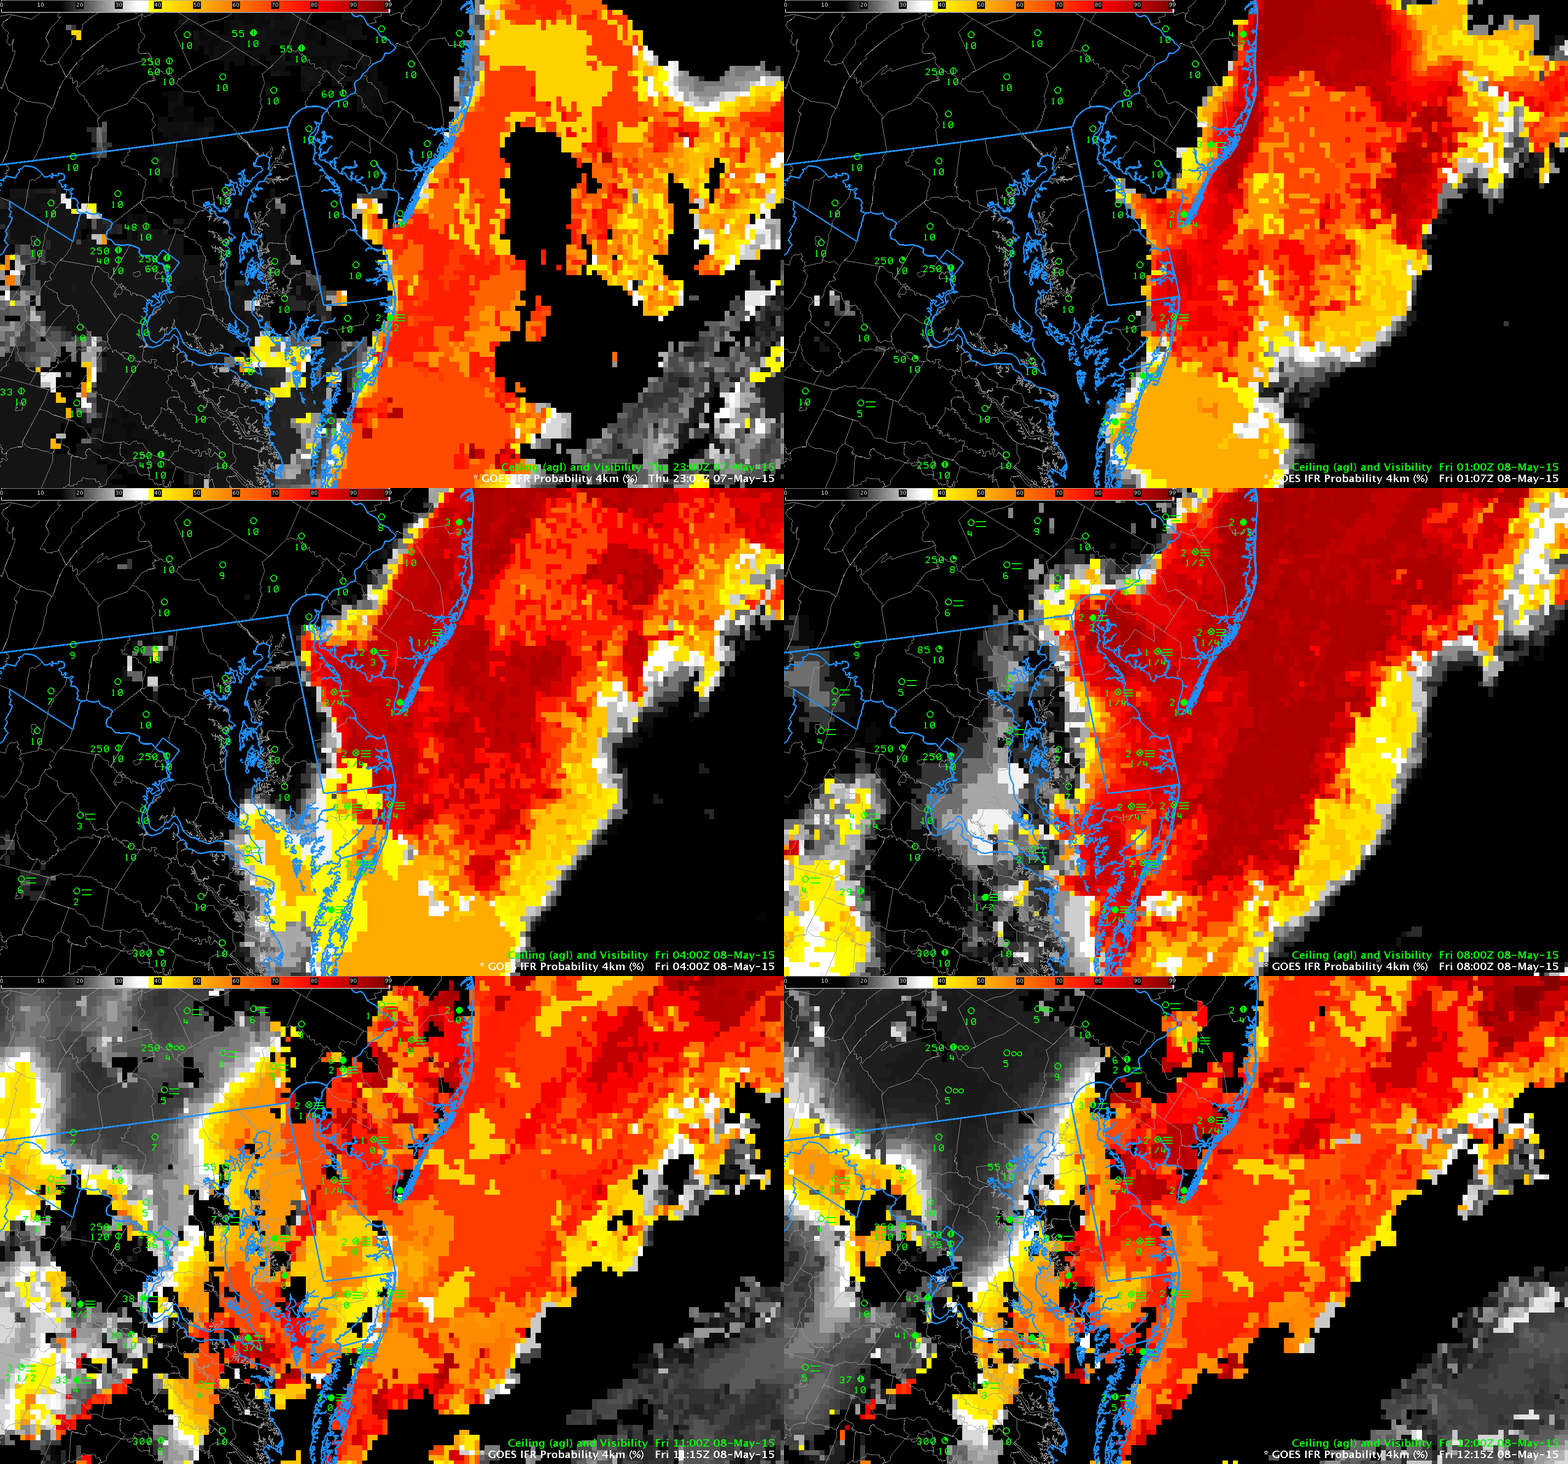
GOES-R IFR Probability Fields computed from GOES-East and Rapid Refresh Data, hourly from 2300 7 May through 1200 8 May, and surface observations of ceilings/visibility (Click to enlarge)
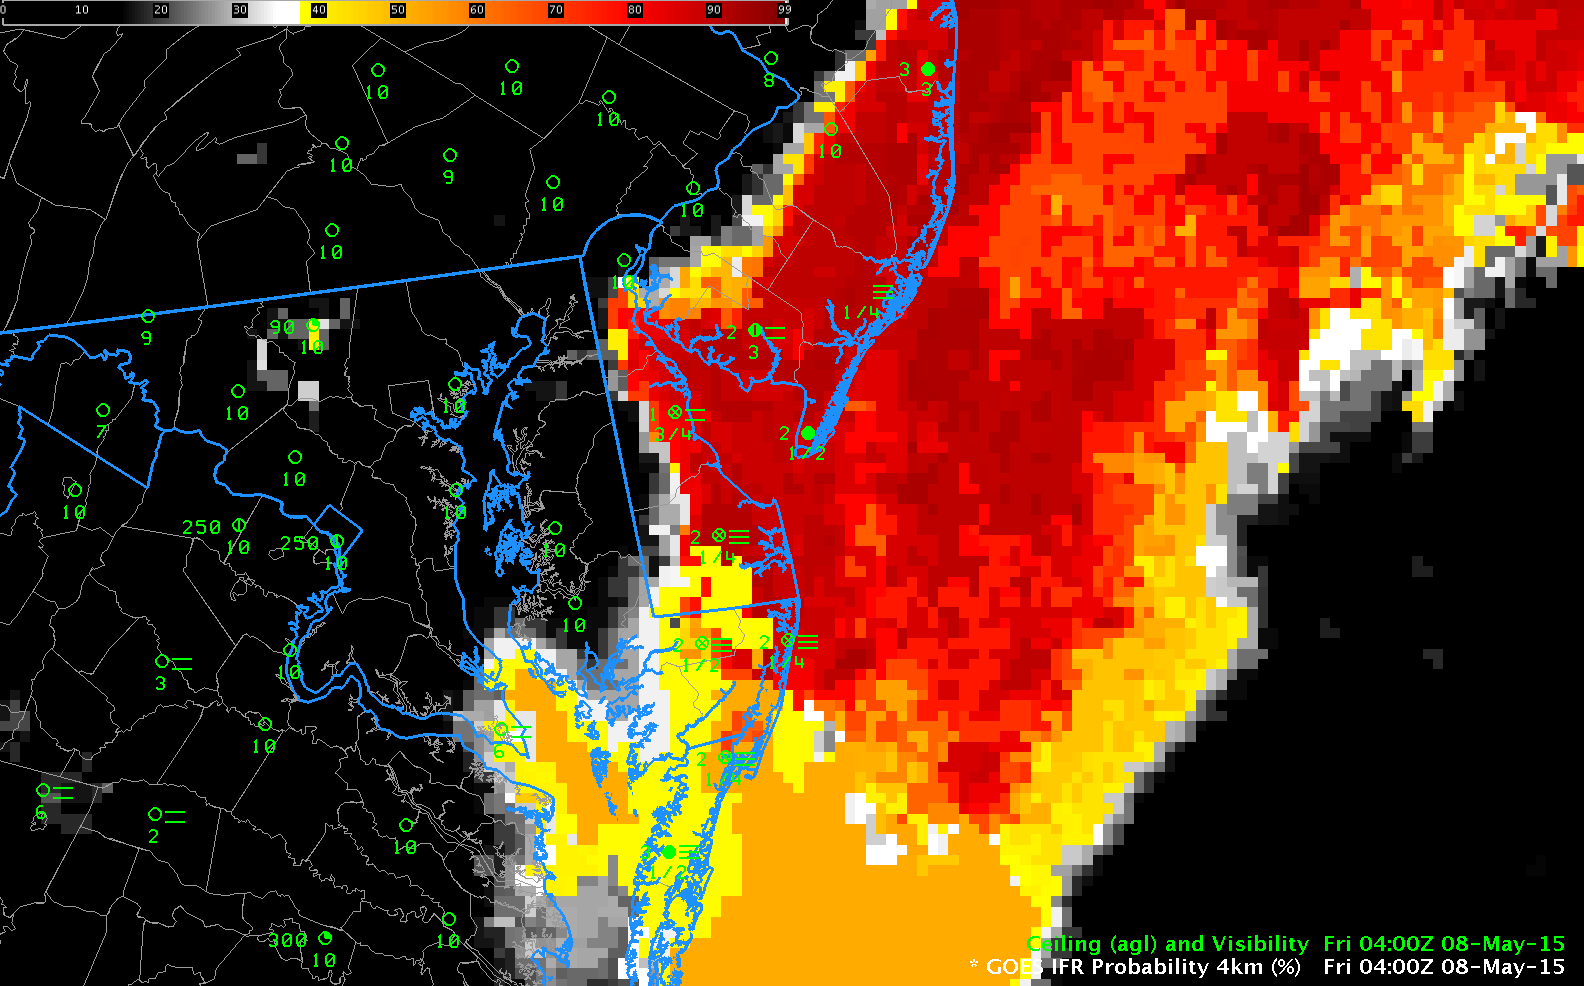
GOES-R IFR Probability Fields showed large values at sunset over the Atlantic Ocean east of New Jersey and the Delmarva Peninsula. As night progressed, that fog penetrated inland. The IFR Probability field accurately depicts the region where visibilities due to fog were reduced. The 0400 UTC image in the animation above (reproduced below), has qualities that highlight the benefit of a fused product. The Ocean to the east of the southern Delmarva peninsula is overlain with multiple cloud layers that make satellite detection of low clouds/fog problematic. In this region, satellite data cannot be used as a predictor and the GOES-R IFR Probability field is a flat field. Because the GOES-R IFR Probability product includes information from the Rapid Refresh model (2-3 hour model forecasts, typically) and because saturation is indicated in the lowest 1000 feet of the model, IFR Probabilities over the ocean are high in a region where satellite data cannot be used as a predictor.
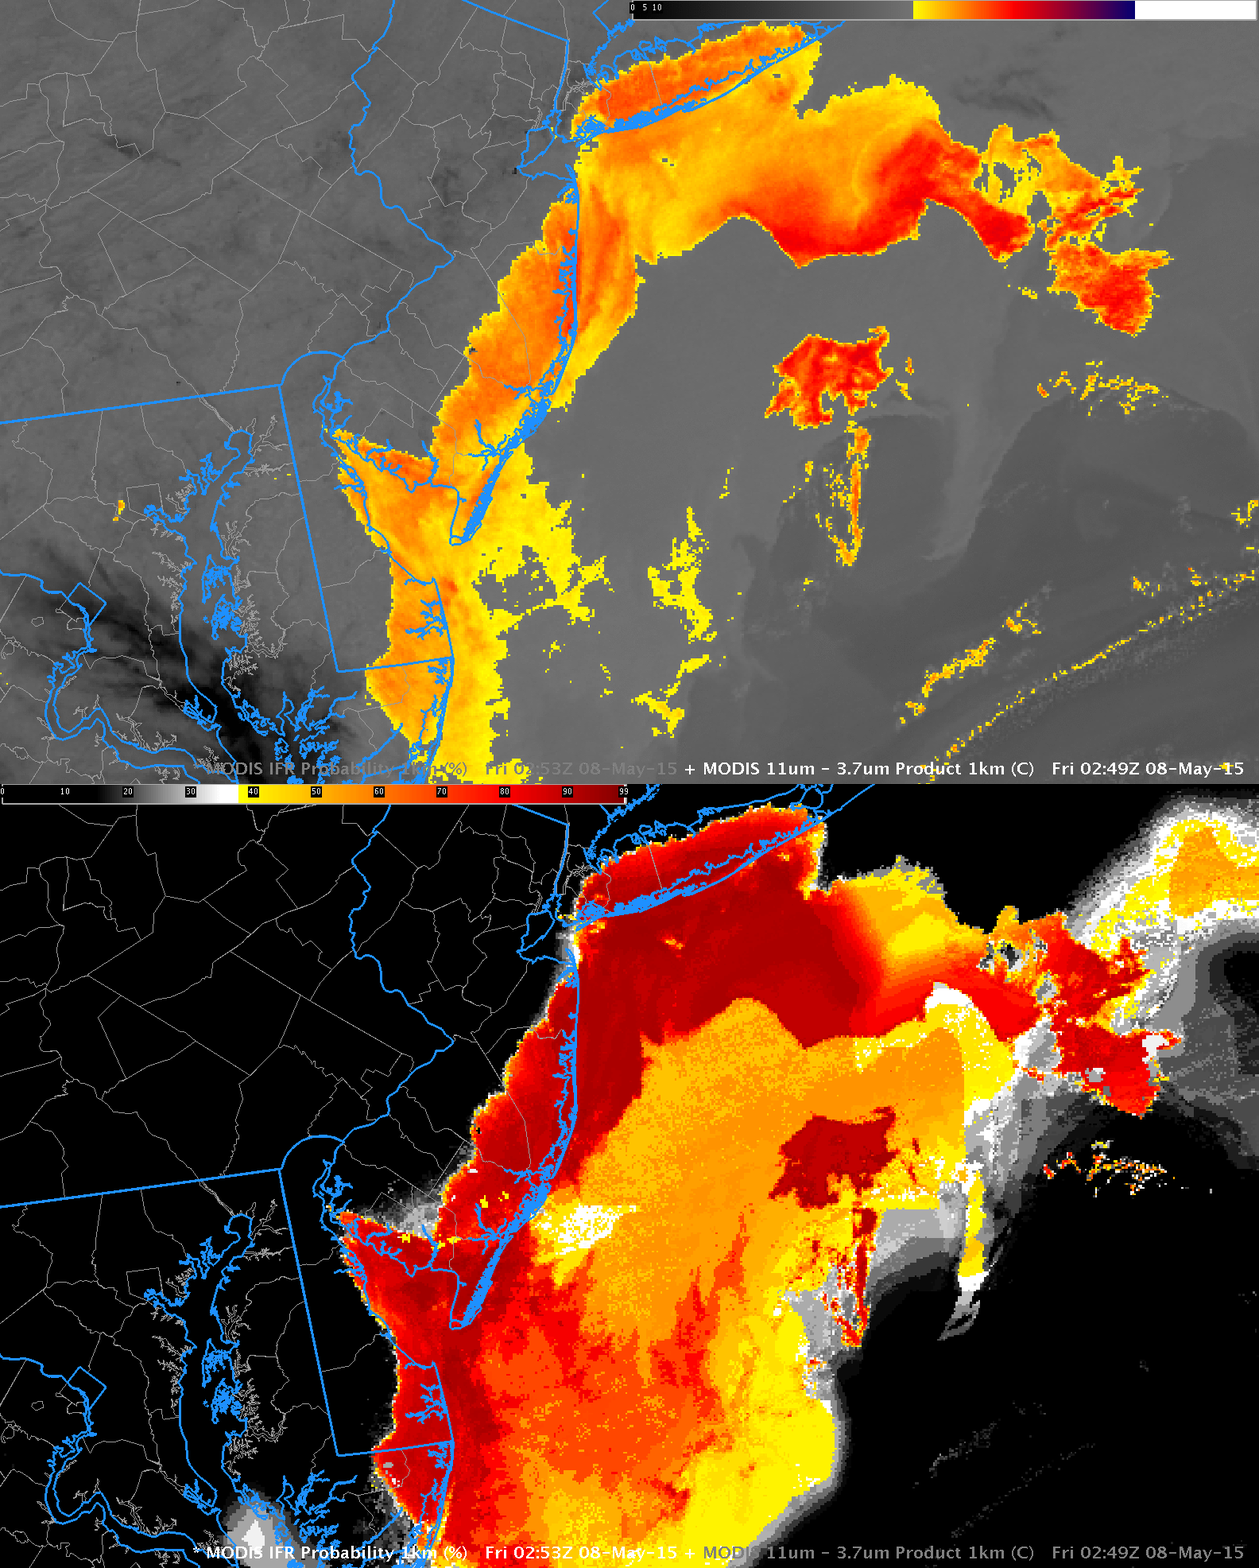
GOES-R IFR Probabilities can also be computed using MODIS data, which data has better spatial resolution than GOES (1-km vs. nominal 4-km). The toggle below of the MODIS brightness temperature difference and the GOES-R IFR Probability shows a very sharp edge to the expanding fog field over New Jersey.

MODIS Brightness Temperature Difference (11µm – 3.9µm) and MODIS-based GOES-R IFR Probabilities, ~0250 UTC on 8 May, 2015 (Click to enlarge)
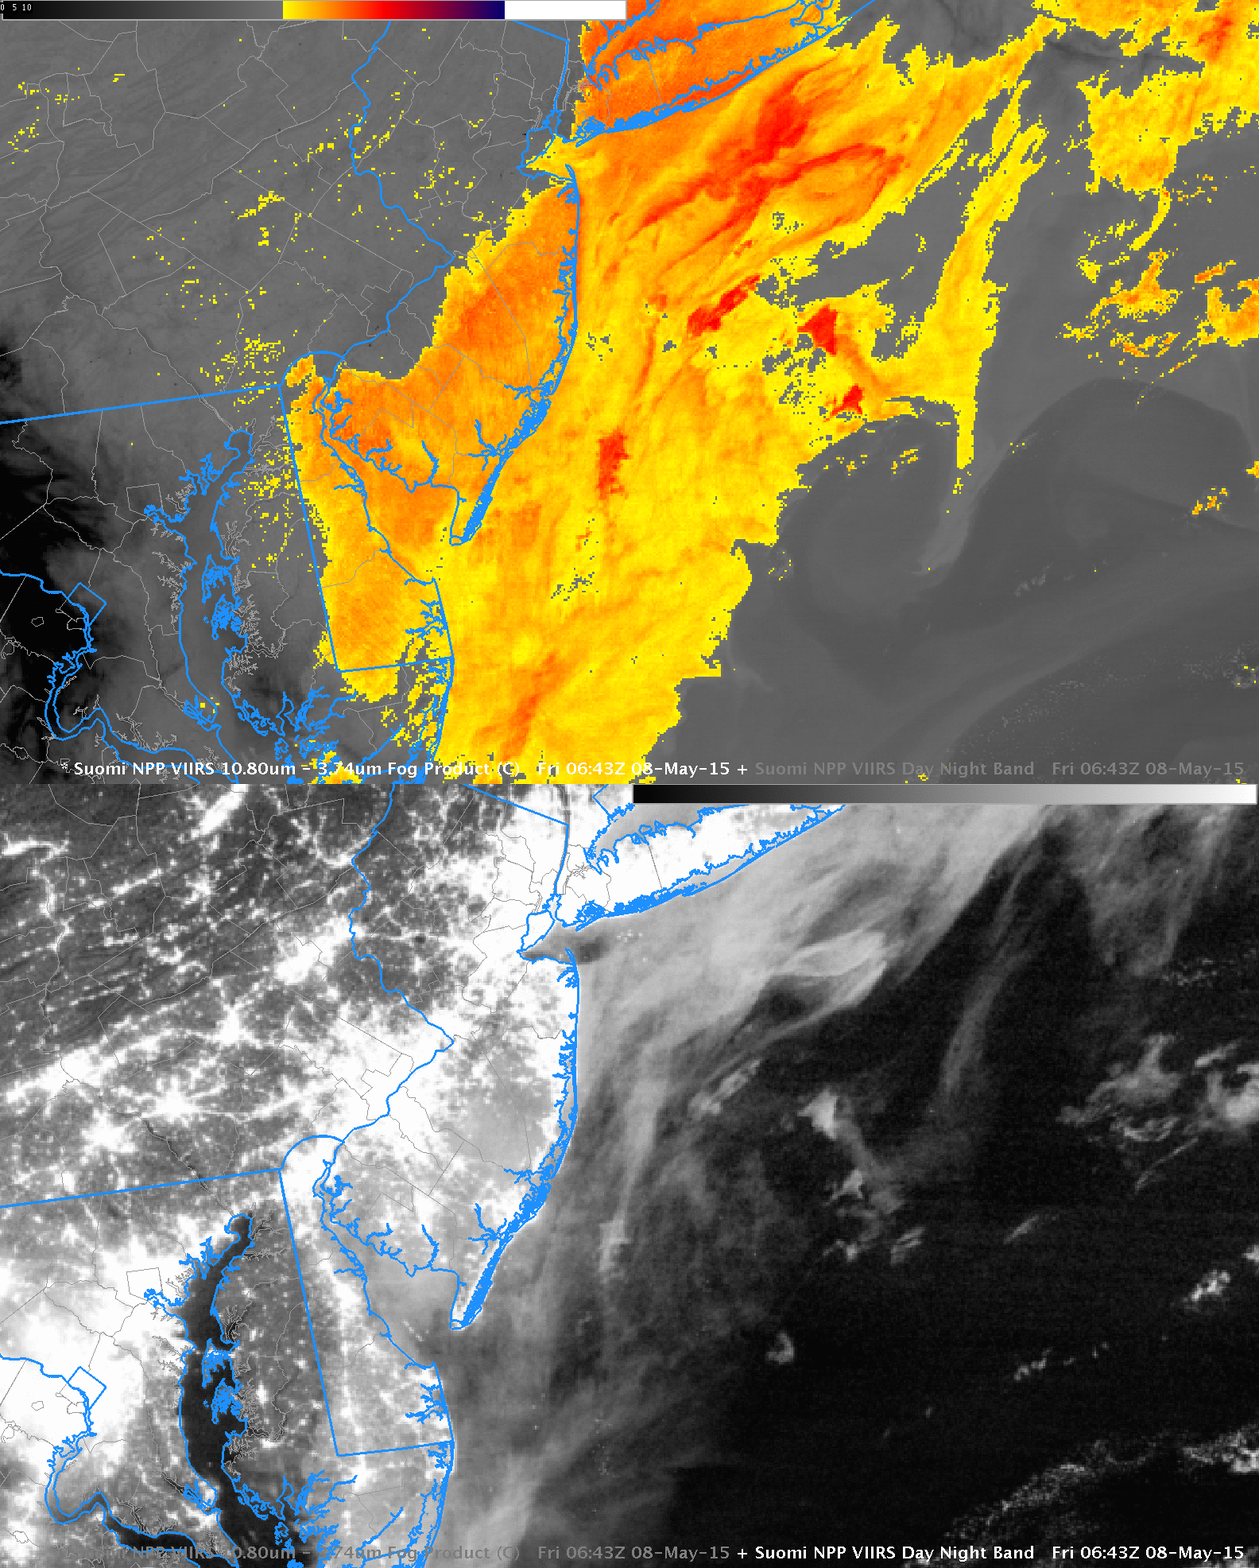
The Gulf Stream is apparent in the Brightness Temperature Difference field above and IFR Probabilities are high over the ocean between the coast and the Gulf Stream. In the absence of observations, how much should those high IFR Probabilities be believed. There is high dewpoint air (mid-50s Fahrenheit) along the East Coast at this time, and advection fog could be occurring, for example. Suomi NPP also overflew the region shortly after midnight. The toggle below, of brightness temperature difference and the Day Night Band confirms the presence of (presumably) low clouds over the cold Shelf Water of the mid-Atlantic bight.


