Daily Archives: January 16, 2015

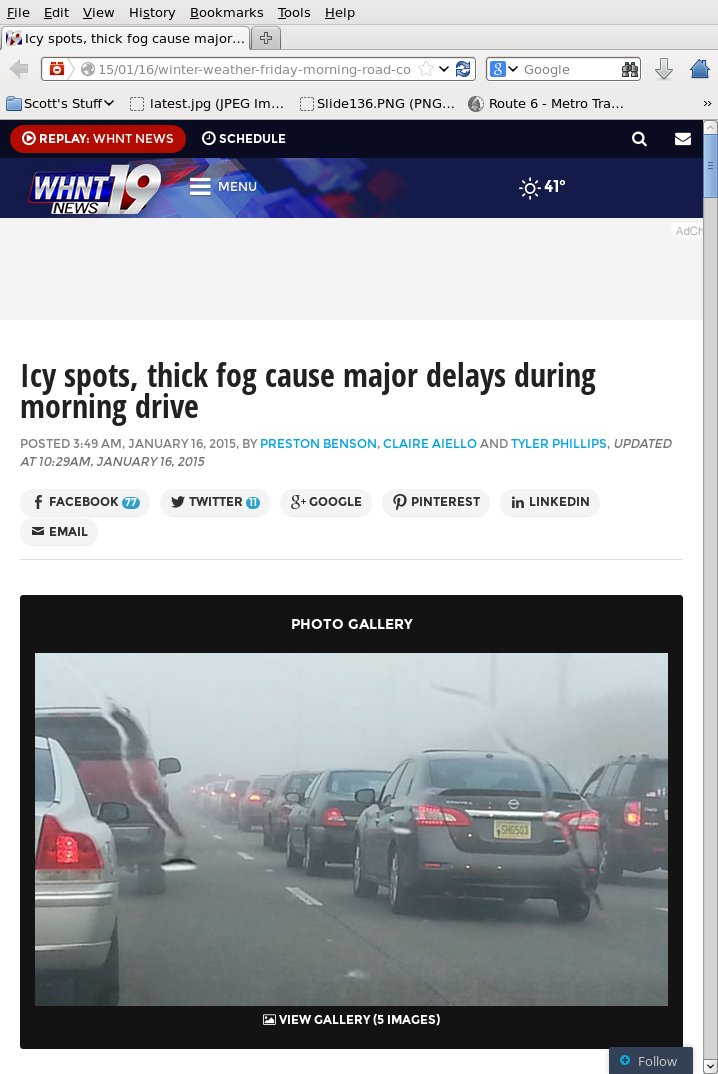
Traffic-snarling fog in Huntsville, Alabama

AlabamaFog

Dense fog developed over the Tennessee River Valley during the morning hours of 16 January 2015, causing crashes and traffic and school delays. The screenshot above (from this link), from WHNT in Huntsville, shows the conditions.

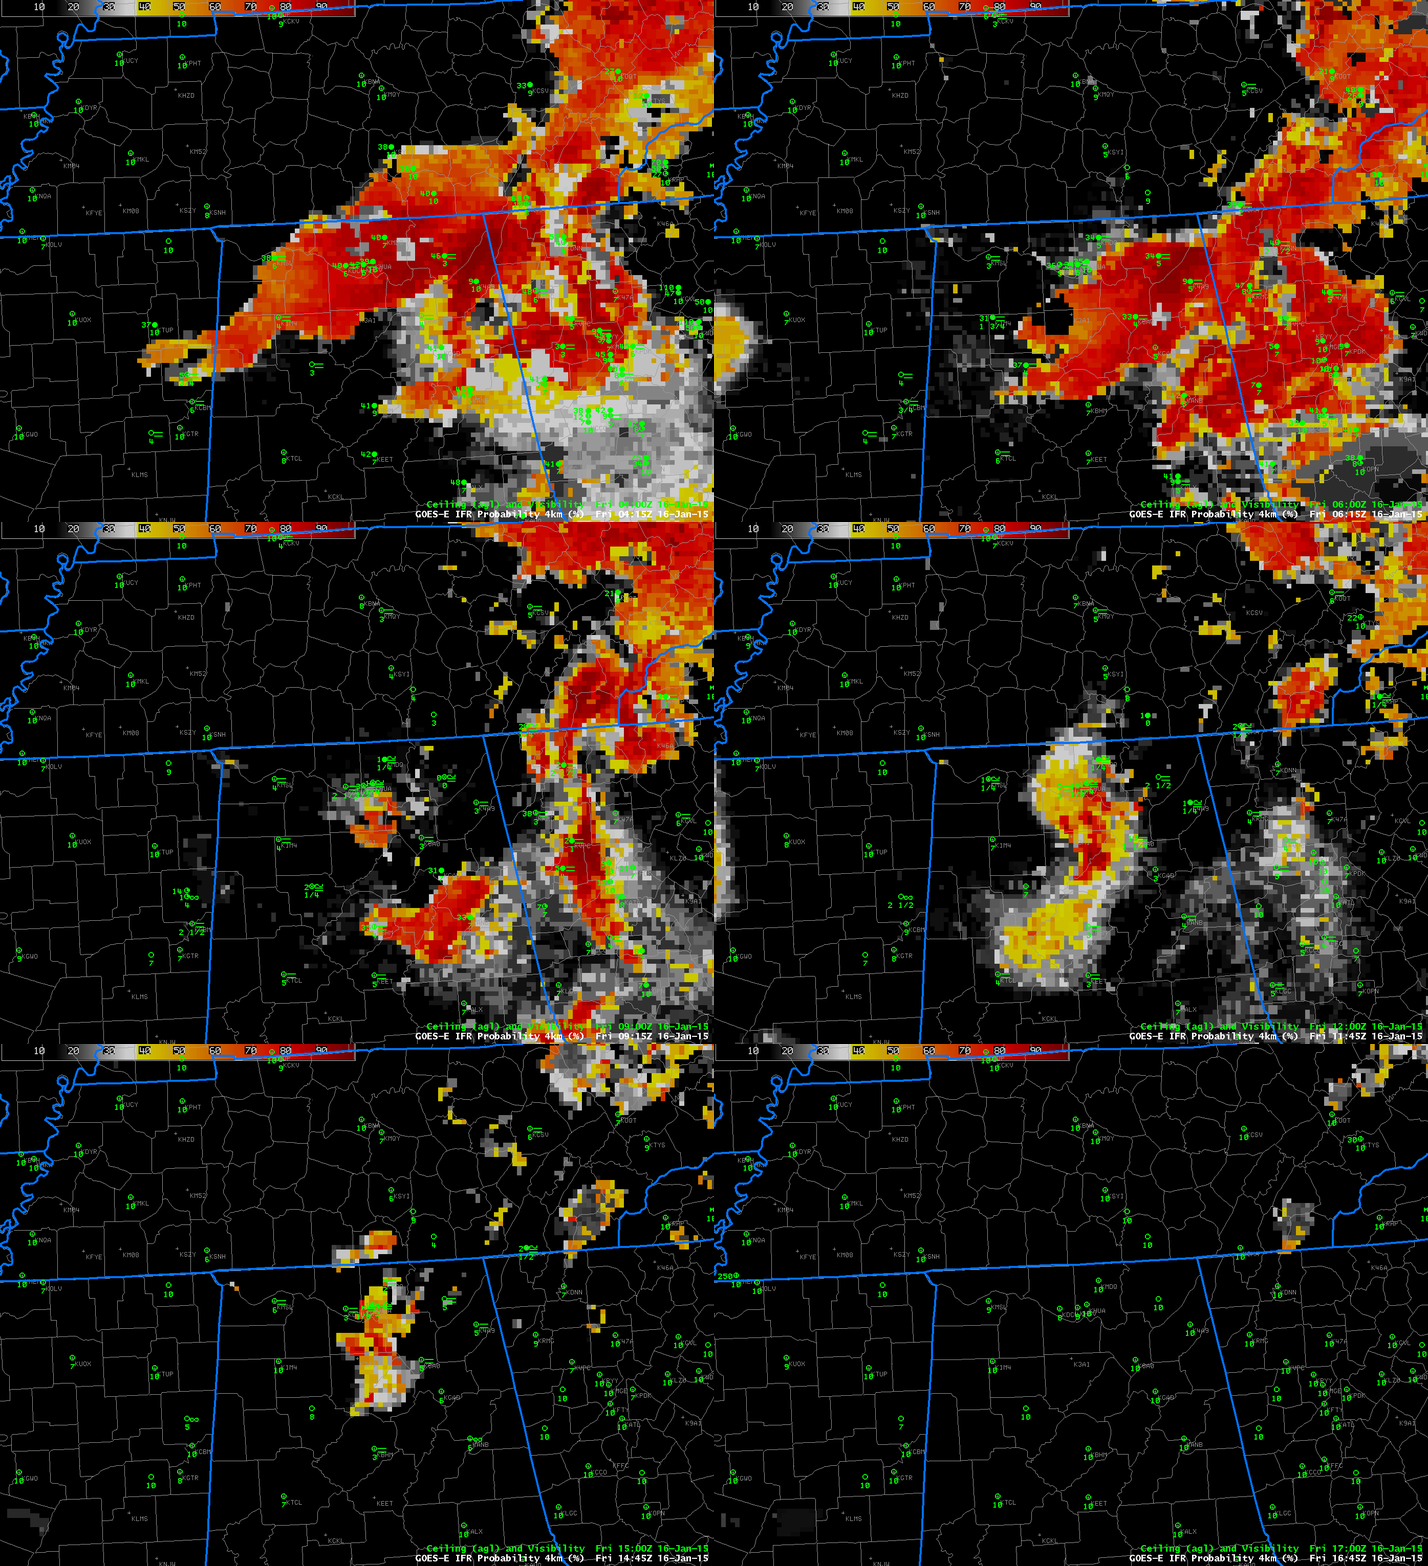
IFR Probability Fields, below, show a large stratus deck moving southward over Alabama, moving south of Hunstville by 0700 UTC. Clear skies allowed additional cooling and a radiation fog developed. The fog impeded transportation in and around Huntsville. IFR Probabilities increased around Huntsville after the large-scale stratus deck moved out, and remained high until around 1500 UTC when all fog dissipated. IFR Probability fields are computed using both satellite data and Rapid Refresh Model data. That IFR Probability is high over Huntsville and surroundings as the fog develops says that satellite data suggests water cloud development and that model data suggests near-surface saturation.

GOES_IFR_PROB_20150116

GOES-R IFR Probabilities, half-hourly imagery, 0415-1645 UTC, 16 January 2015 (Click to enlarge)

The fog was also diagnosed using traditional detection methods, such as the brightness temperature difference field from GOES-13 shown below. Brightness Temperature Difference fields detect both fog and elevated stratus, and it’s difficult for satellite data-only products to distinguish between the two cloud types because no surface information is included in a simple brightness temperature difference field.
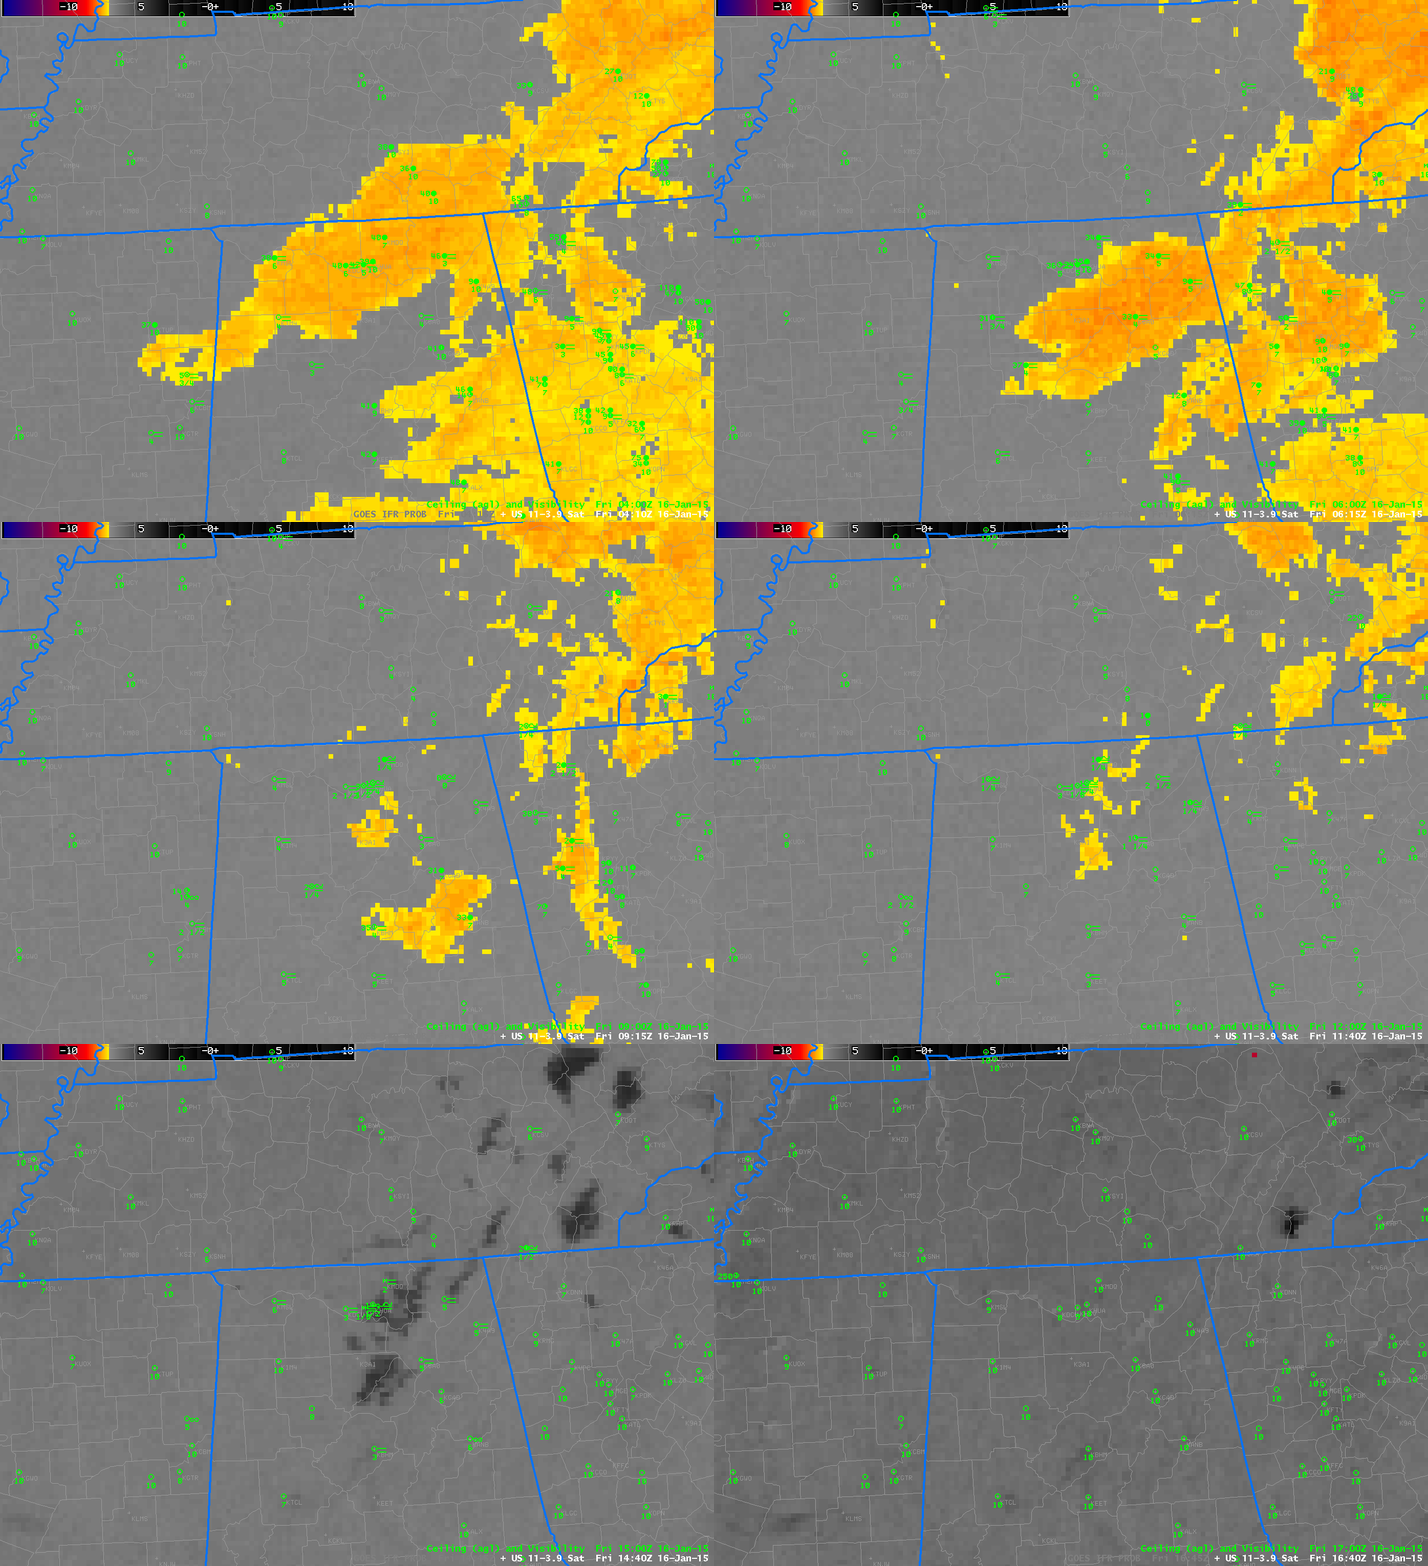
US_11-3.9_Sat_20150116

GOES-13 Brightness Temperature Differences (10.7µm – 3.9µm), half-hourly imagery, 0410-1645 UTC, 16 January 2015 (Click to enlarge)

For a small-scale event such as this, polar orbiting satellites can give sufficient horizontal resolution to give important information. MODIS data from Terra or Aqua can be used to compute IFR Probabilities, and a toggle between the MODIS brightness temperature difference field, and the MODIS-based IFR Probabilities at 0704 UTC is below; unfortunately, Terra and Aqua were not overhead when the fog was at its most dense, but a thin filament of fog/High IFR Probability is developing south of Huntsville in a river valley.
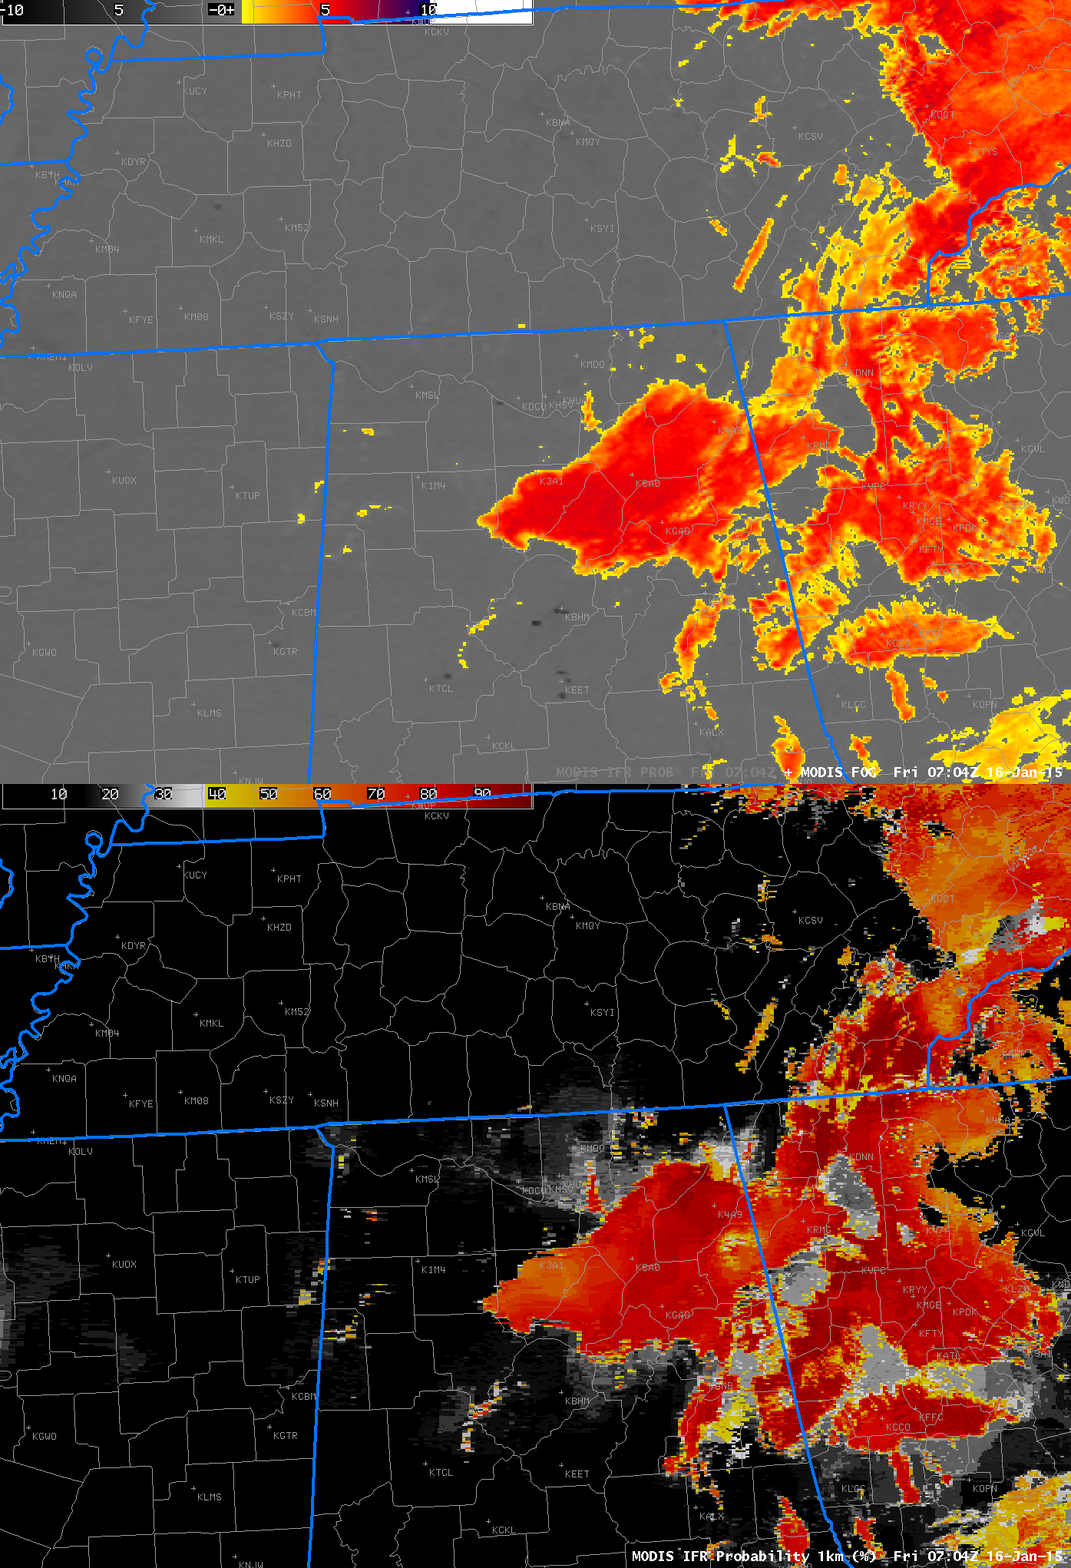
MODIS_IFR_PROB_BTD_20150116_0704

MODIS Brightness Temperature Difference and MODIS-based IFR Probabilities at 0704 UTC on 16 January 2015 (Click to enlarge)

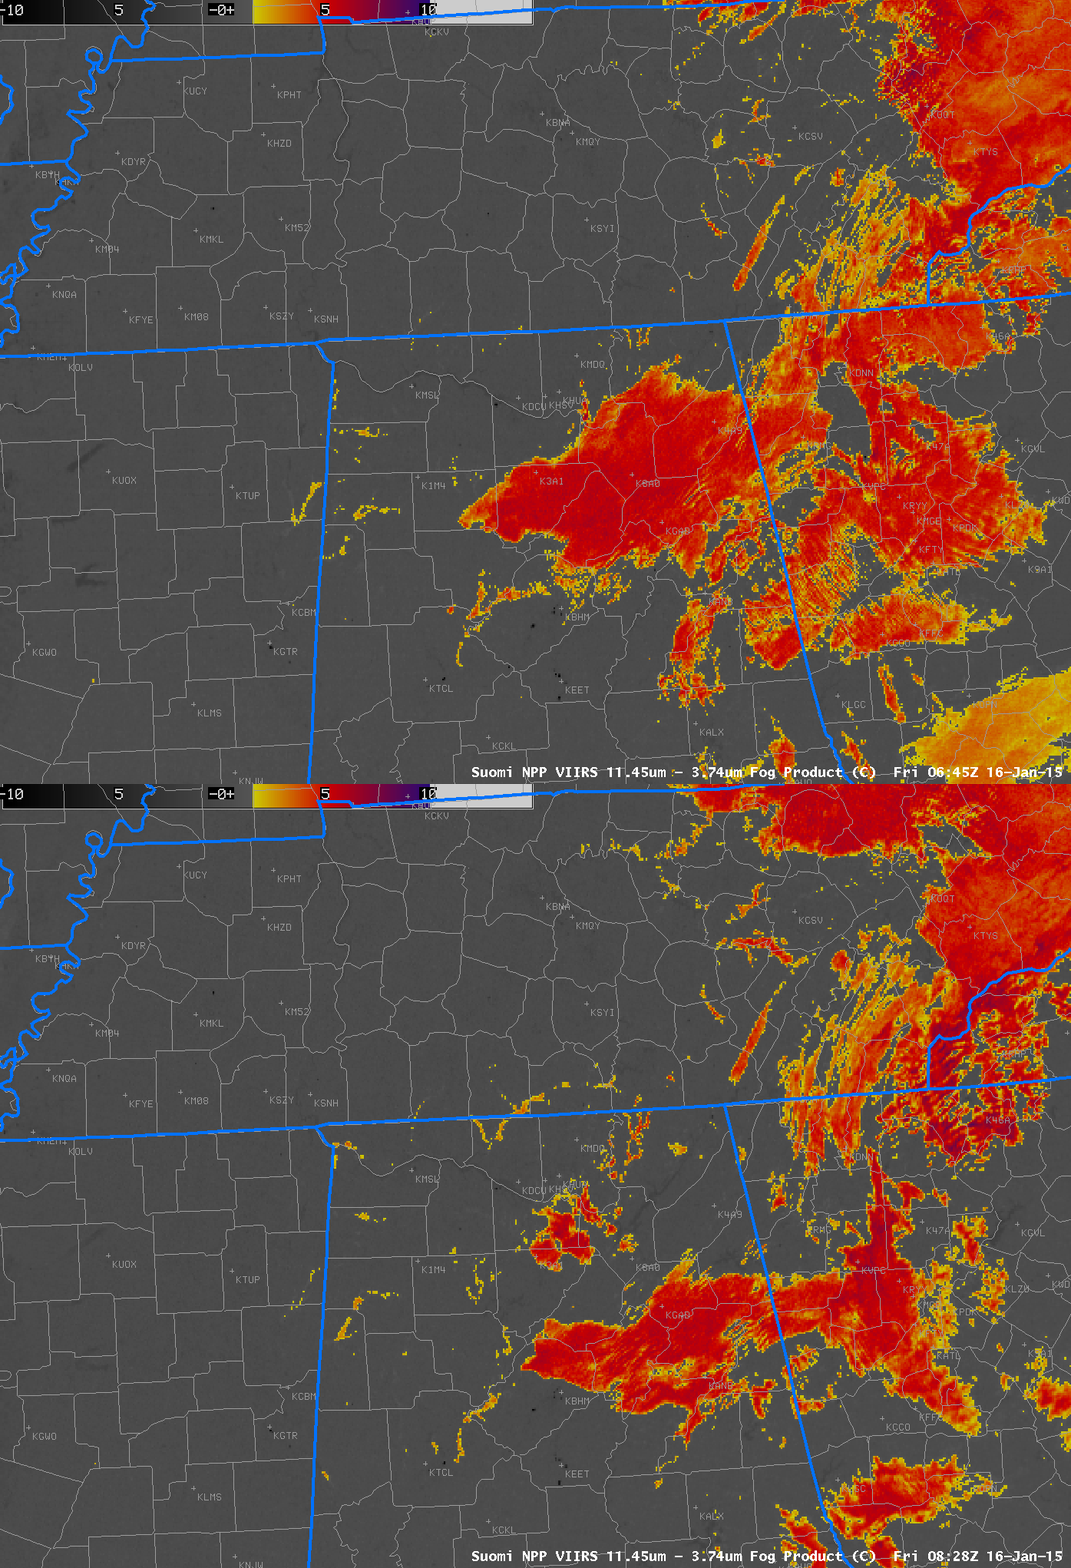
Suomi NPP was positioned such that northern Alabama was viewed on two successive orbits, and the toggle below shows the brightness temperature difference field (11.35 – 3.74). Similar to GOES, Suomi NPP Brightness Temperature Difference fields show the development of water-based clouds in/around Huntsville.

VIIRS_FOG_20150116_0645_0828

Suomi NPP Brightness Temperature Difference fields at 0645 and 0828 UTC, 16 January 2015 (Click to enlarge)

When Cirrus overlies Fog

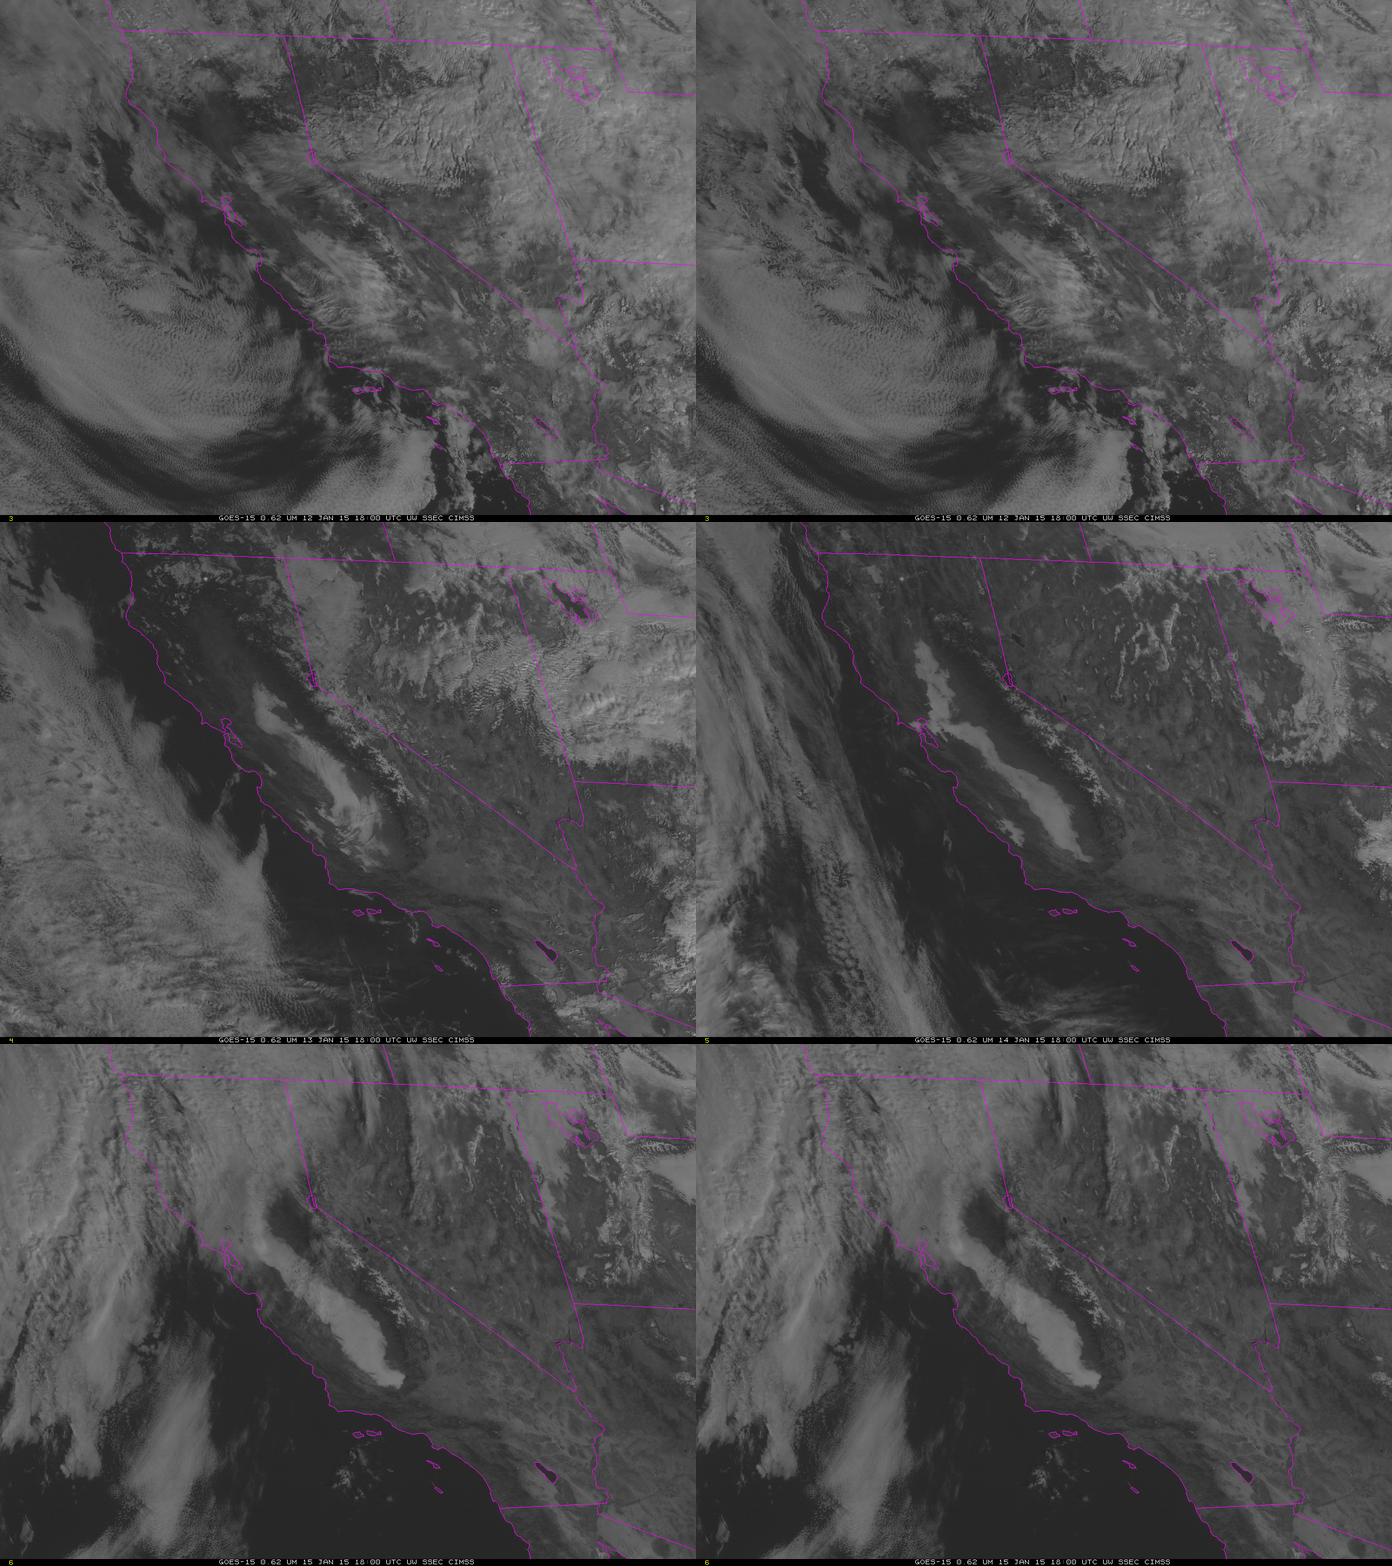
GOES15_VIS_2015_01_12_15

GOES-15 Visible Imagery at 1800 UTC on 12-15 January 2015 (Click to enlarge)

Fog and low stratus has persisted in California’s central valley during the week of 12-16 January 2015. The visible imagery above shows the extent of the fog/low stratus at 1800 UTC on 12-15 January.

During the early morning hours of 16 January, high cirrus started to overspread the central Valley (That cirrus is apparent in the visible iamgery from 15 January above). The presence of cirrus makes use of the traditional method of fog detection — brightness temperature difference — problematic because the satellite no longer senses radiation from the low clouds; rather, cirrus radiation is being detected.

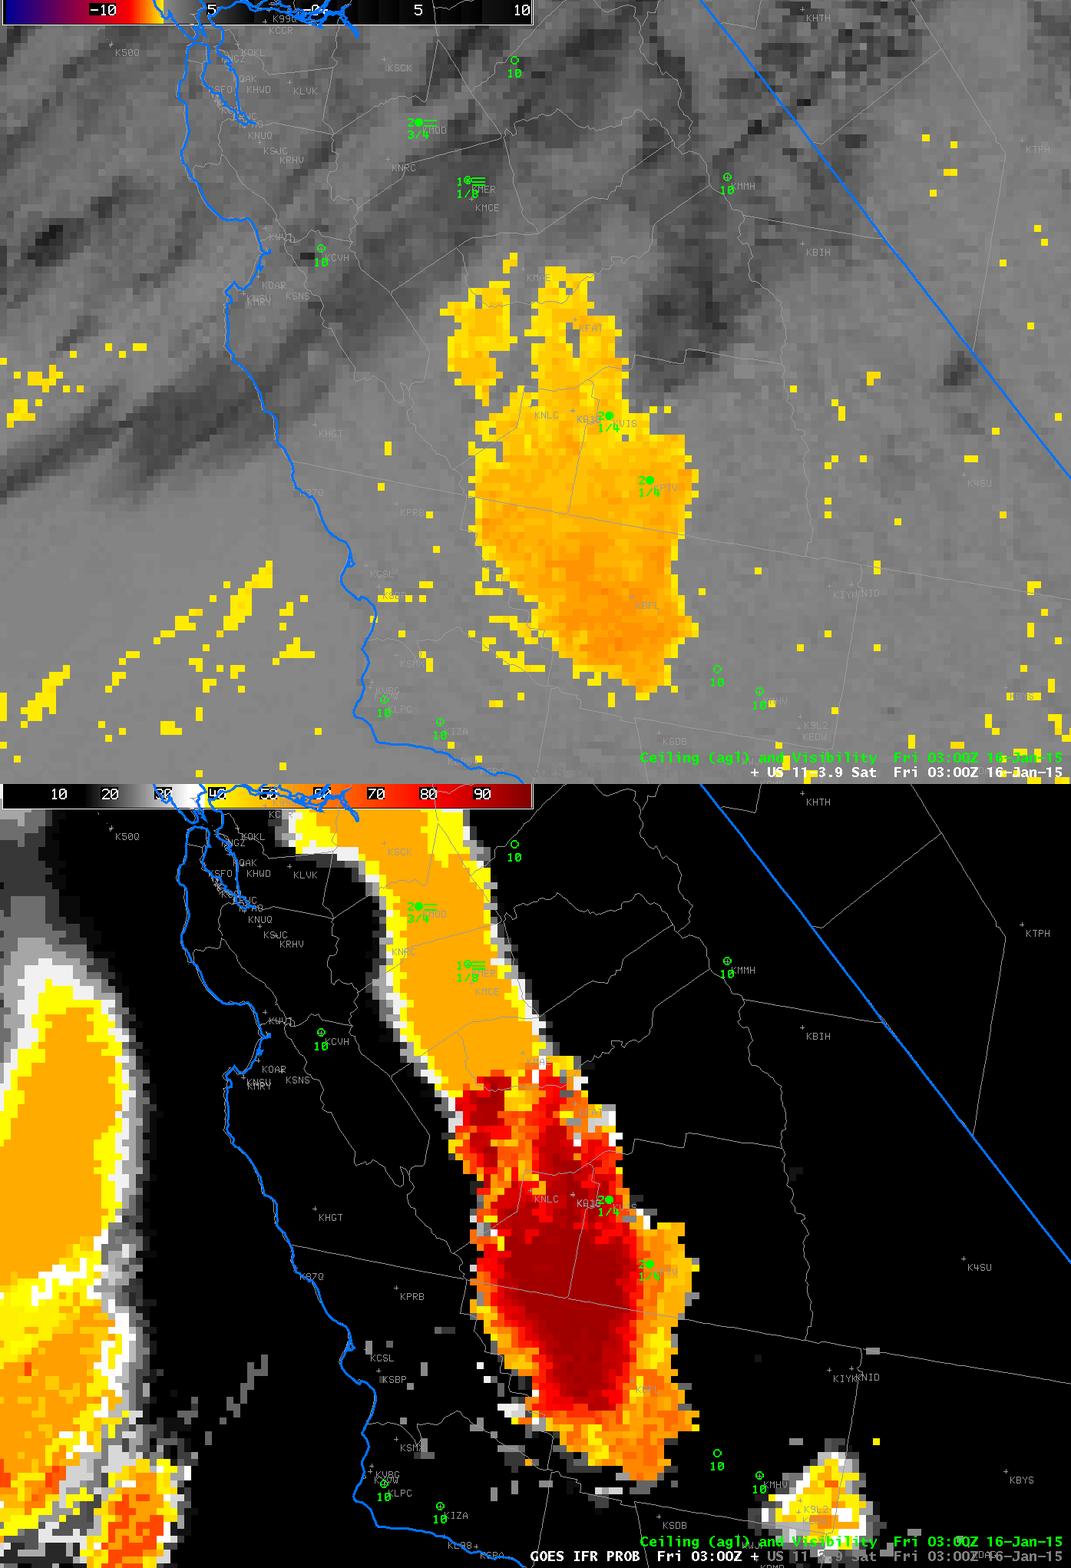
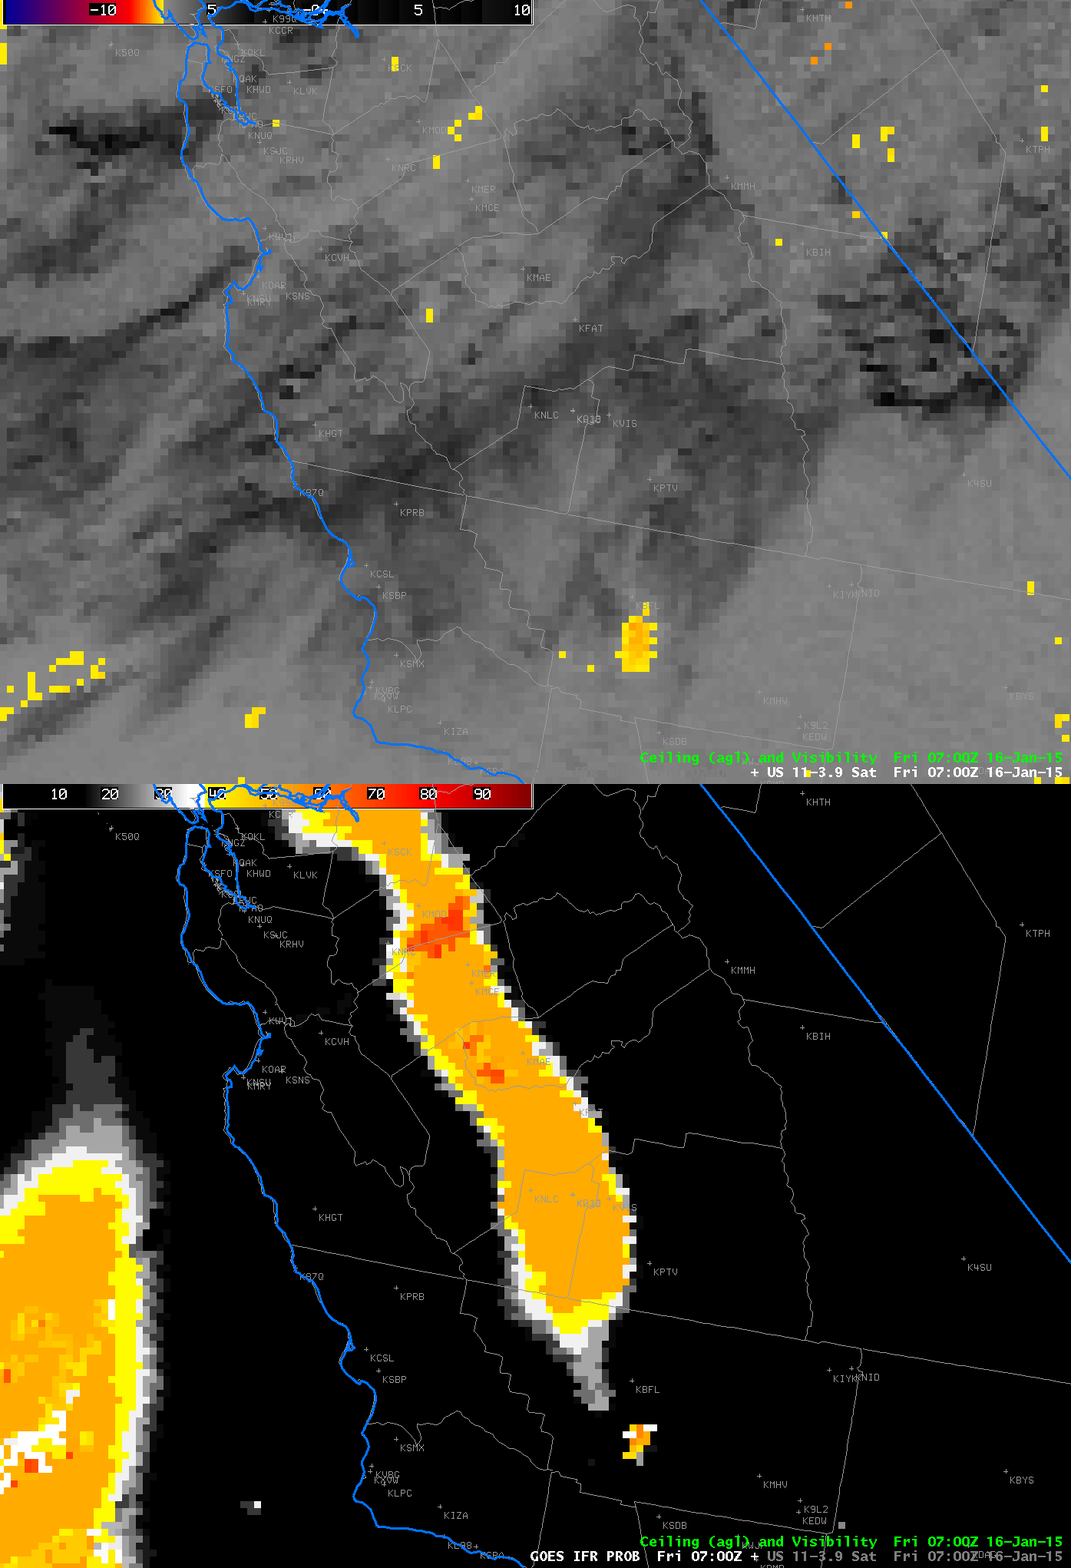
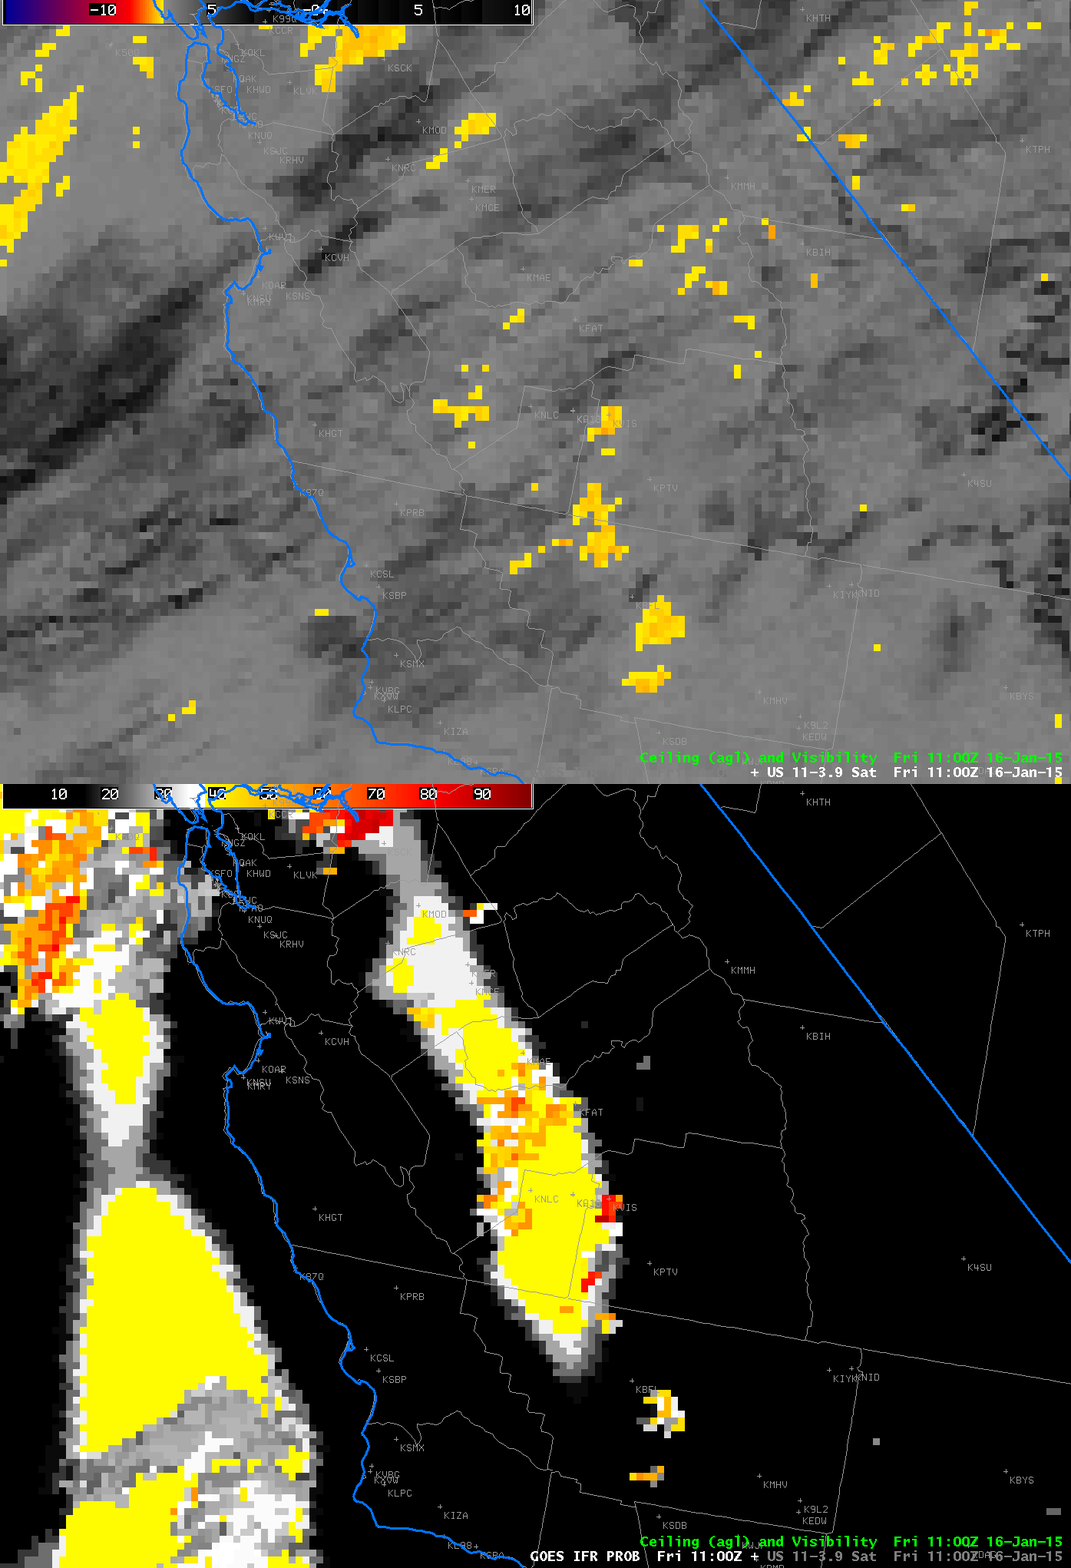
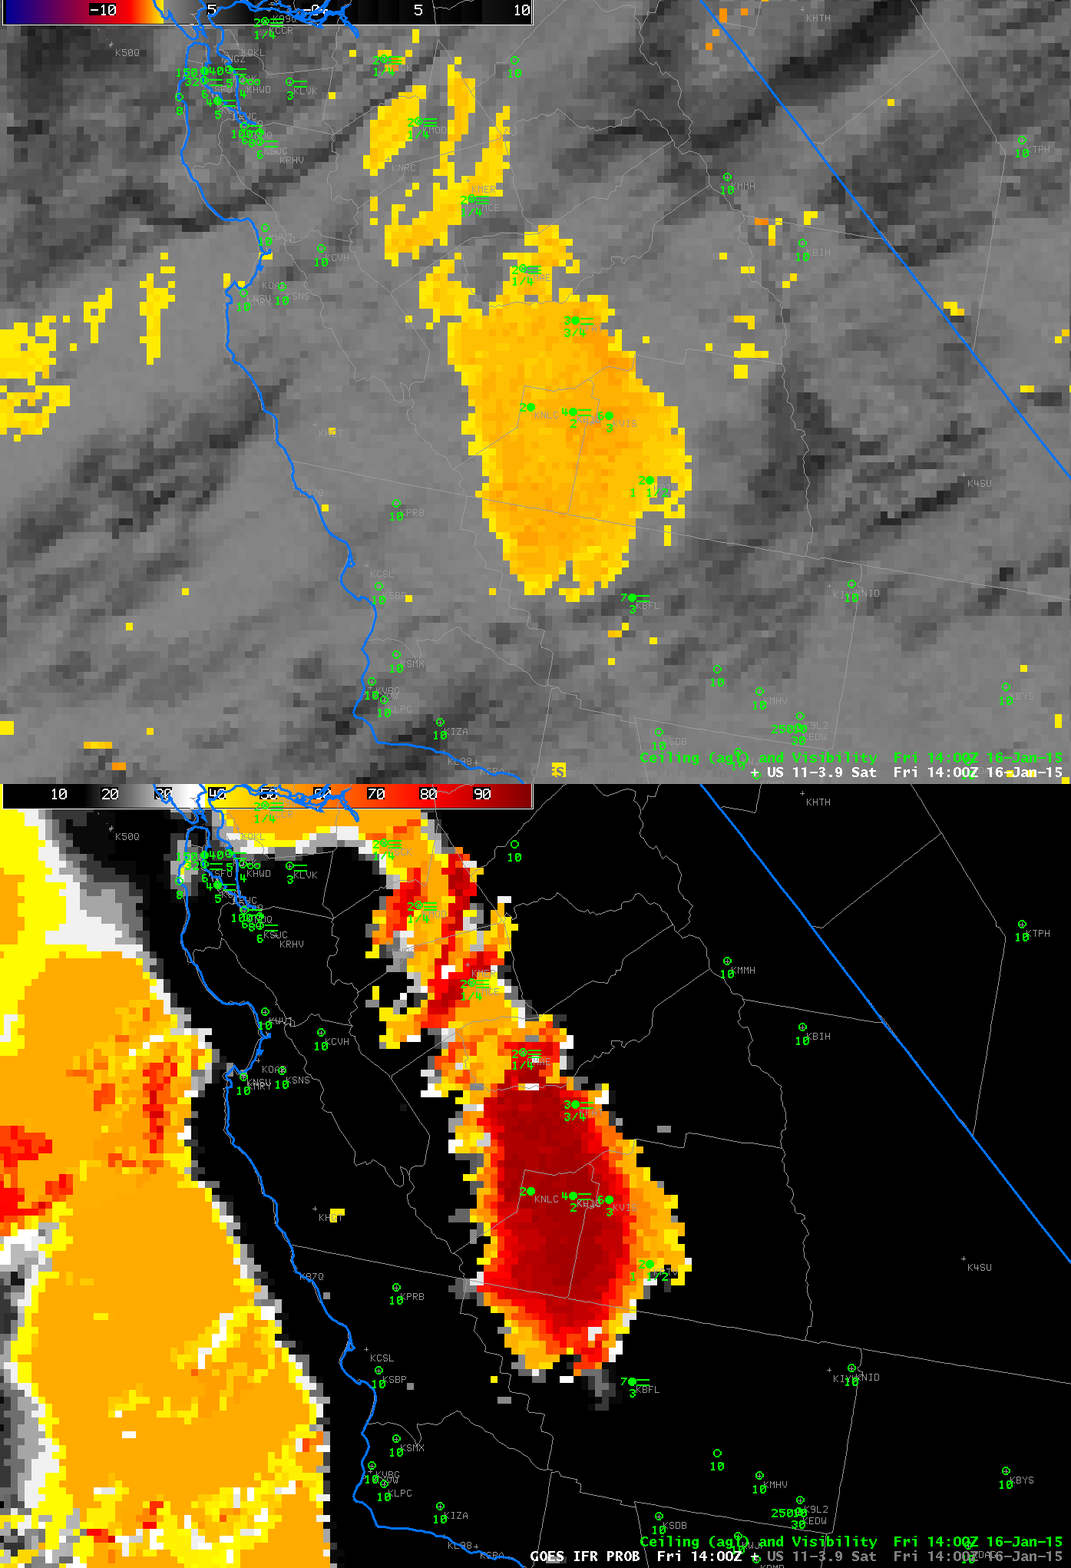
The four toggles below show Brightness temperature Difference and GOES-R IFR Probabilities at 0300 (top), 0700 (second from top), 1100 (second from bottom) and 1400 UTC (bottom) on 16 January 2015. At 0300 UTC, cirrus has overspread the northern part of the central Valley. At this time Merced, CA, shows IFR conditions. IFR Probabilities under the cirrus there show a flat field characteristic of conditions when IFR Probabilities are governed by Rapid Refresh data only. Probabilities are higher where satellite data are also included as predictors.

At 0700 UTC and 1100 UTC, cirrus has overspread the entire valley (with occasional breaks). Values of GOES-R IFR Probability are therefore suppressed, so interpretation of the IFR Probability value should be tempered by knowledge of the cloud field. A low value under clear skies means something different than a low value under a cirrus canopy. Under a cirrus canopy, the accuracy of the GOES-R IFR Probability Field depends on the accuracy of the Rapid Refresh model.

AT 1400 UTC, as the cirrus shield retreats, IFR Probabilities increase again over the central Valley.

GOES_IFR_PROB_BTD_20150116_0300

Toggle between GOES-R IFR Probabilities from GOES-15 and Brightness Temperature Difference Fields, 0300 UTC 16 January 2015 (Click to enlarge)

GOES_IFR_PROB_BTD_20150116_0700

Toggle between GOES-R IFR Probabilities from GOES-15 and Brightness Temperature Difference Fields, 0700 UTC 16 January 2015 (Click to enlarge)

GOES_IFR_PROB_BTD_20150116_1100

Toggle between GOES-R IFR Probabilities from GOES-15 and Brightness Temperature Difference Fields, 1100 UTC 16 January 2015 (Click to enlarge)

GOES_IFR_PROB_BTD_20150116_1400

Toggle between GOES-R IFR Probabilities from GOES-15 and Brightness Temperature Difference Fields, 1400 UTC 16 January 2015 (Click to enlarge)