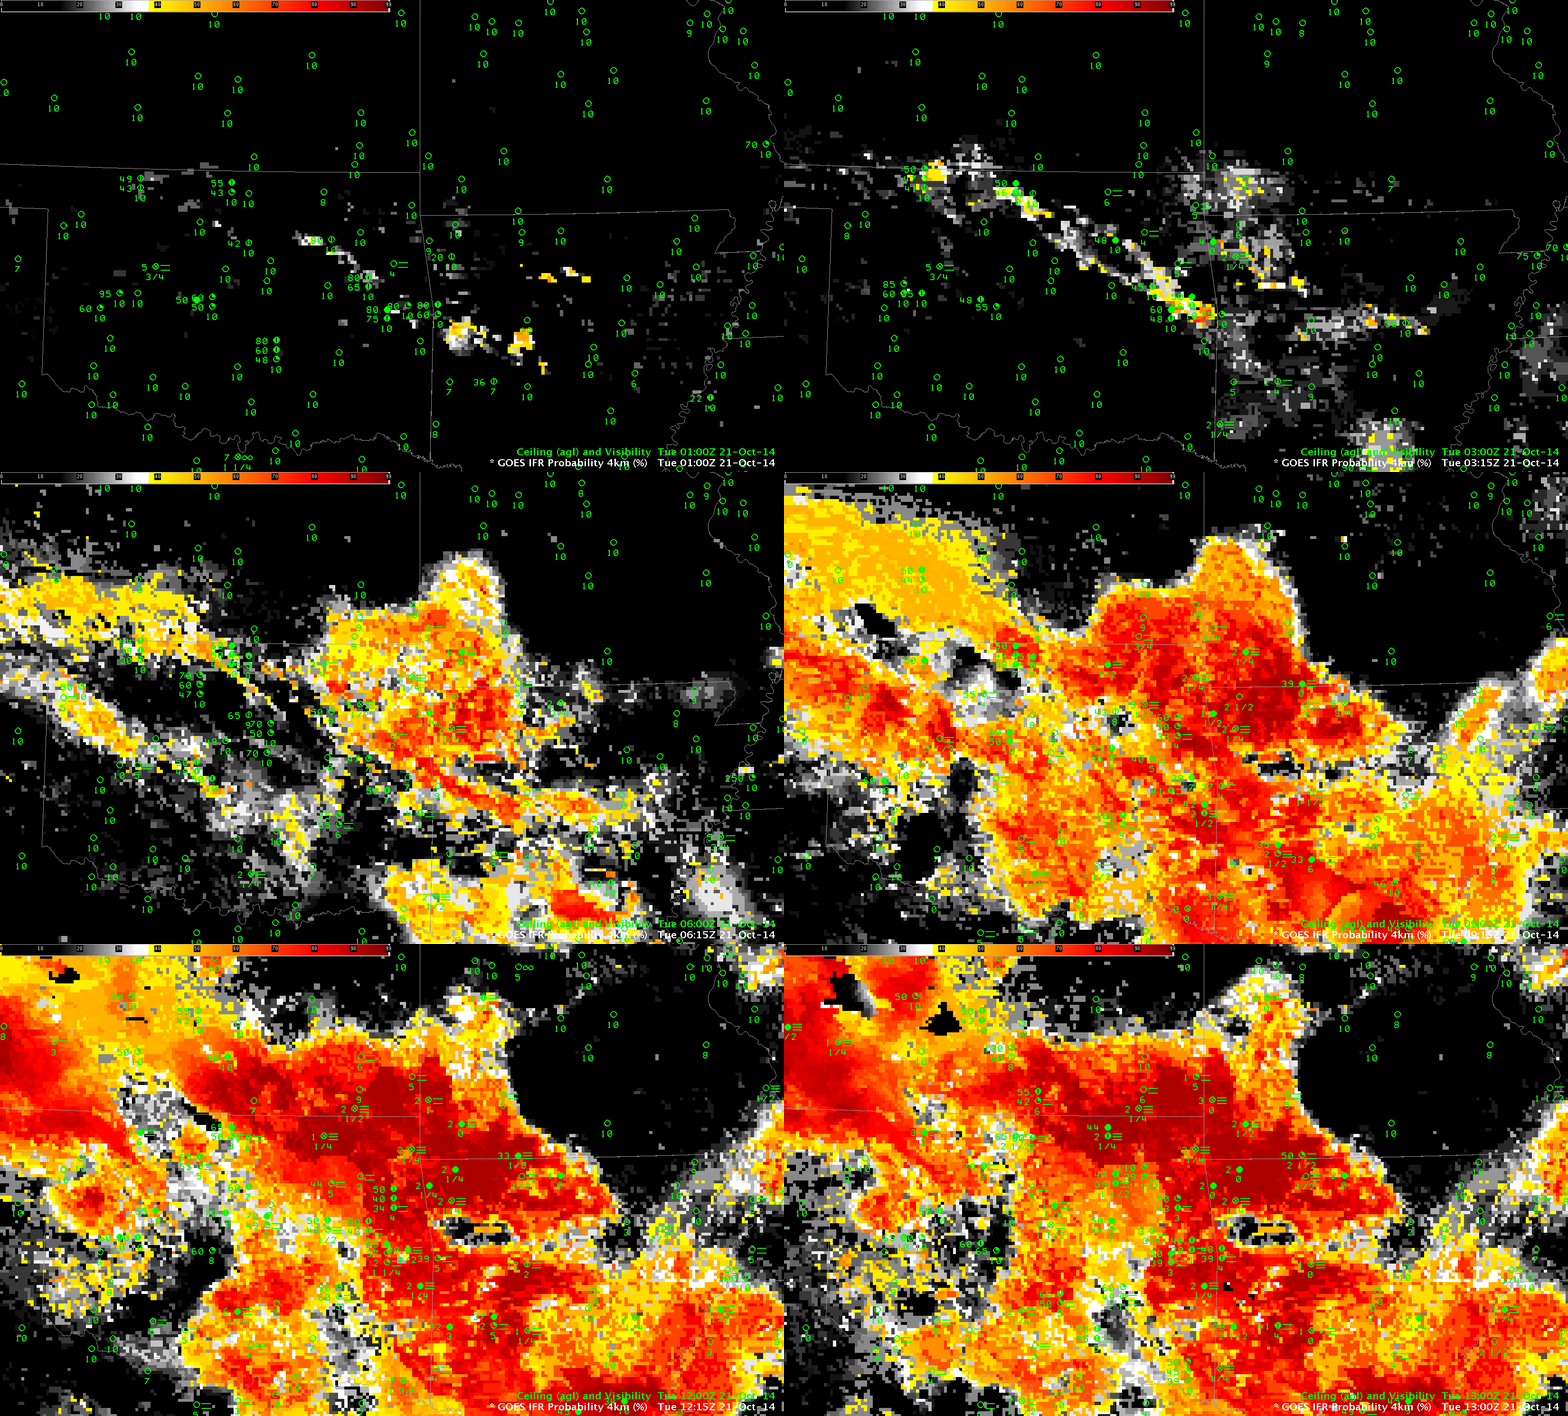
GOES-IFR Probabilities, computed from GOES-13 and Rapid Refresh, hourly from 0100 through 1300 UTC on 21 October 2014 (Click to enlarge)
Fog and stratus developed overnight over the Ozark Mountains and southern Plains. The hourly loop of GOES-R IFR Probabilities shows the development and expansion of visibility and ceiling reductions over the area. How do these fields compare to other measures of fog? Brightness Temperature Difference fields, below, generally overestimate the regions of fog. The 0200 and 0800 UTC brightness temperature difference fields, below, are toggled with the IFR Probabilities; the inclusion of surface information via the Rapid Refresh Model correctly limits the positive brightness temperature difference to regions where fog and low stratus are most likely. The satellite-only signal overpredicts regions of reduced visibilities because it can only see the top of the cloudbank; this offers little information about the cloud ceilings!
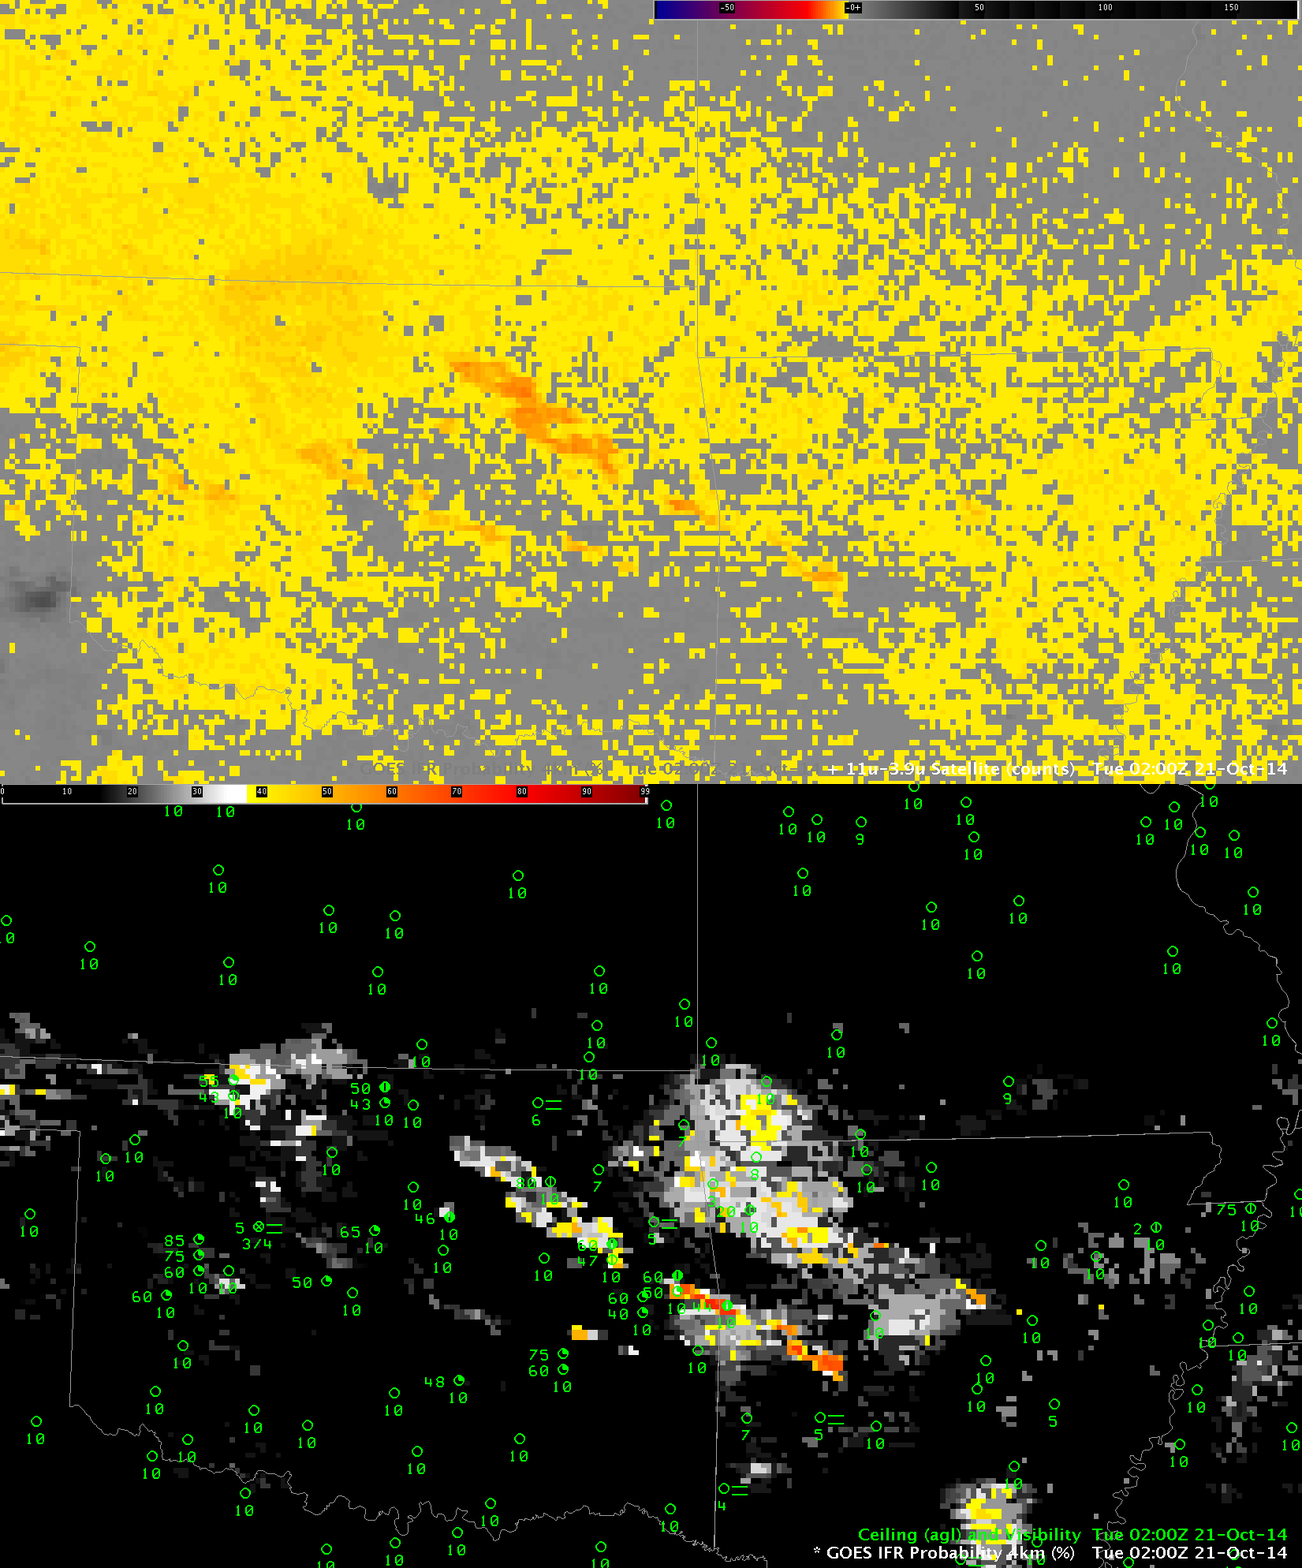
GOES-13 Brightness Temperature Difference (10.7 µm – 3.9 µm) and GOES-based IFR Probabilities at 0200 UTC, 21 October 2014 (Click to enlarge)
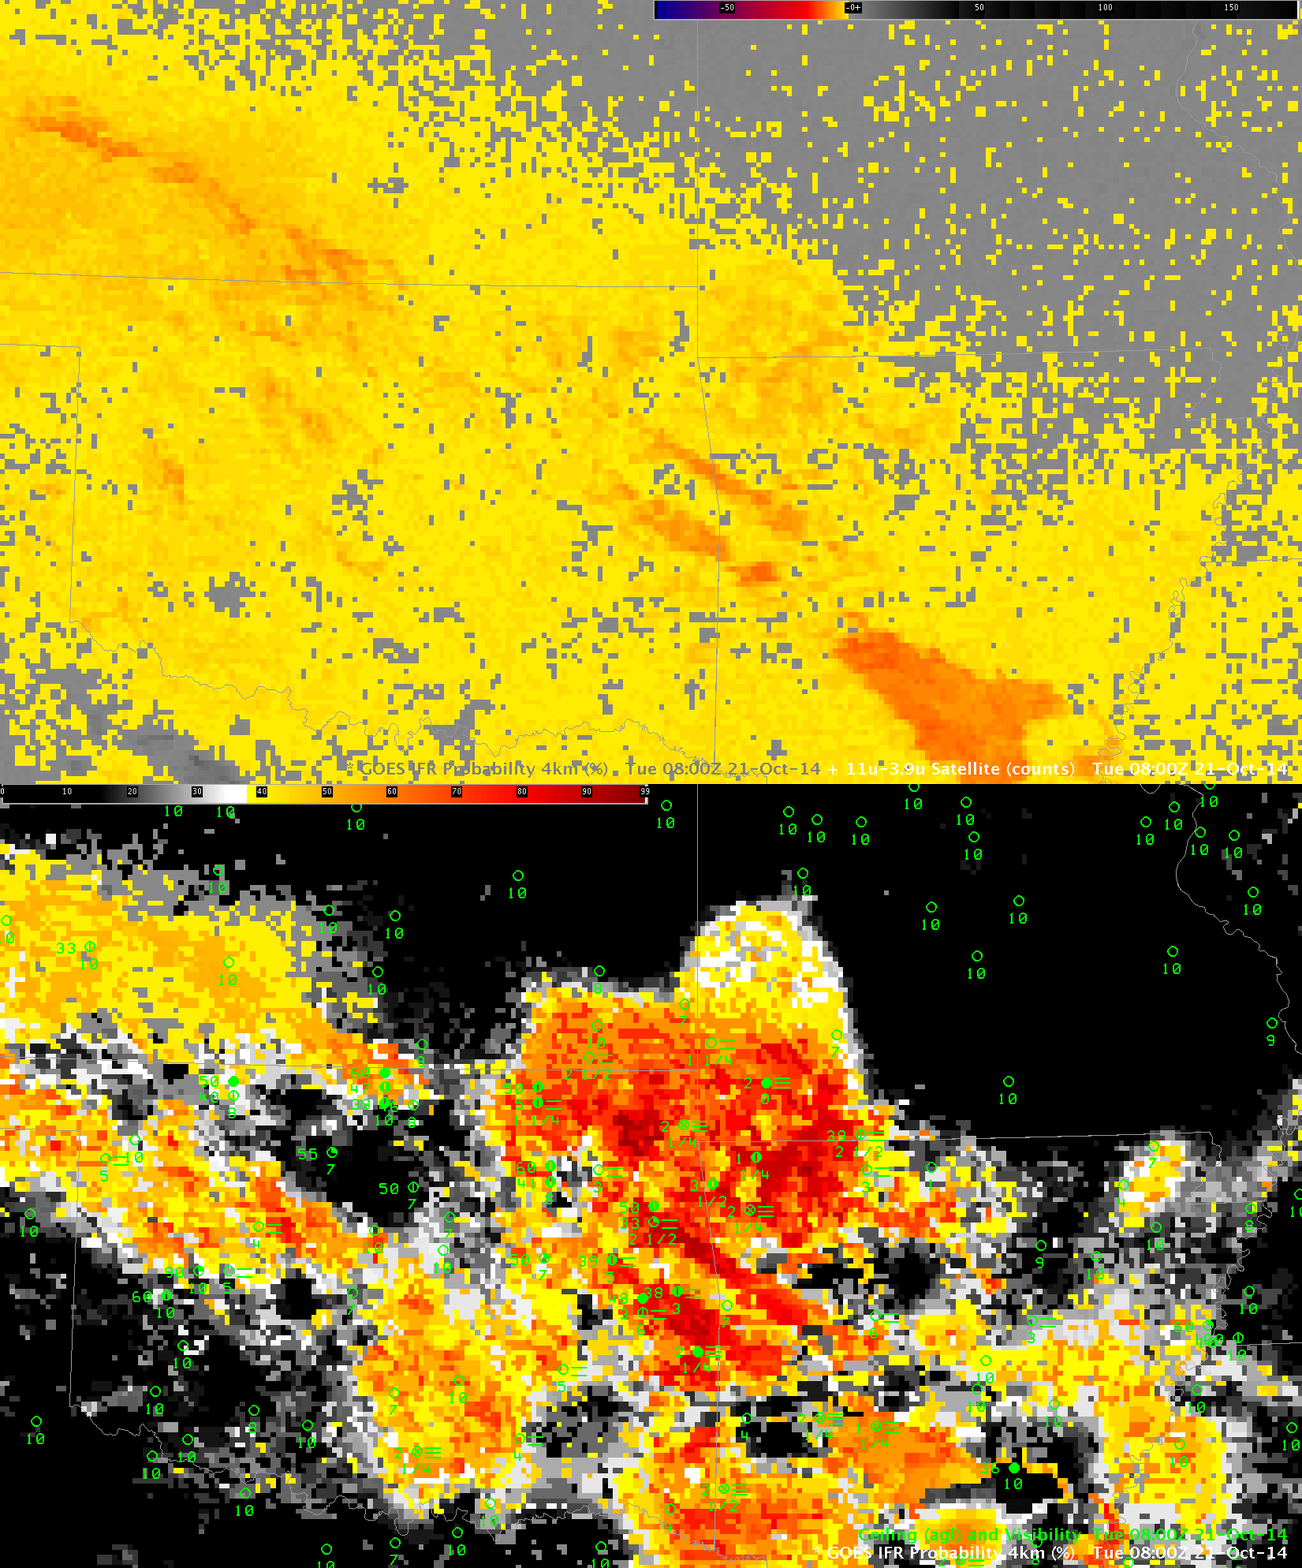
GOES-13 Brightness Temperature Difference (10.7 µm – 3.9 µm) and GOES-based IFR Probabilities at 0800 UTC, 21 October 2014 (Click to enlarge)
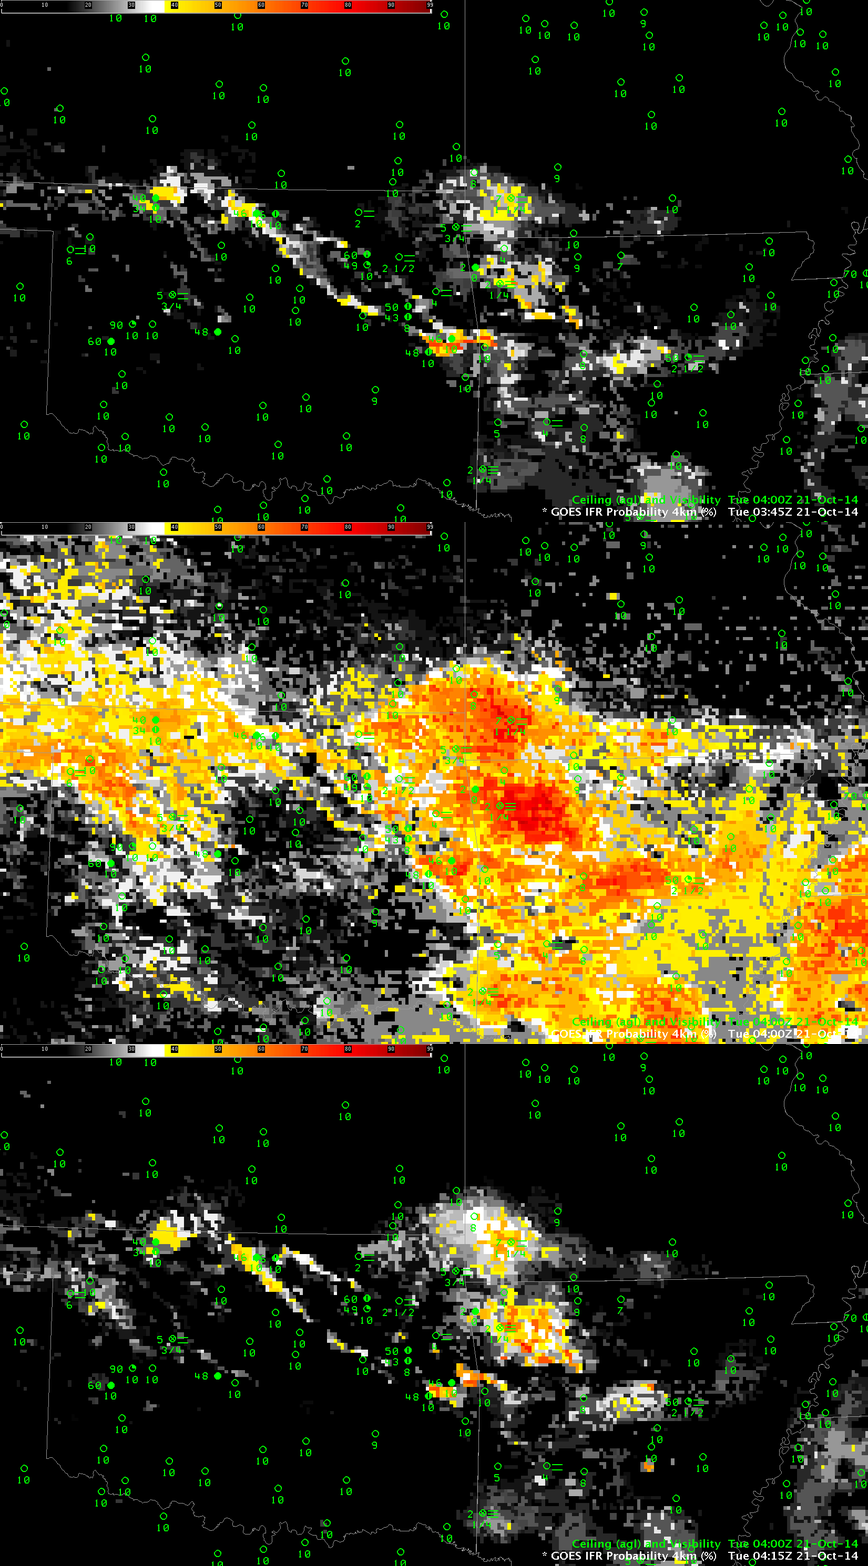
Brightness Temperature Difference fields are occasionally contaminated by stray light in the signal. This happened on 21 October at 0400 UTC. The Brightness Temperature Difference fields at 0345, 0400 and 0415 UTC are shown below, with the GOES-R IFR Probabilities for the same time follow. Note how Stray Light contamination does bleed into the GOES-R IFR Probability field; if there is a large change over 15 minutes in the IFR Probability signal, consider the possible reasons for that change. Stray light contamination is a strong candidate if the signal is near 0400-0500 UTC with GOES-East. There are regions in the IFR Probability fields where even the strong — but meteorologically unimportant — brightness temperature difference signal during stray light is not enough to overcome the information from the Rapid Refresh model that denies the possibility of low-level saturation (for example, in northern Kansas or southern Oklahoma).
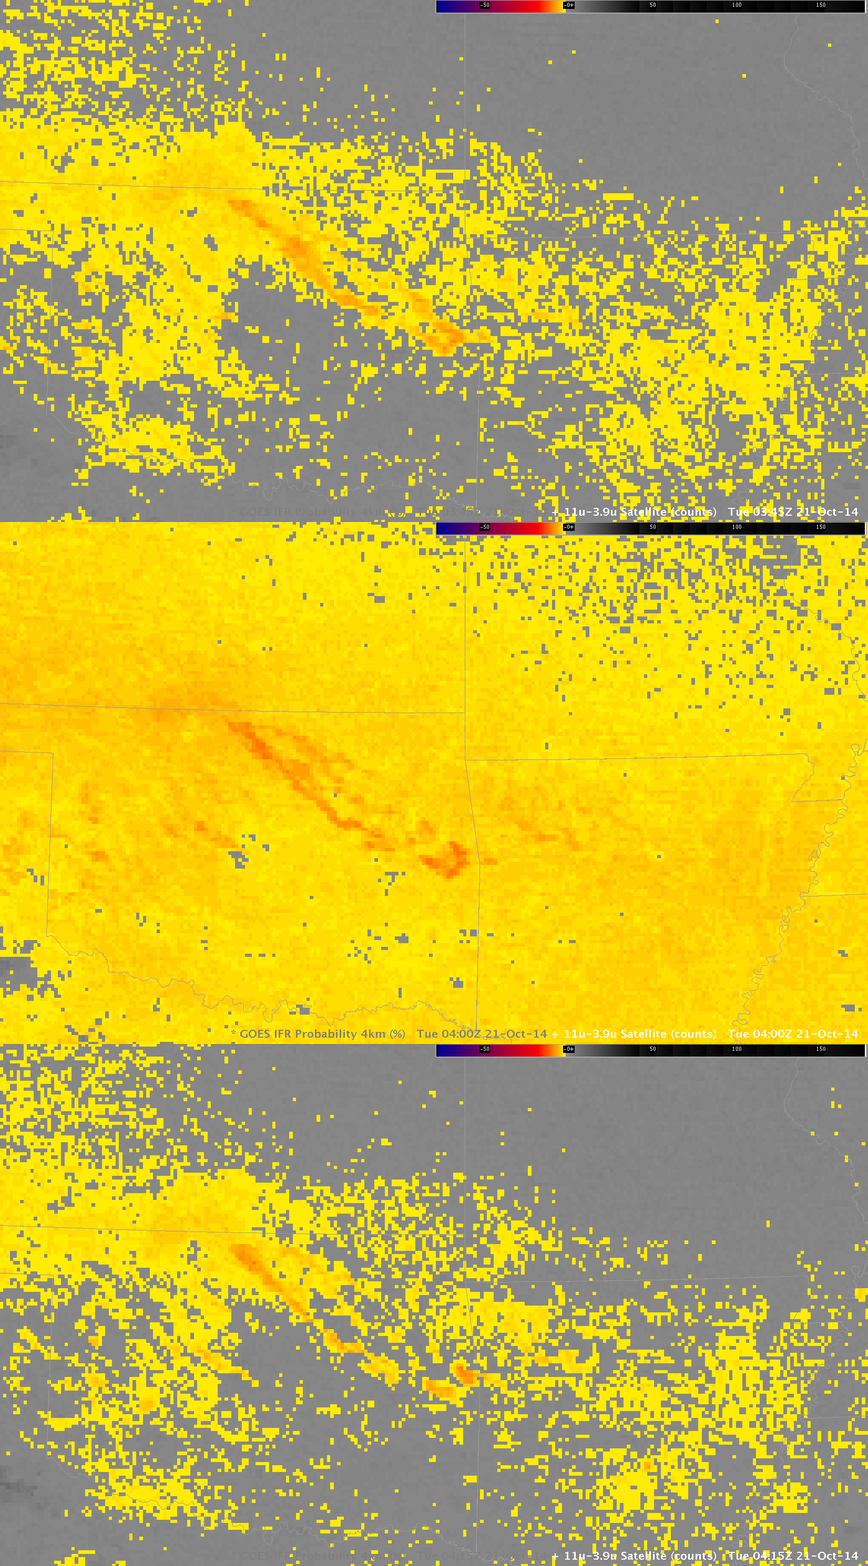
GOES-13 Brightness Temperature Difference (10.7 µm – 3.9 µm) at 0345, 0400 and 0415 UTC, 21 October 2014 (Click to enlarge)
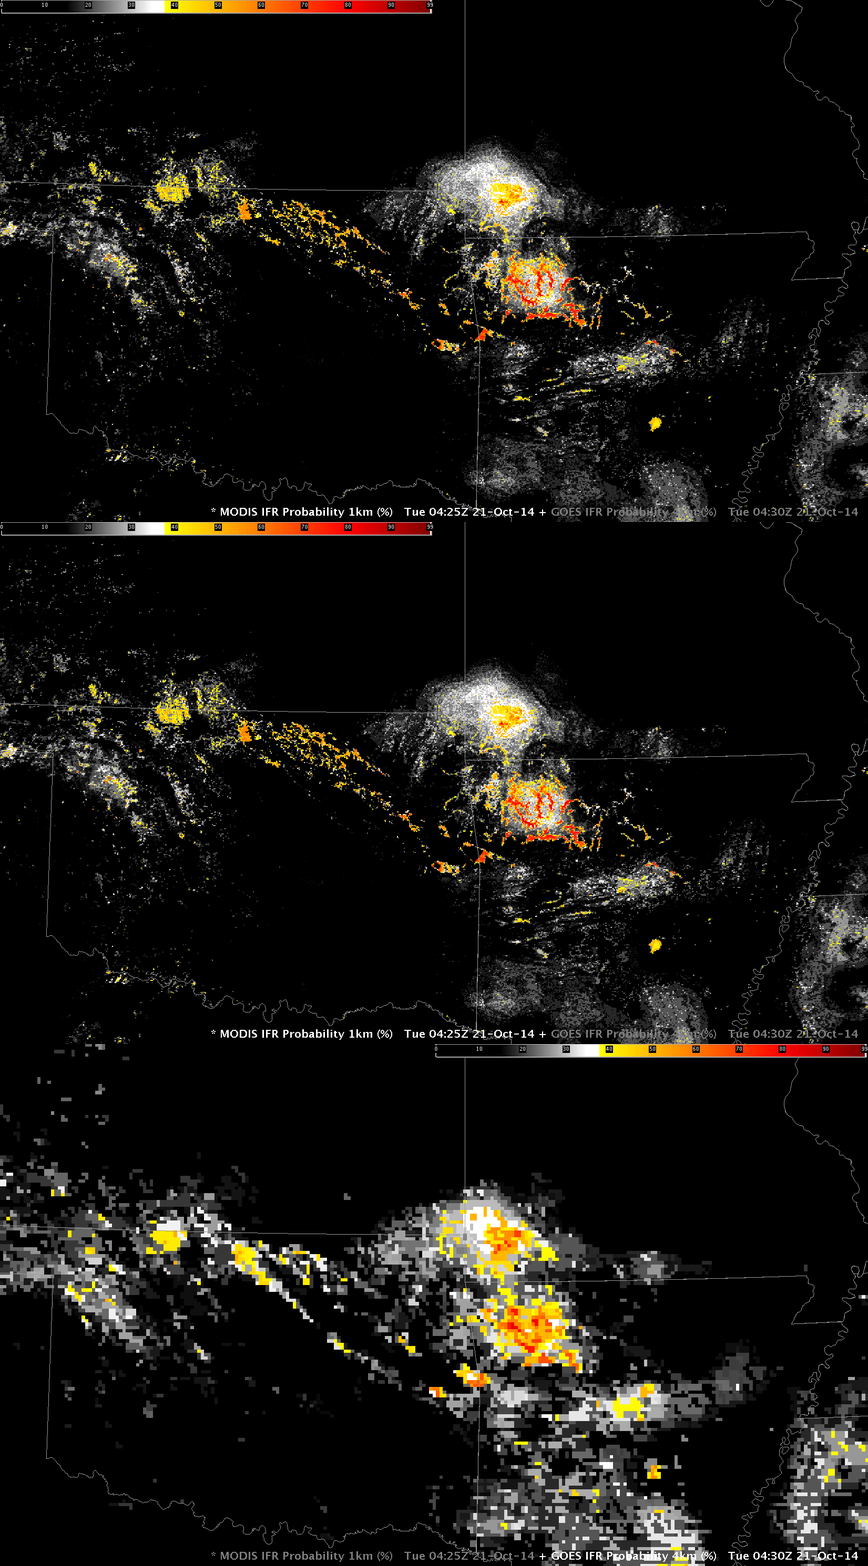
MODIS data from either Terra or Aqua can give important early alerts to the development of Fog/Low Stratus. Because of its superior resolution to GOES, the character of the developing fog can be depicted with more accuracy. The MODIS-based IFR Probability, below, in a toggle with the GOES-based IFR Probability at the same time, distinctly shows that the fog development at 0430 UTC is starting in the small valleys of the Ozarks of northwest Arkansas. GOES-based IFR Probabilities give a broader signal; certainly if you are familiar with the topography of the WFO you can correctly interpret the coarse-resolution GOES data, but the MODIS data spares you that necessity.
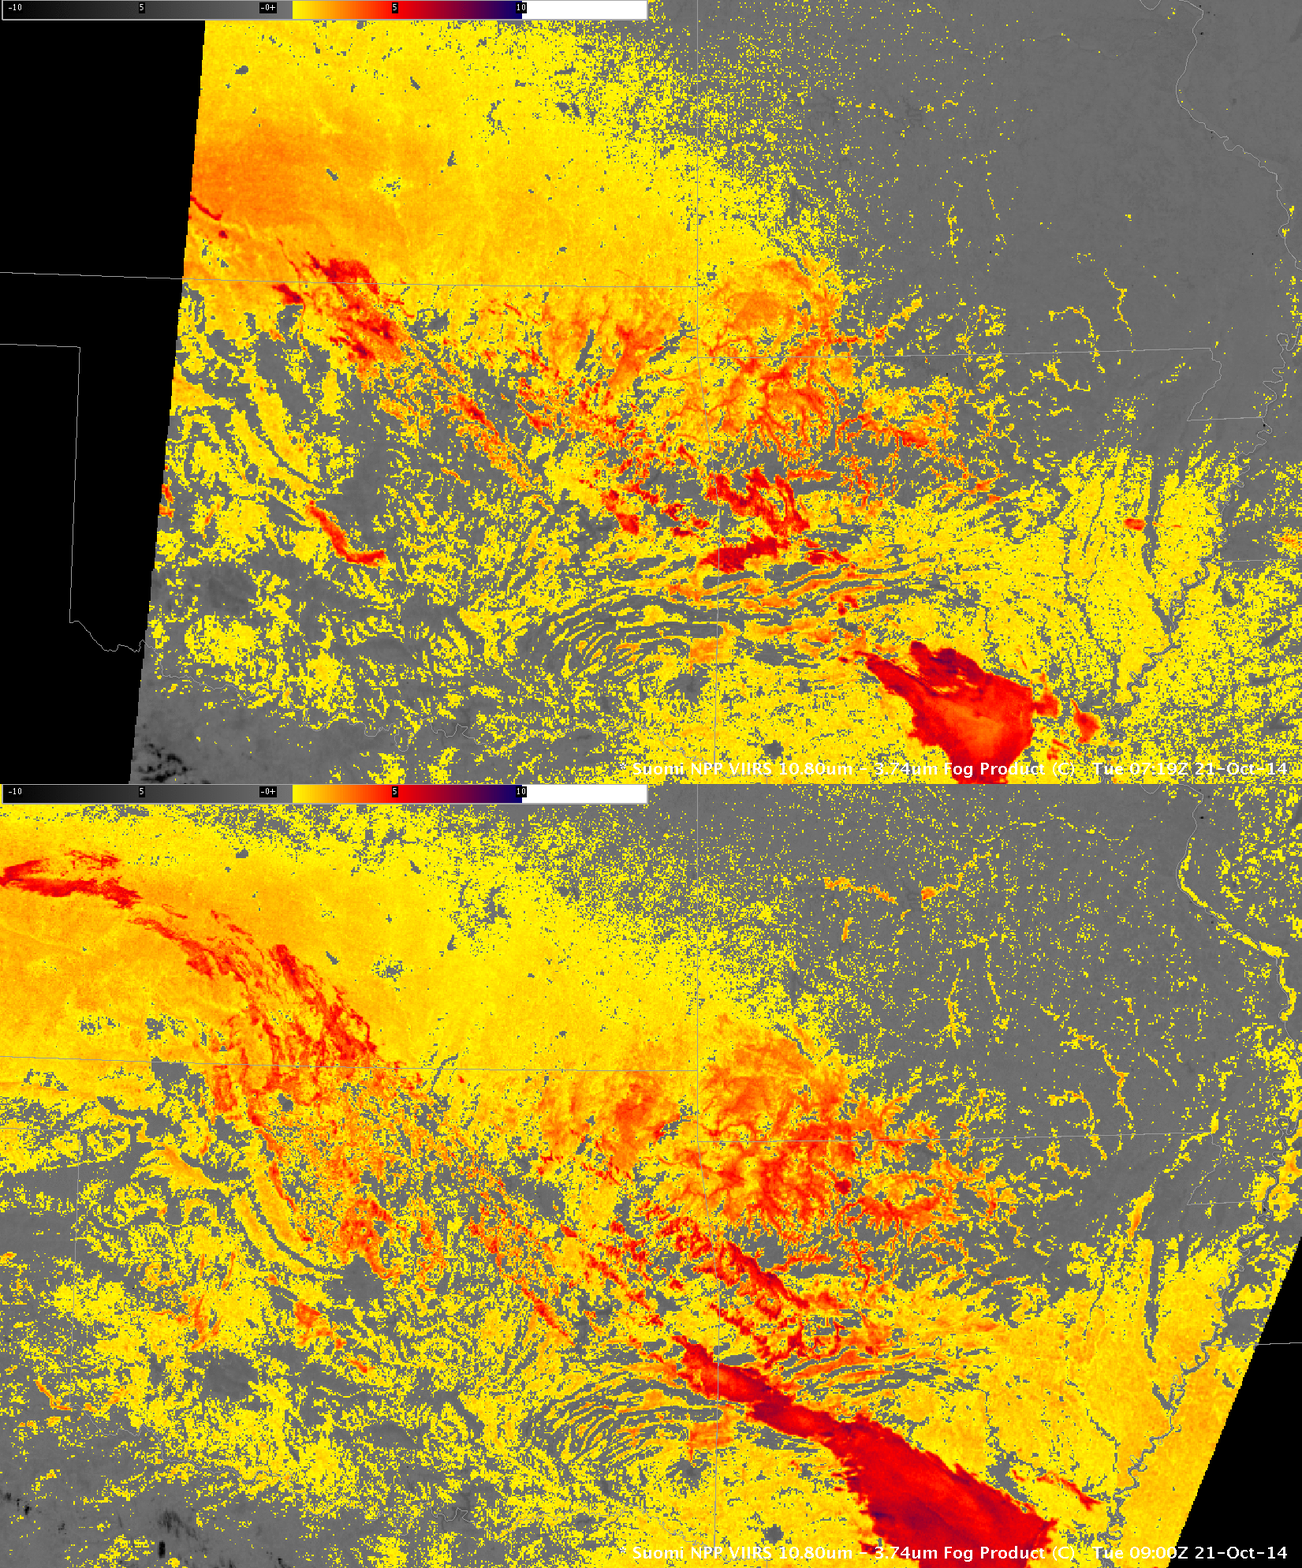
Suomi NPP data can also be used to compute IFR Probabilities, but those data are not yet computed for AWIPS. The Ozarks were properly positioned on 21 October to be scanned by two successive orbits of Suomi NPP (one of the benefits of Suomi NPP’s relatively broad scan), and the brightness temperature difference fields (11.45µm – 3.74µm) at 0715 and 0900 UTC are shown below. As with MODIS, the strong signal in the river valleys is apparent. (The Day Night band from Suomi NPP for this event does not show a strong signal because the near-new Moon provides no illumination at 0745 or 0900 UTC: it hasn’t even risen yet.)

