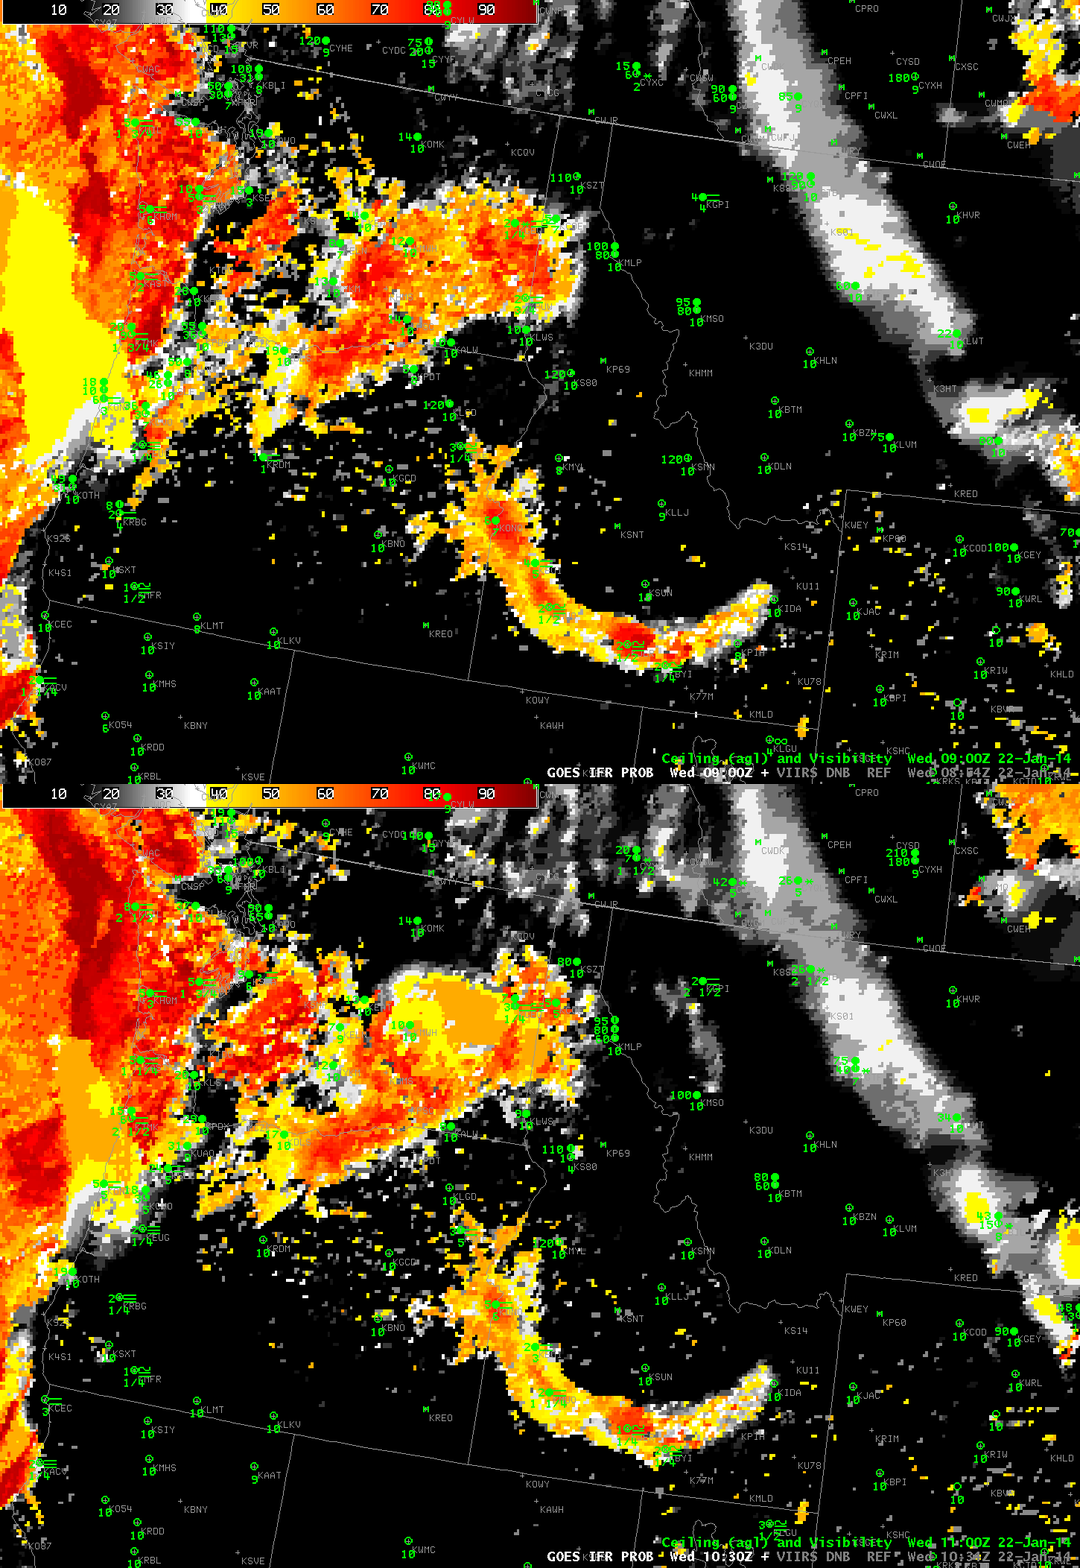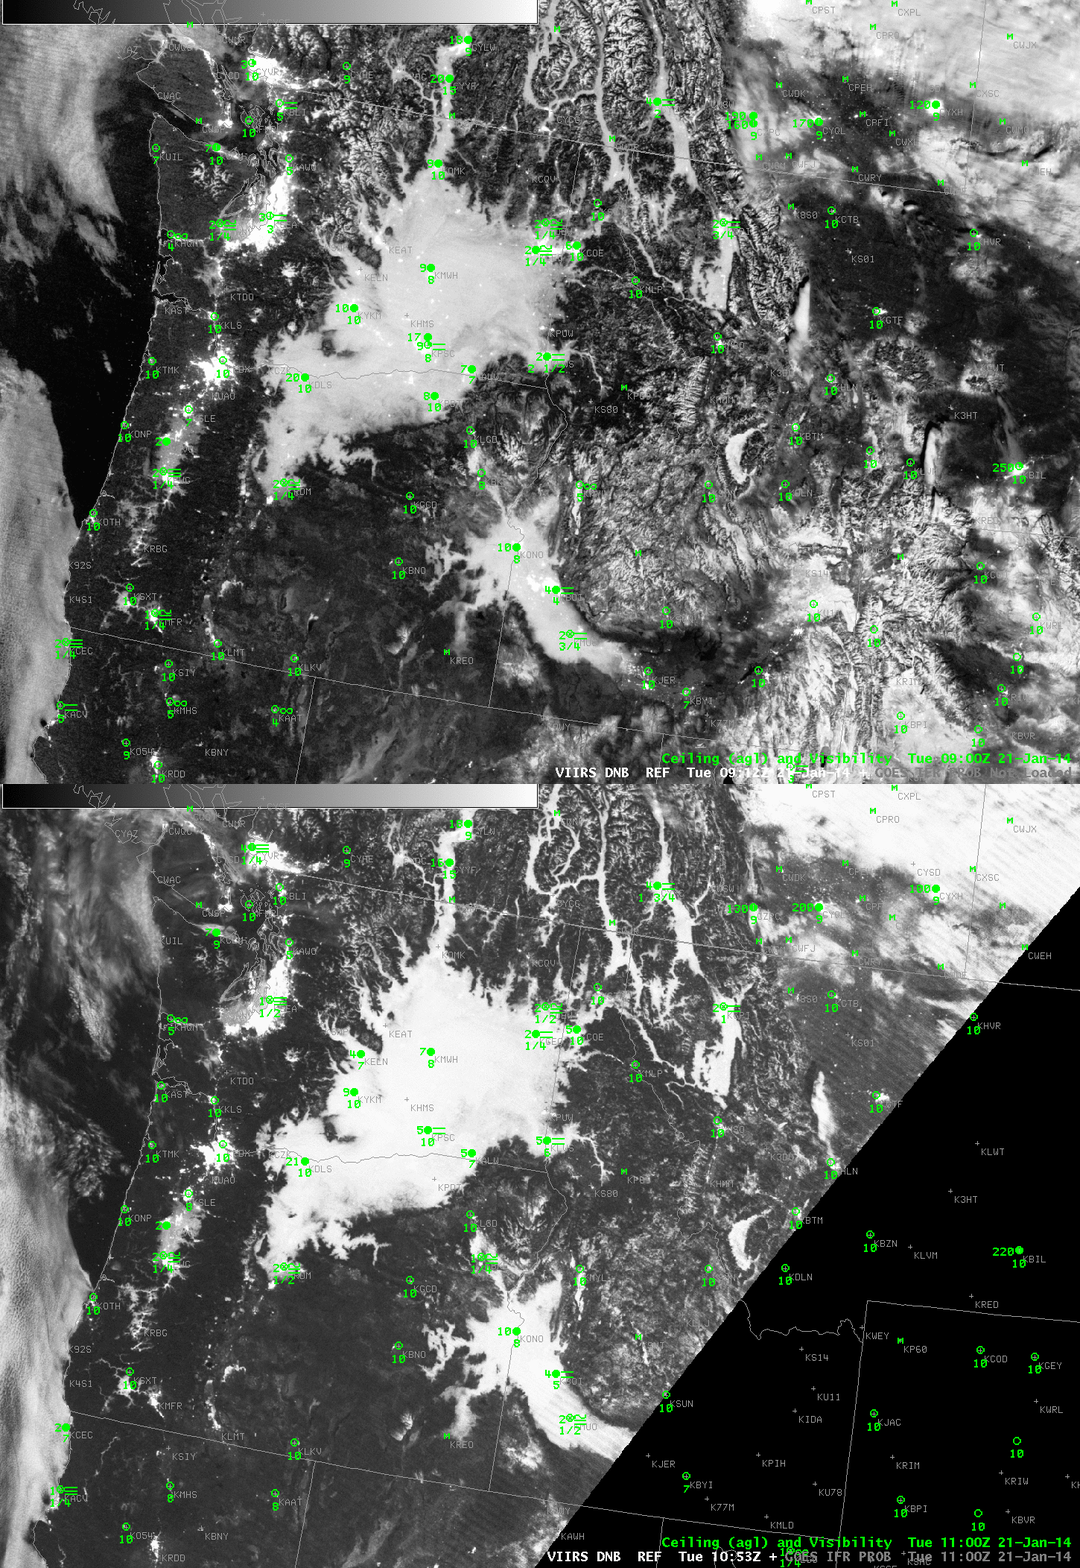
Suomi/NPP Day/Night band imagery over the Pacific Northwest, 0912 and 1053 UTC on 21 January 2014(click image to enlarge)
Suomi/NPP viewed eastern Oregon/Washington and western Idaho on two successive scans overnight. The 3/4 full moon provides ample illumination, and fog/low stratus is apparent in the imagery above. A view of the top of the clouds, however, gives little information about the cloud base, that is, whether or not important restrictions in visibility are occurring. For something like that, it is helpful to include surface-based data. Rapid Refresh data are fused with the model data to highlight regions where IFR conditions are most likely. The image below is a toggle of the 1053 UTC Day/Night band image and the 1100 UTC GOES-R IFR Probabilities (computed using GOES-West data). GOES-R IFR Probabilities are correctly highlighting regions where ceilings and visibilities are consistent with IFR conditions. Where the Day/Night band is possibly seeing elevated stratus (between The Dalles (KDLS) and Yakima (KYKM), for example), IFR Probabilities are lower.
GOES-based data cannot resolve very small-scale fog events in river valleys (over northeastern Washington State, for example). The superior spatial resolution of a polar-orbiting satellite like Suomi/NPP (or Terra/Aqua) can really help fine-tune understanding of the horizontal distribution of low clouds.
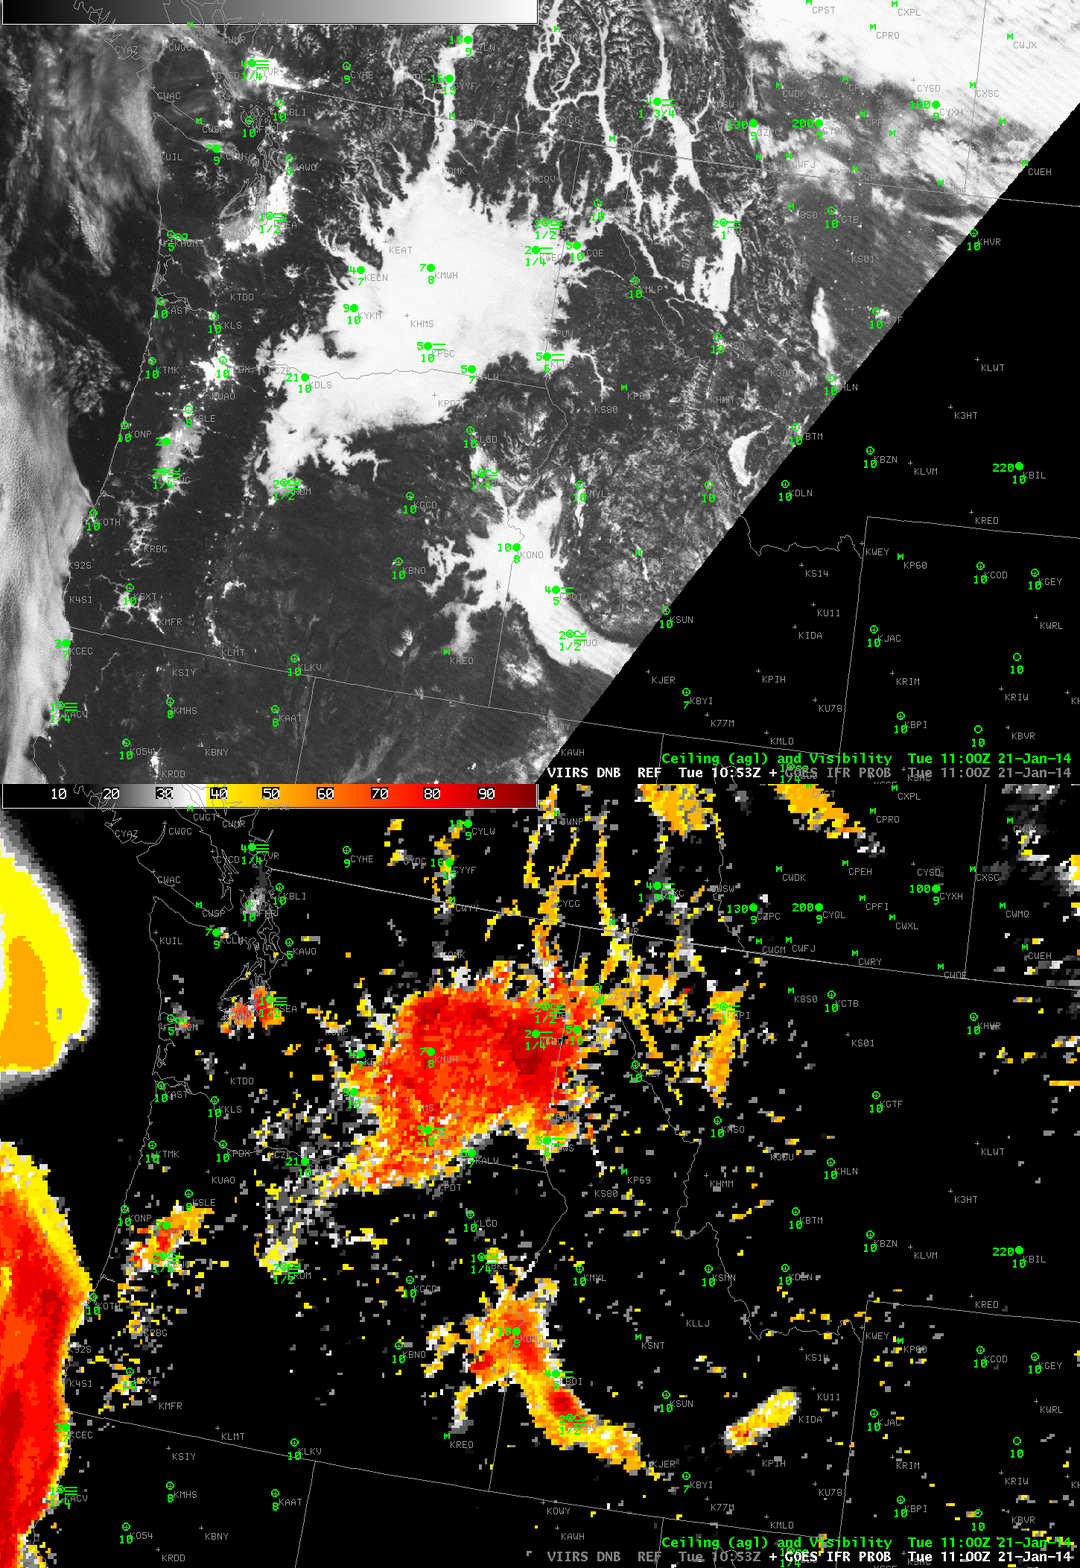
Suomi/NPP Day/Night band imagery and GOES-R IFR Probabilities, ~1100 UTC on 21 January 2014(click image to enlarge)
Added: 22 January 2014
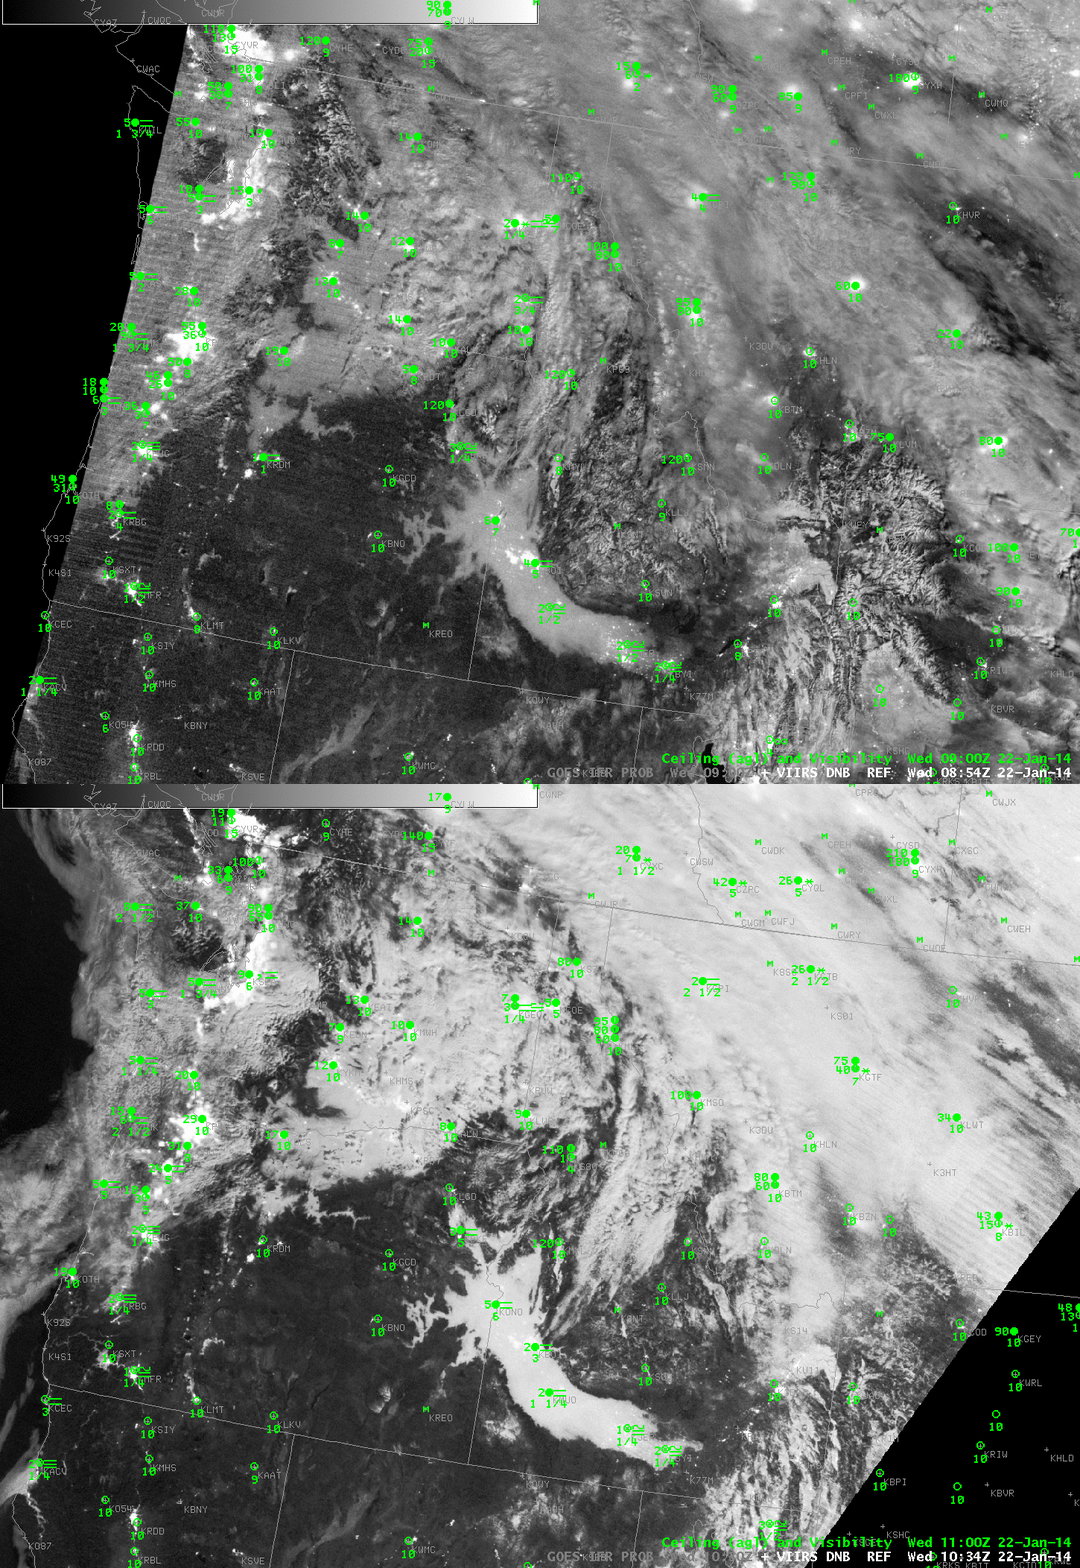
Suomi/NPP Day/Night band imagery over the Pacific Northwest, 0854 and 1034 UTC on 22 January 2014(click image to enlarge)
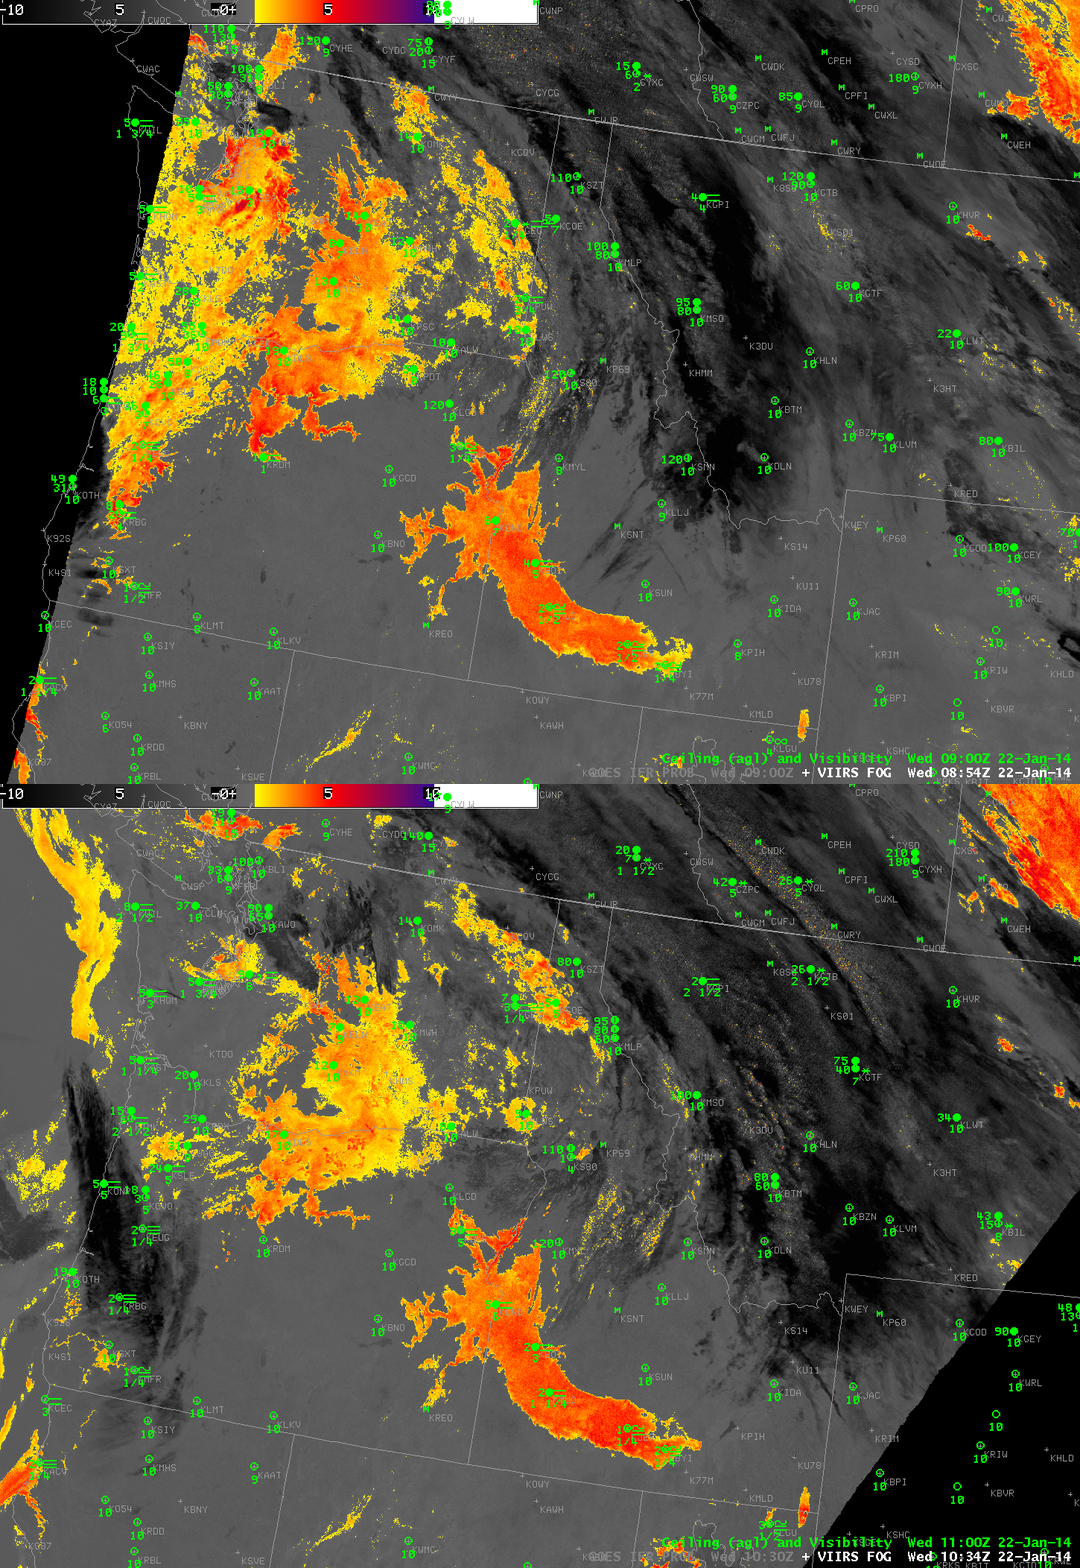
Suomi/NPP Brightness Temperature Difference from VIIRS, 11 µm – 3.74 µm imagery over the Pacific Northwest, 0854 and 1034 UTC on 22 January 2014(click image to enlarge)
The stagnant weather pattern under the west coast ridge allowed fog to persist overnight on January 22nd, and once again, the Day/Night band observed the fog-filled Snake River Valley of southern Idaho. The newly-rising moon at 0854 UTC provided less illumination than the higher moon at 1034 UTC, but both show fog/low stratus over the Snake River Valley of Idaho, and over parts of northern Oregon and central Washington. It is difficult to tell where the stratus is close enough to the ground to produce IFR conditions, however. The brightness temperature difference product from VIIRS, above, can distinguish between low clouds (orange enhancement) and higher clouds (dark grey) because of the different emissivity properties of water-based low clouds and ice-based higher clouds.
The toggle below shows how the higher-resolution VIIRS instrument can more accurately portray sharp edges to low clouds. Both instruments show the region of high clouds moving onshore in coastal Oregon (at the very very edge of the Suomi/NPP scan). These high clouds make satellite-detection of low clouds difficult because they mask detection of lower clouds.
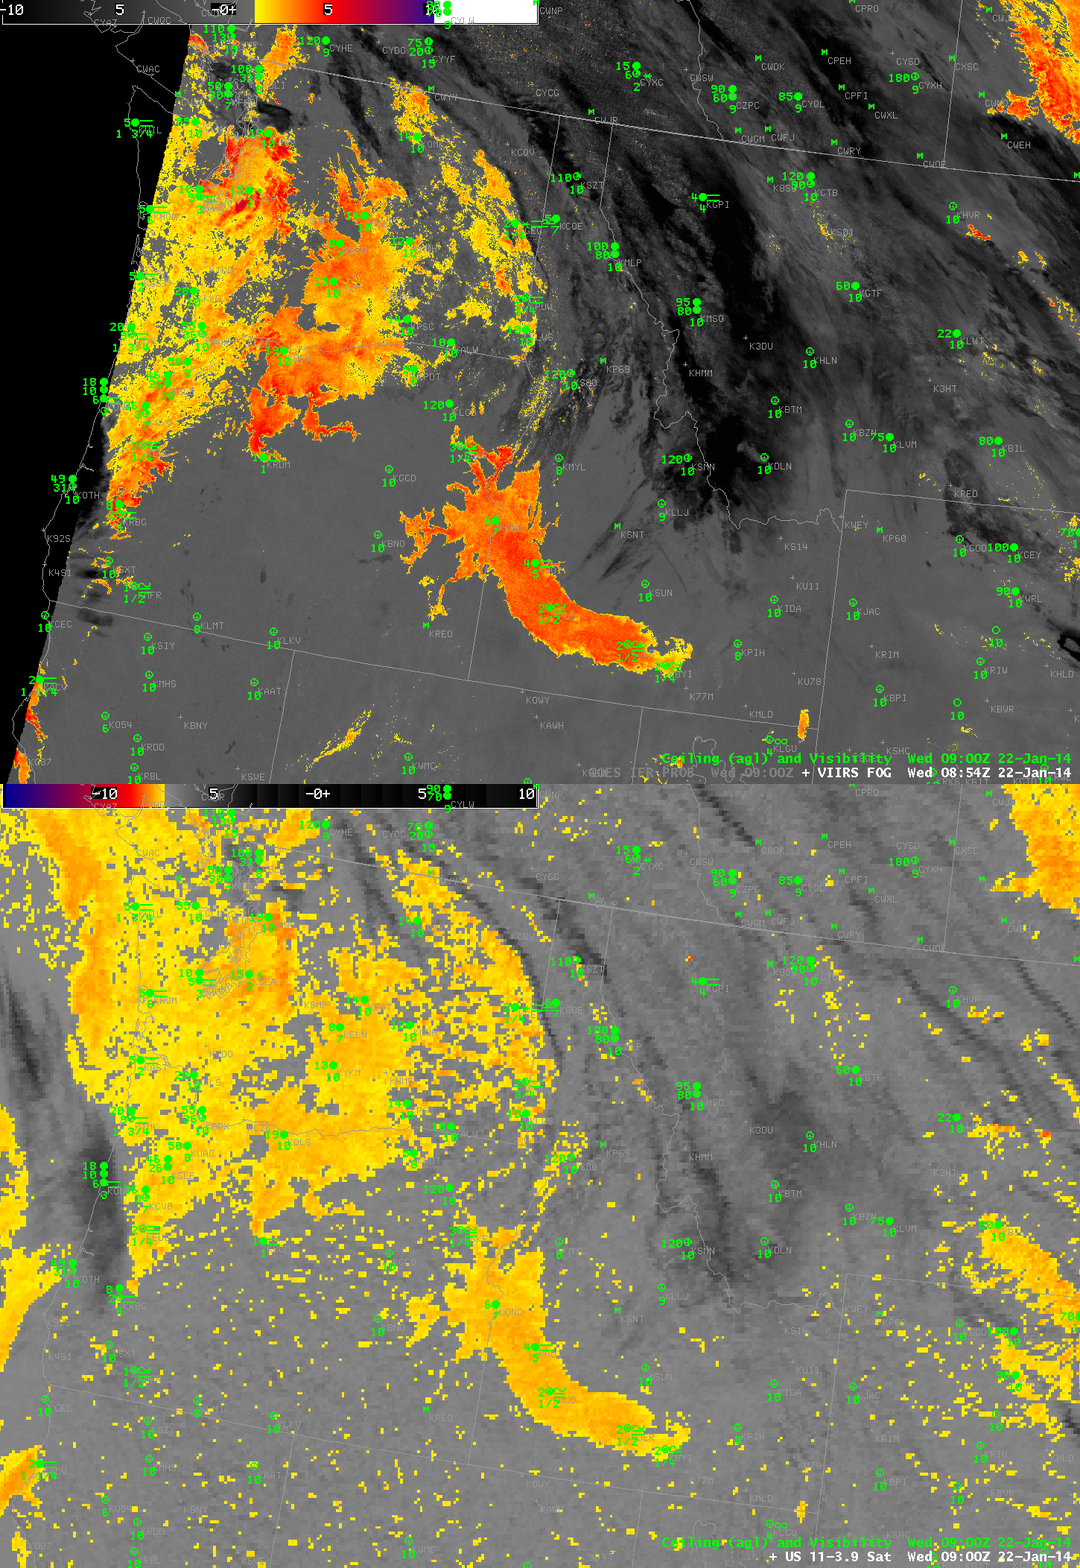
Suomi/NPP Brightness Temperature Difference from VIIRS (10.35 µm – 3.74 µm) and GOES-15 Imager Brightness Temperature Difference (10.7 µm – 3.9 µm imagery over the Pacific Northwest, ~0900 UTC on 22 January 2014(click image to enlarge)
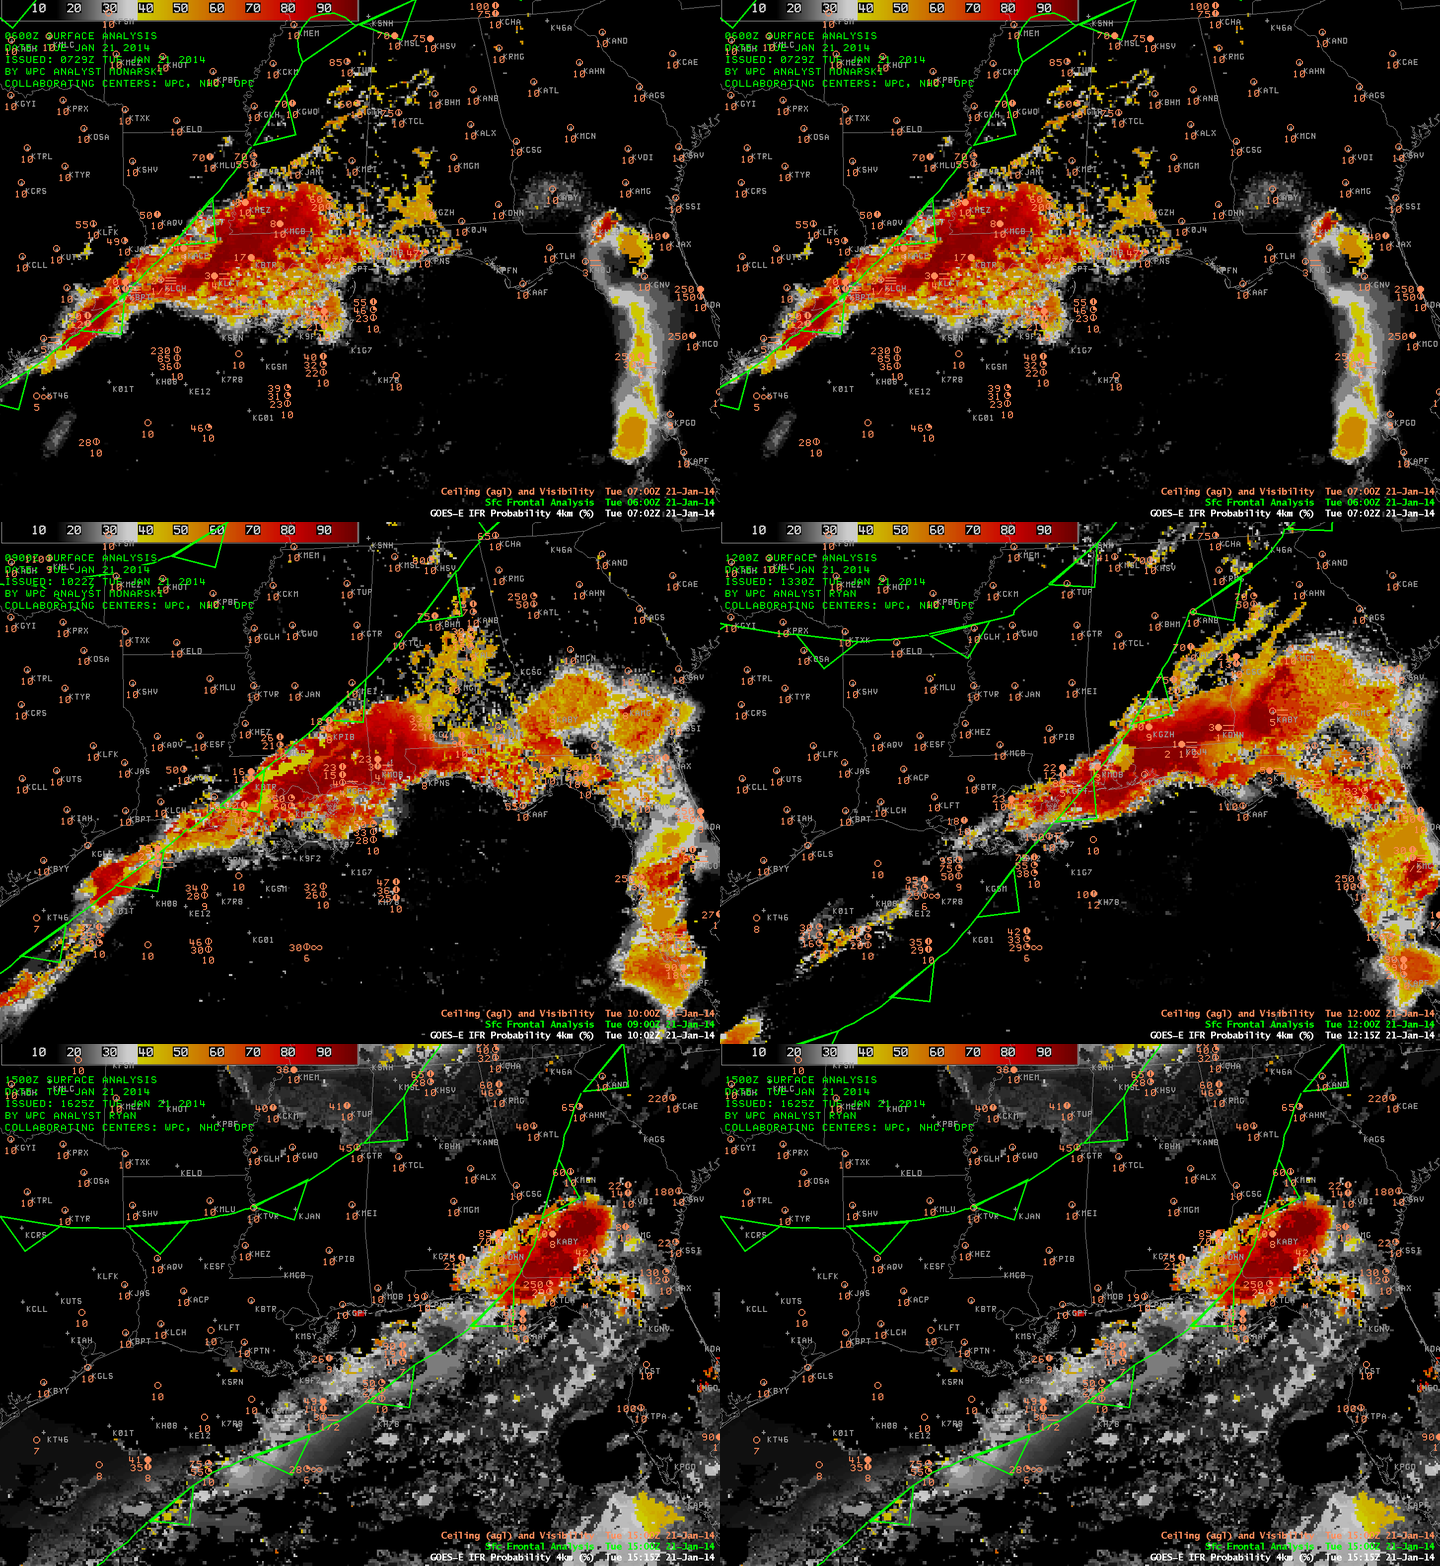
GOES-based IFR Probabilities show the probability of fog and low ceilings (IFR conditions) even where high clouds are present. In the toggle above, note the regions where the IFR Probability field is uniform (off the coast of Oregon, yellow, and over west-central Washington State, orange and yellow, both at 0900 UTC). These smooth fields are typical of IFR Probabilities that are determined primarily from Rapid Refresh data. Where those smooth fields exist, satellite data does not give a signal of low clouds — usually because of the presence of ice-based clouds at higher levels; therefore, model data are driving the IFR Probability signal, and model data are typically smoother than the more pixelated satellite field. There are places, however, where model data alone does not accurately portray IFR conditions (at KGPI, for example (Glacier Park), where high clouds are present).
IFR Probability algorithms have not yet been extended using data from Suomi/NPP, in large part because the VIIRS instrument does not detect radiation in the so-called water-vapor channel (around 6.7 µm). The MODIS detector on board Terra and Aqua does have a water vapor channel, and IFR Probabilities are routinely produced from MODIS data, as shown below. MODIS, like VIIRS, has a 1-km pixel footprint that excels at detecting very fine small-scale features in clouds, especially small valleys, that are smeared out in the GOES imagery. The toggle below is of MODIS Brightness Temperature Difference, MODIS-based IFR Probabilities, GOES Brightness Temperature Difference, and GOES-based IFR Probabilities, all at ~1015 UTC on 22 January. Two things to note: MODIS has cleaner edges to fields, related to the high spatial resolution. The GOES-based brightness temperature difference highlights many more pixels over central Oregon where fog is not present. These positive hits bleed into the GOES-based IFR Probabilities, and they occur because of emissivity differences in very dry soils (See for example, this post). As drought conditions persist and intensify on the west coast under the longwave ridge, expect this signal to persist. The signals are not apparent in MODIS or VIIRS brightness temperature differences because of the narrower spectrum of those observations.
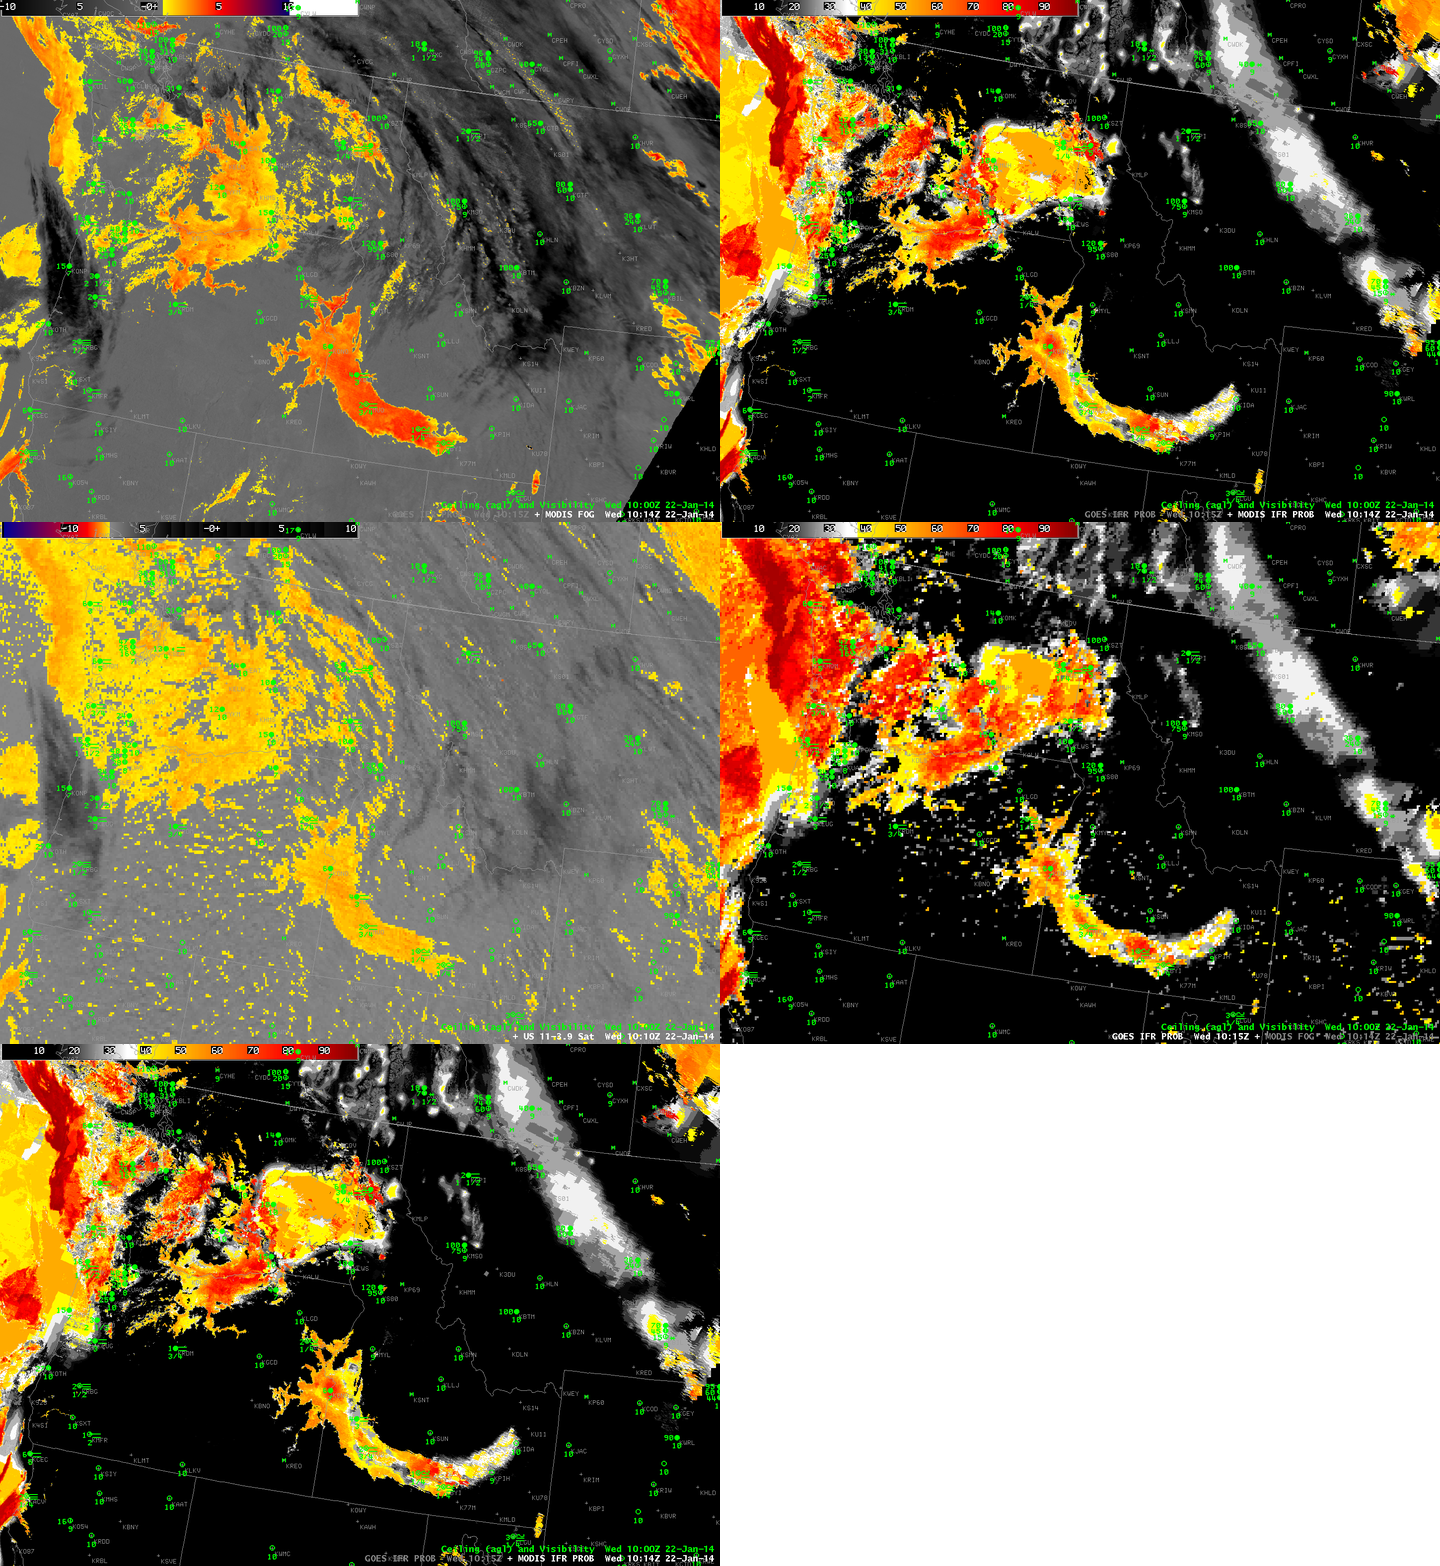
MODIS Brightness Temperature Difference (11 µm – 3.74 µm), MODIS-based GOES-R IFR Probabilities, GOES-15 Imager Brightness Temperature Difference (10.7 µm – 3.9 µm), GOES-based GOES-R IFR Probabilities and MODIS-based IFR Probabilities (again), all near 1015 UTC 22 January 2014(click image to enlarge)
Added, 23 January:
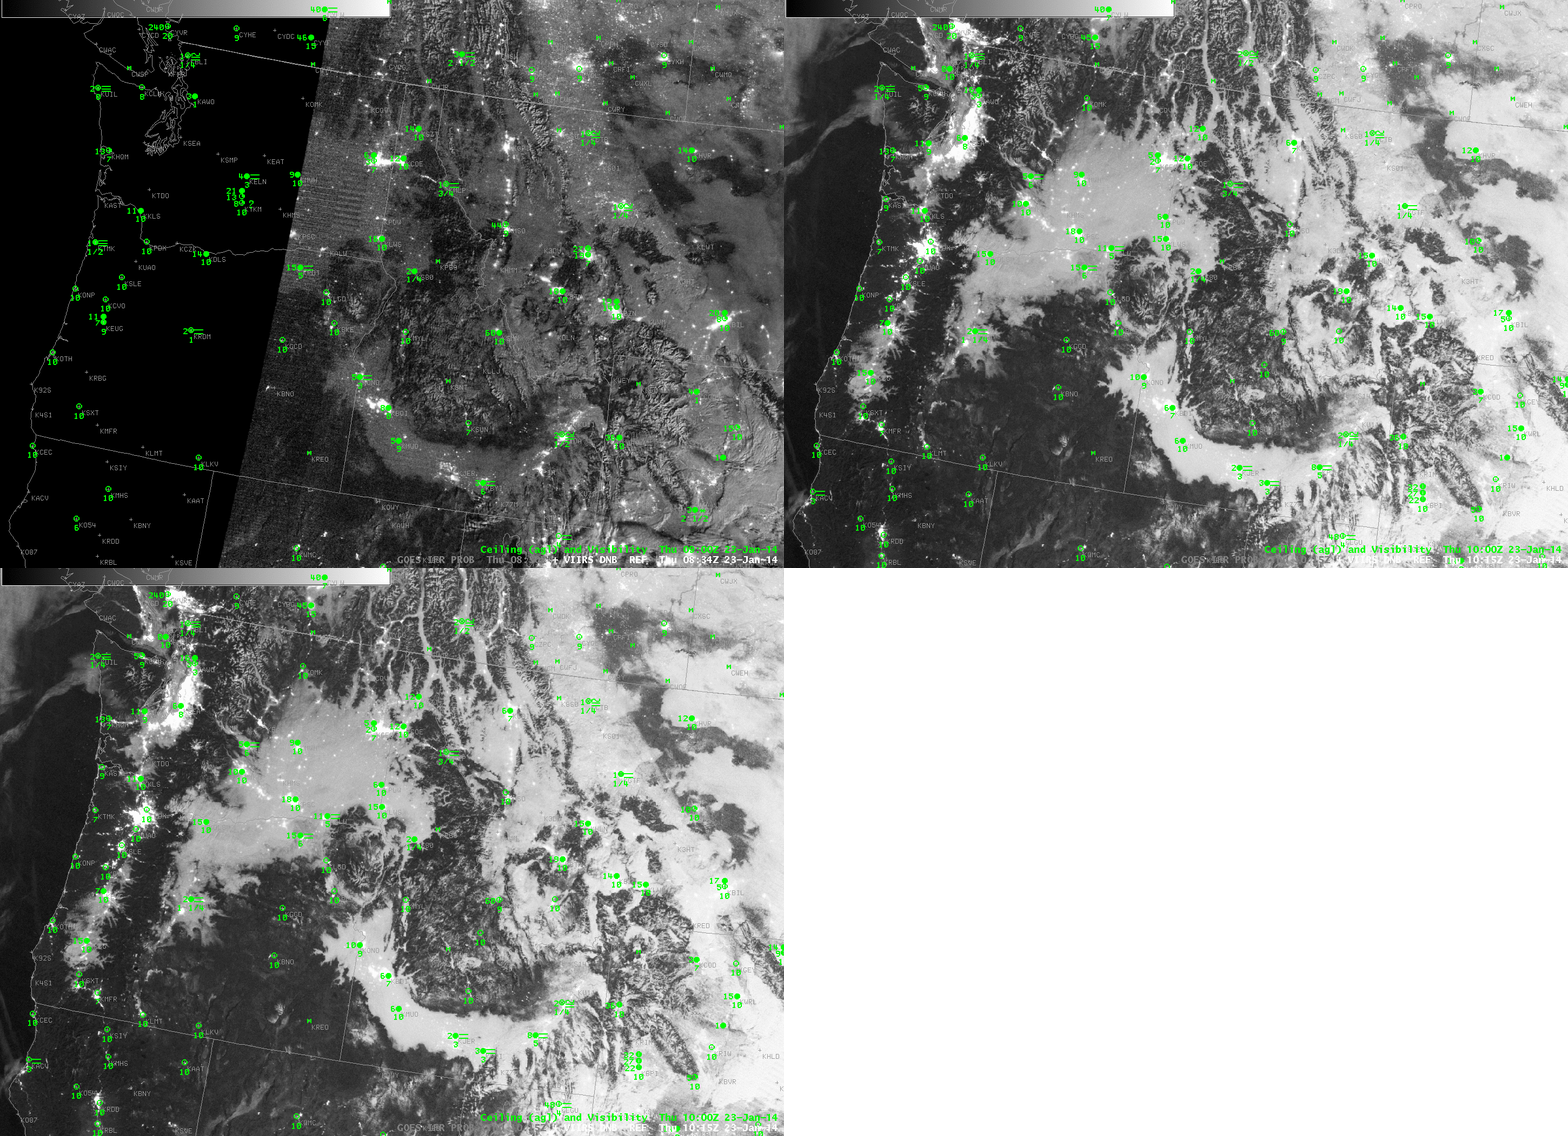
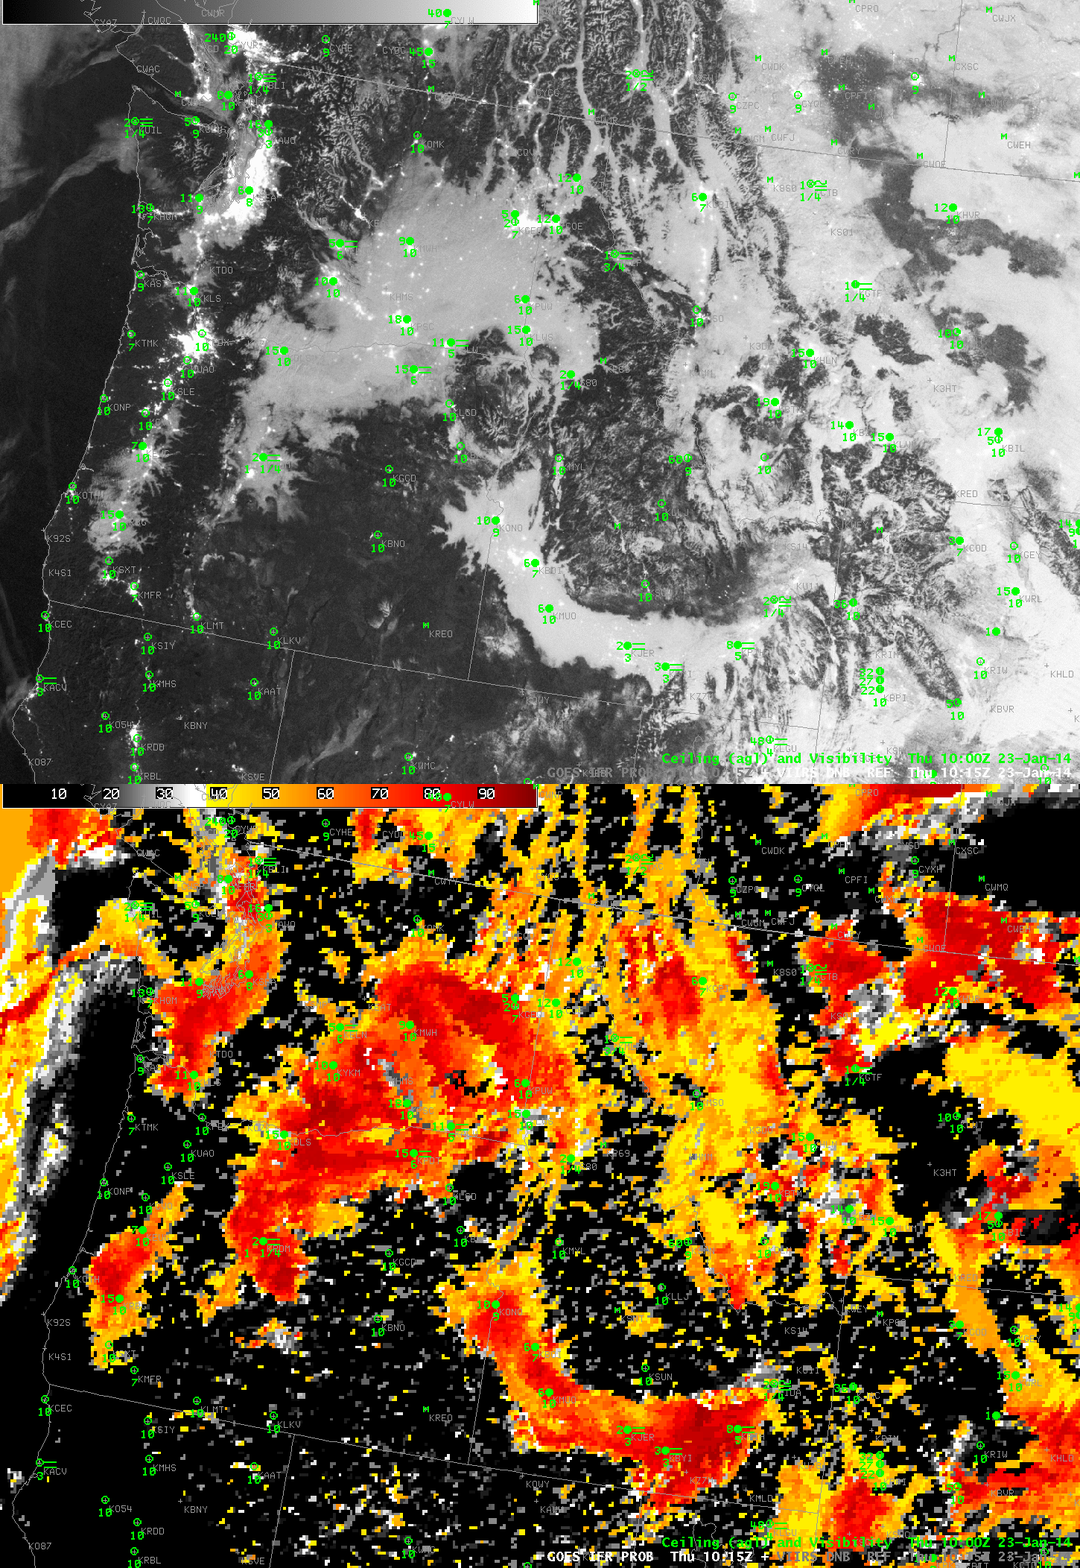
Fog persists in the Snake River Valley and elsewhere. It has also become more widespread over the high plains of Montana. Note the difference in the Day/Night band imagery below. At 0834 UTC, the rising quarter moon is unable to provide a lot of illumination; by 1015 UTC, however, the moon is illuminating the large areas of fog. Because the moon is waning, however, Day/Night band imagery will become less useful in the next week. A toggle between the 1015 UTC Day/Night band and the GOES-R IFR Probabilities computed using GOES-West (below the Day/Night band imagery) continues to demonstrate how well the field outlines the region of IFR conditions.

