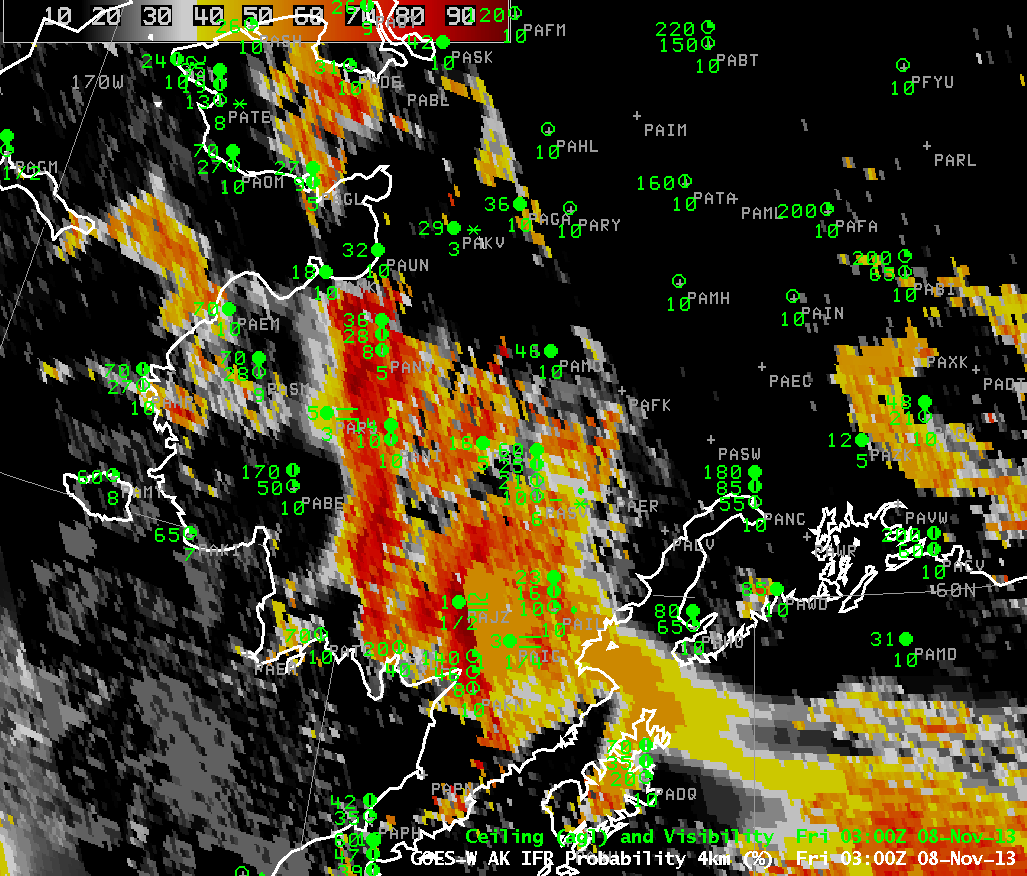
GOES-15-based GOES-R IFR Probabilities every half hour from 0300 UTC through 1530 UTC (click image to animate)
Fog and low stratus were present over southwestern Alaska early on November 8. How did the GOES-R IFR Probability fields perform compared to the heritage brightness temperature difference (in this case, 10.7 µm – 3.9 µm from GOES-15). Consider the airport PARS (southwest of Anvik — PANV and northwest of Aniak — PANI). IFR conditions are present there until 0900 UTC, when ceilings rise and IFR probabilities drop. Subsequently, IFR Probabilities increase again as a north-south oriented region of higher IFR probabilities moves over, and IFR conditions are again present by 1600 UTC. Further south, PAJZ and PAIG report IFR conditions when IFR Probabilities are high, and conditions improve as IFR Probabilities decrease. IFR Probabilities initially around PAIG have the characteristic flat field (and somewhat lower probability) associated with a region where high-level clouds are present. In these regions, only Rapid Refresh data can be used to compute the probability; because satellite predictors are not used, the computed IFR probabilities are lower.
Compare the IFR Probability field, above, to the Brightness Temperature Difference field, below, that has been color-enhanced to highlight regions where water-based clouds may be present. The IFR Probability field correctly reduces the regions where IFR conditions might be occurring. That is, the traditional brightness temperature difference field is plagued by many false positives. This is because mid-level stratus that is unimportant for transportation looks to a satellite to be very similar to low-level stratus that is important for transportation.
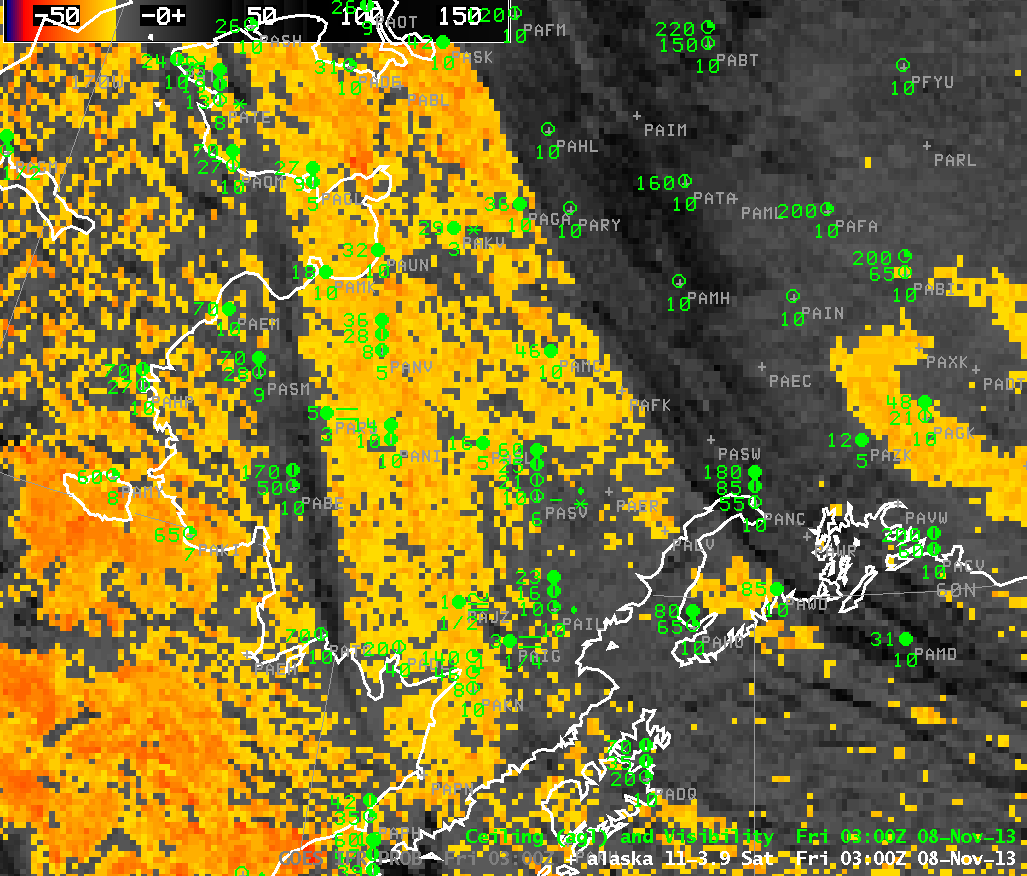
GOES-15 Brightness Temperature Difference (10.7 µm – 3.9 µm) every hour from 0300 UTC through 1500 UTC (click image to animate)
MODIS data from the polar-orbiting satellites Terra and Aqua can also be used to compute IFR Probabilities, and MODIS data — although less frequent than the data from the geostationary GOES-15 — has far superior horizontal resolution (nominal MODIS resolution is 1 km at nadir) to GOES data (nominally 4 km at the sub-satellite point over the Equator) over Alaska. Small-scale features are much more likely to be detected in MODIS data, as shown below.
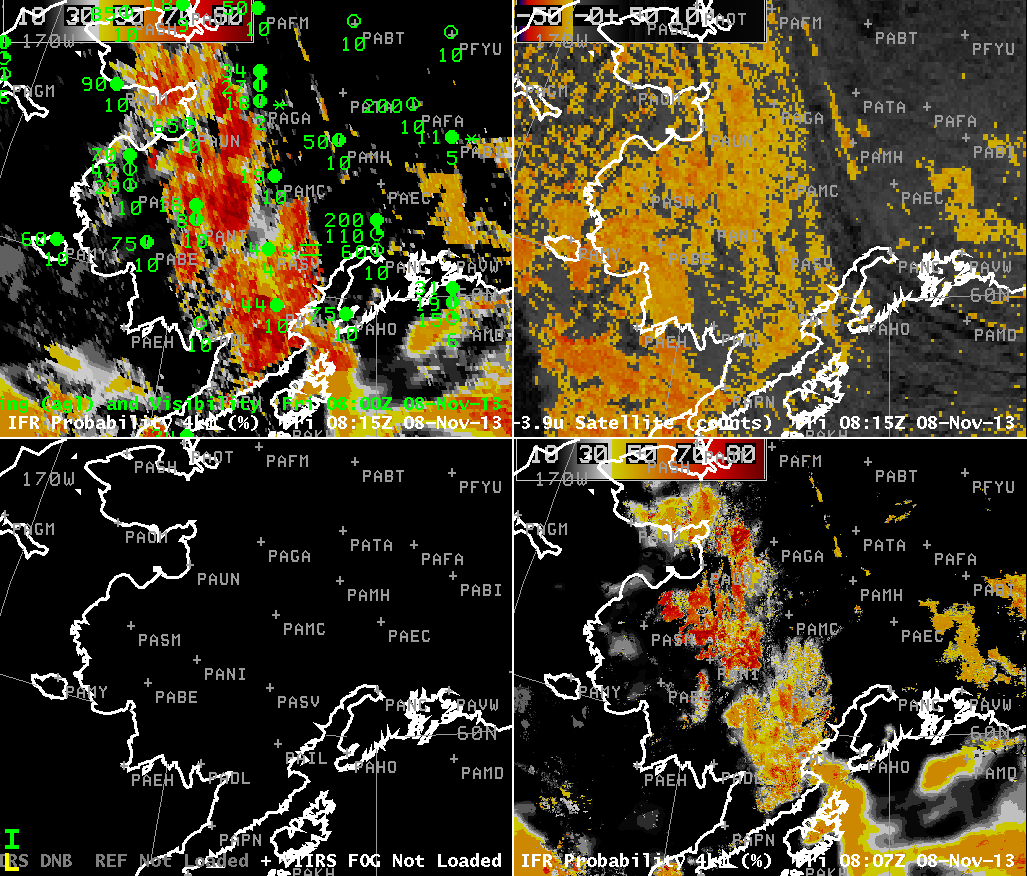
GOES-15-based GOES-R IFR Probabilities (Upper Left), GOES-15 Brightness Temperature Difference Product (10.7 µm – 3.9 µm) (Upper Right), Suomi-NPP Brightness Temperature Difference (11.45 µm – 3.74 µm) and Day/Night band (Lower Left), MODIS-based GOES-R IFR Probabilities (Lower Right), all times as indicated (click image to enlarge)
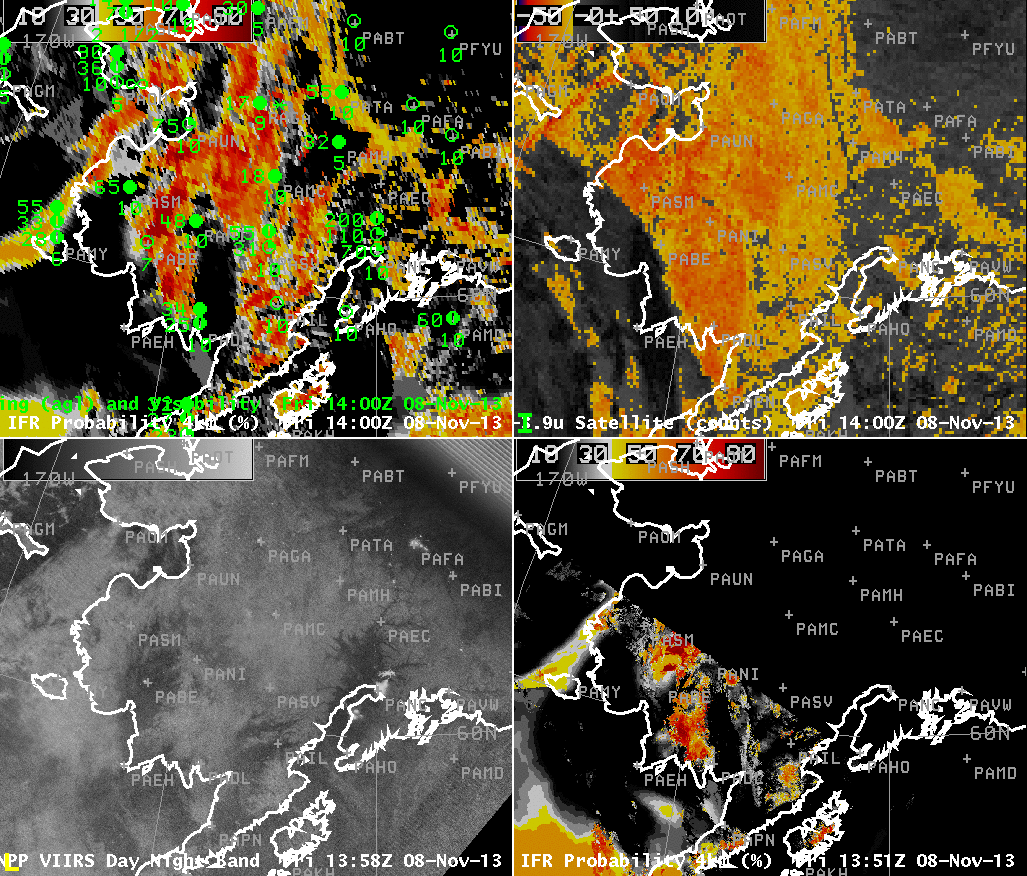
GOES-15-based GOES-R IFR Probabilities (Upper Left), GOES-15 Brightness Temperature Difference Product (10.7 µm – 3.9 µm) (Upper Right), Suomi-NPP Brightness Temperature Difference (11.45 µm – 3.74 µm) and Day/Night band (Lower Left), MODIS-based GOES-R IFR Probabilities (Lower Right), all times as indicated (click image to enlarge)
The Day/Night band from Suomi/NPP can sometimes be used to detect cloud features. However, when the Moon is not present to provide illumination, cloud detection is a challenge. In the toggle above between the Day/Night band and the brightness temperature difference from VIIRS (11.45 – 3.74), for example, there is little evidence of the apparent cloud edge that is visible both in VIIRS data, in GOES-15 data (Upper right) and in the IFR Probability fields from GOES (Upper Left) and MODIS (Lower Right).