 |
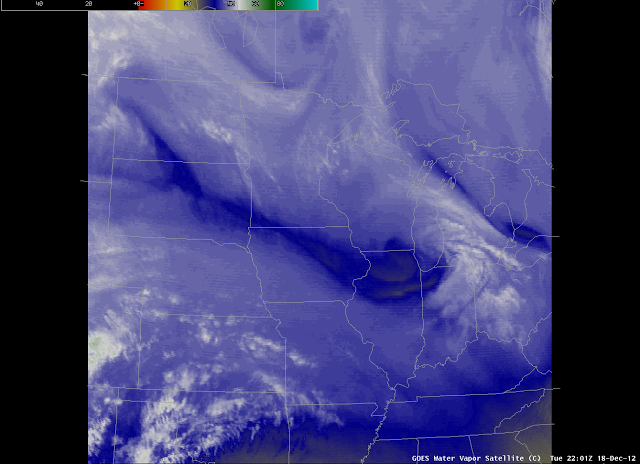
| GOES-East Water Vapor Imagery (6.7 ) from 2202 UTC on 18 December 2012 |
A weak weather system moved through the upper Midwest on December 18th, laying down a light strip of snow over Iowa and southern Wisconsin. The Water Vapor imagery, above, shows the small scale vorticity center that helped to force the precipitation band moving over southern Lake Michigan after most of the snow in Wisconsin had tapered off.
The storm left behind abundant low-level moisture, and Fog/Low Stratus that caused IFR conditions were common. The animation of the GOES-R IFR Probability product, below, shows high probabilities in the region where light snow and drizzle persisted. Several aspects of this image require comment.
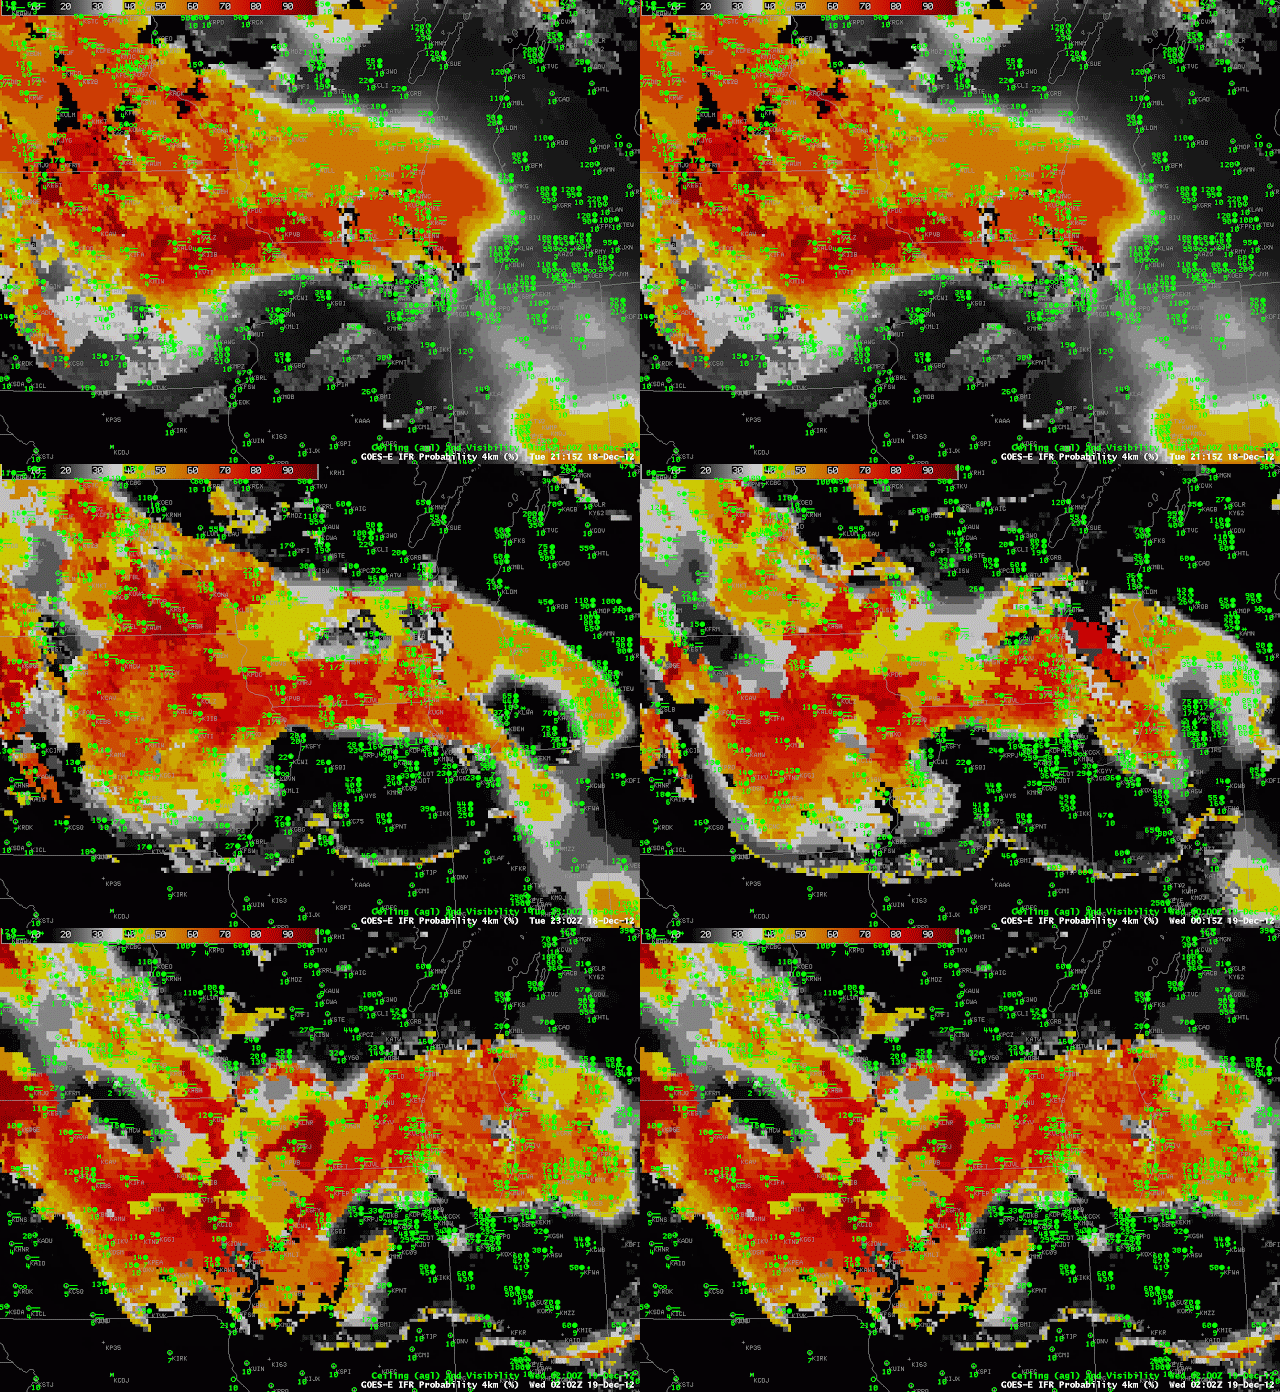 |
| GOES-R IFR probabiltiies computed from GOES-East, and surface observations of ceilings and visibility, hourly from 2100 UTC 18 December to 0200 UTC 19 December. |
The image at 2200 UTC shows the boundary between day-time predictor use and night-time predictor use. This boundary runs southeast to northwest over Iowa. IFR probabilities are somewhat lower where the night-time predictors are used initially, but patches of higher IFR probability do occur. The IFR Probability product does distinguish well between the fog and low stratus that does restrict visibility and the elevated stratus over Illinois that is obvious in the traditional brightness temperature difference product, below. Note especially how Chicago’s O’Hare airport is not reporting IFR conditions, nor under a region where GOES-R IFR probabilities are high, but it is in a region where the traditional brightness temperature product has a strong signal.
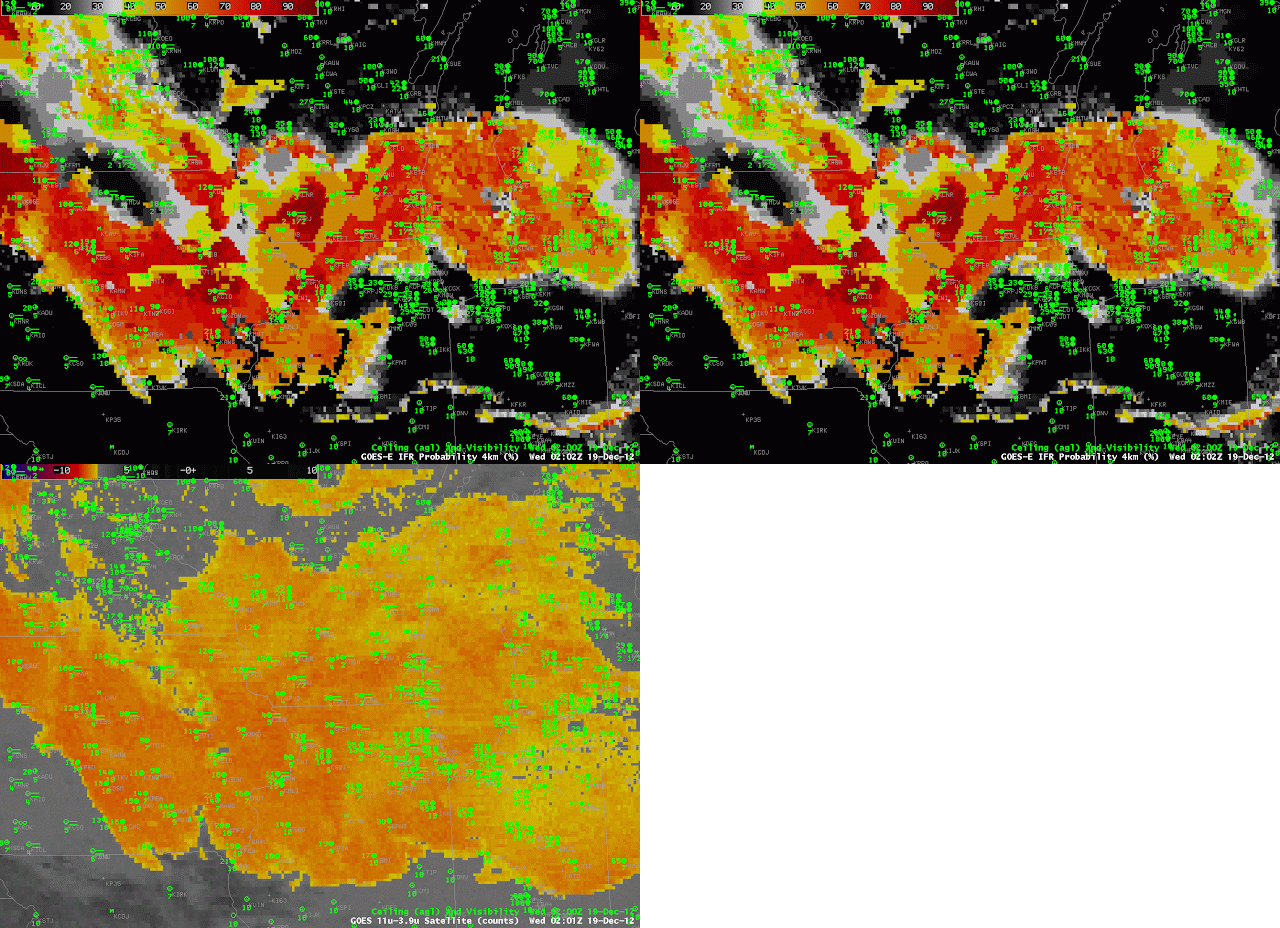 |
| Toggle between GOES-R IFR Probability field and GOES-East Brightness Temperature Difference Field, 0200 UTC 19 December 2012 |
