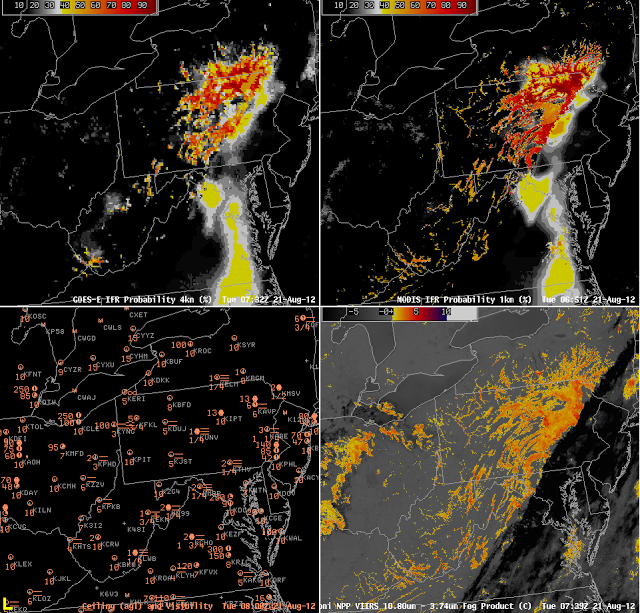
Three different satellite sensors — the GOES Imager on GOES-East, MODIS on Aqua, and VIIRS on Suomi/NPP — viewed data from the occurrence of Valley Fog over the Appalachians (and surroundings) early in the morning of 21 August. A shortcoming of the Brightness Temperature Difference field in the lower left is immediately apparent: no fog/low stratus is indicated where high clouds exist, even though observations do show IFR conditions. In contrast, the fused product does show heightened probabilities underneath that high cloud deck. Probabilities are not as high as they are where both satellite and model predictors can be used to evaluate the presence of fog and low stratus, and the resolution of the field is different, obviously limited to the horizontal resolution of the Rapid Refresh, meaning that small river valleys, that are very obvious in the regions where satellite data are used (and even much more obvious when high-resolution MODIS or VIIRS data are used). Note also how GOES-R IFR Probabilities de-emphasize the signal over western Ohio, where IFR conditions are not reported. Brightness temperature difference fields from MODIS and from GOES both see a signal there, as also shown in the VIIRS field, but these stratus clouds are not obstructing visibility.
Bottom line: MODIS data’s higher resolution observes the big differences between river valleys and adjacent cloud-free ridge tops. GOES-East has difficulty in resolving those differences. So MODIS IFR fields better highlight river fog. Model data can help discern between fog on the ground, and stratus that is off the ground.

