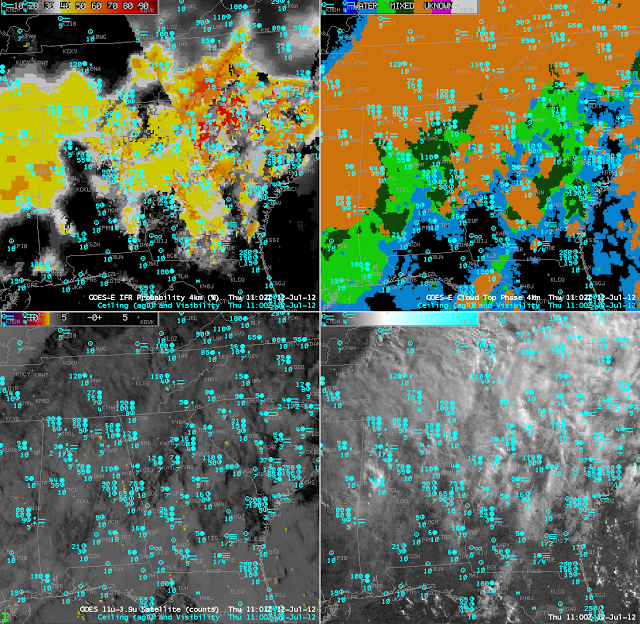
Several things require explanation in these images. In the IFR probability mapping, the SSE to NNW boundary extending from near Jacksonville to Chattanooga is the terminator, the boundary between using nigthtime and daytime values in the look-up tables that are used to relate model and satellite fields to IFR probabilities. Note that the daytime values generally yield higher probabilities than the nighttime values, especially for regions where IFR probabilities are determined mostly from model output. Regions where that occurs — where model output drives the IFR probability output — are typically underneath widespread ice clouds, and the probability fields have a more uniform look to them. In the image above, more satellite data are being used over South Carolina, and the resultant IFR probability field has a more pixelated character. Note, however, how little information about fog and low stratus is present in the traditional brightness temperature difference field in the lower left. IFR flight rules are common from south central Georgia northeastward into South Carolina and over northern Mississippi.
Fog and Low Stratus where it rains
Leave a reply
Fog and low stratus is not rare in regions of precipitation, but the brightness temperature difference algorithm used historically to infer fog will not highlight such areas as those where IFR conditions are likely, usually because the emissivity properties of the precipitating clouds differ from those of fog/stratus decks. The GOES-R Fog/Low Stratus product nevertheless will produce a signal in these regions because it uses input from numerical models in regions where a satellite signal cannot provide information.

