Monthly Archives: May 2013

FLS Advecting Northwest Towards the Eastern Aleutians

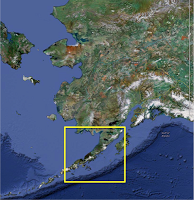
Area of focus in the Eastern Aleutians in Southern Alaska

Due to the location of Alaska, geostationary satellite data can sometimes be difficult to work with. This is because the large satellite angle causes the satellite footprint to increase, thus decreasing the spatial resolution of the data. However, even though the spatial resolution is not ideal the temporal resolution allows geostationary satellite data to remain useful. The example below shows and area of fog/low stratus (FLS) moving northwestward toward the eastern Aleutians in southern Alaska.

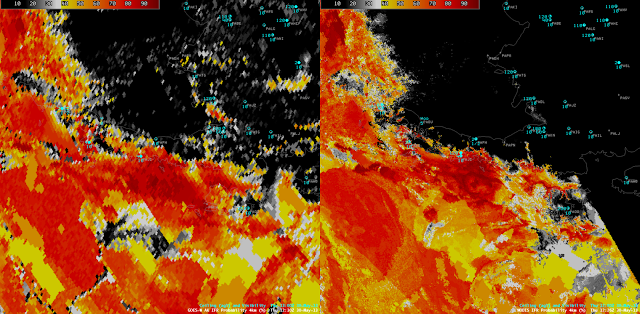
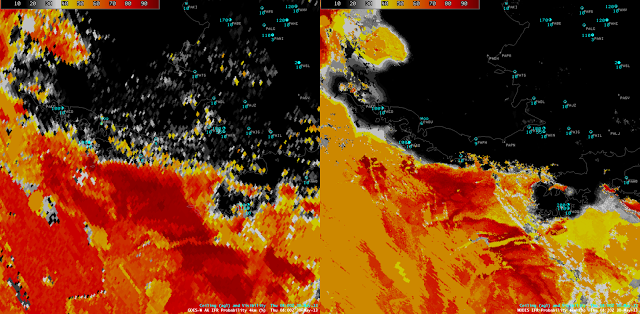
GOES-R IFR probabilities computed using GOES-15 (left) and MODIS (right) around 08:20Z on May 30, 2013. Note that the images are rotated so true north is actually oriented from the lower left corner of the images to the upper right corner.

In the image above the orange and darker red colors indicate areas with a high probability of FLS over the northern Gulf of Alaska. The difference in spatial resolution stands out when comparing the images, however, it should be noted that the same areas of higher probabilities in the MODIS image are also picked up in the GOES image, just at a coarser resolution. Although the MODIS image looks more detailed than GOES, temporal trends can not be discerned from a single image. The next available MODIS pass over the area was at 12:26Z.

GOES-R IFR probabilities computed using GOES-15 (left) and MODIS (right) around 12:26Z on May 30, 2013. Note that the images are rotated so true north is actually oriented from the lower left corner of the images to the upper right corner. 

In the 12:26Z image the FLS deck moved northwest over the eastern Aleutians as indicated by the higher probabilities that are now over the southeastern side of the Aleutians. This is confirmed by the surface station in Chignik, AK, which reported a ceiling of 400 ft at 12:00Z when it reported no ceiling at 08:00Z. Once both MODIS passes were available the NW movement of the FLS could be observed. However, in the 4 hours between the two MODIS passes it would be hard to forecast whether the IFR conditions would move into the area or stay out at sea.

On the other hand, GOES data was available about every 15 minutes. By animating the GOES images such as this, the slow NW movement of the FLS can be tracked and a better approximation of when IFR conditions will reach the Aleutians can be made. IFR conditions were first reported at Chignik, AK at 09:00Z, just as the higher GOES-R IFR probabilities reached the coastline. Also from the animation, it appears that the eastern Aleutians block the movement of the FLS deck from continuing over to the NW side into the Bering Sea. This blocking might be difficult to interpret from the two MODIS images alone.

Alaska has the largest coastline in the U.S. (more than twice the size of the entire lower 48, including Hawaii) where hazardous areas of FLS can move onshore. Although the high spatial resolution available from MODIS provides more detail in a single scene than GOES, the high temporal resolution that GOES offers makes finding trends in the movement of hazardous low clouds possible. This is another example of how looking at the GOES-R FLS products using GOES and MODIS together can be more useful than using only GOES or MODIS.

Co-registration errors on GOES-14

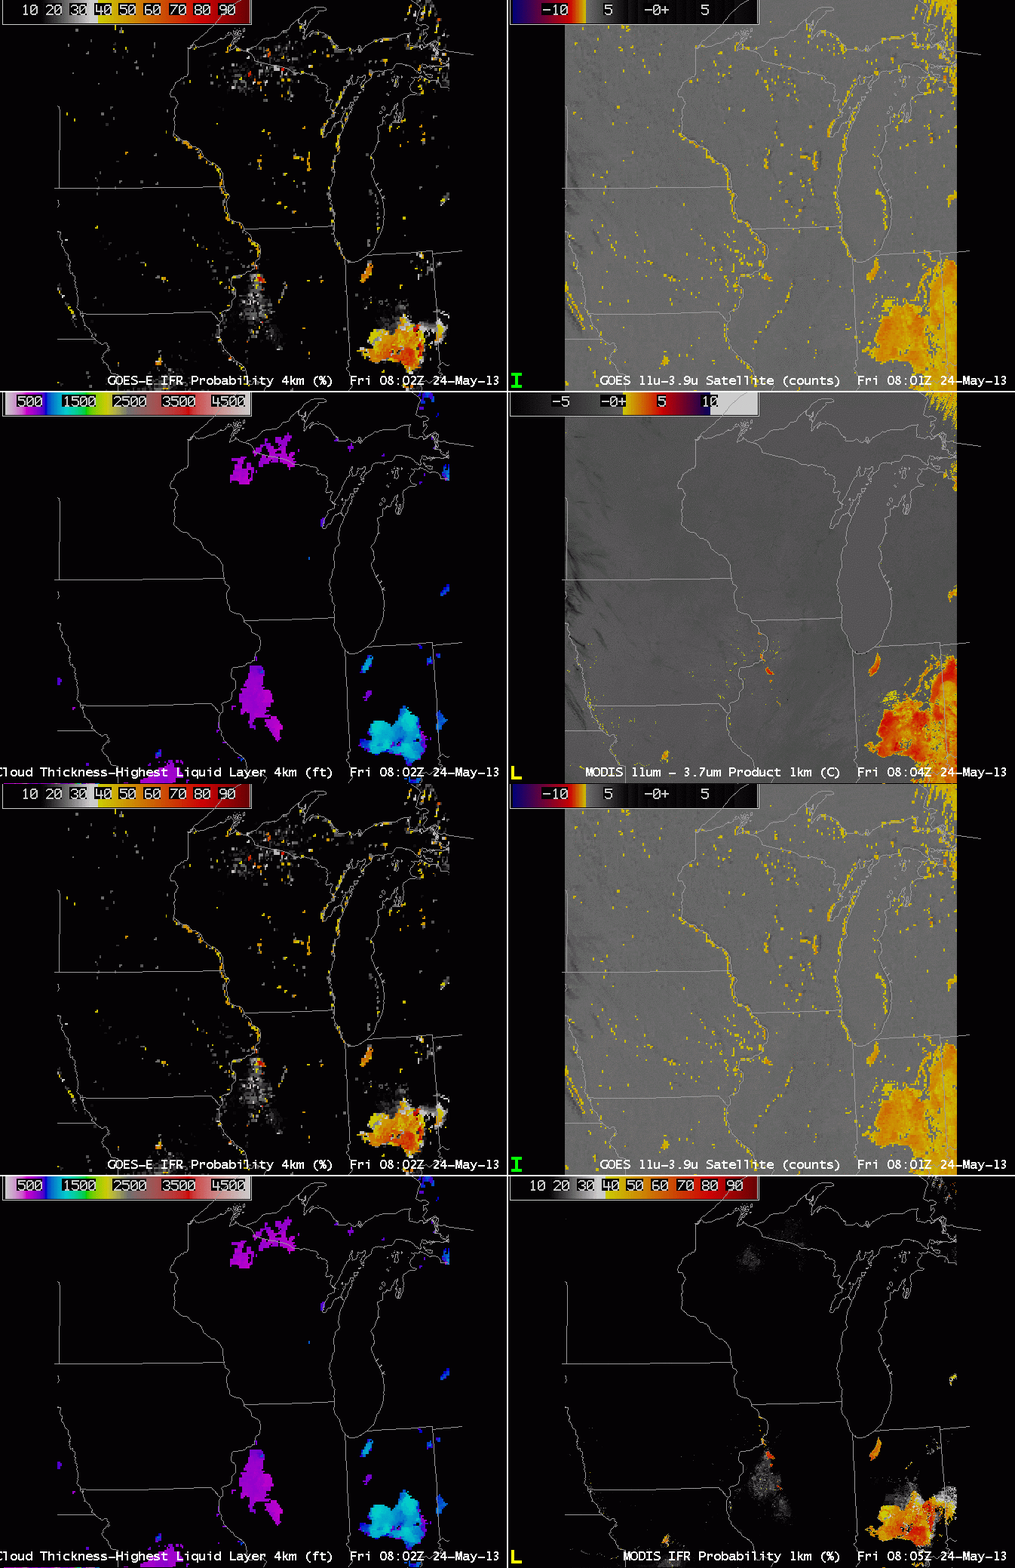
GOES-R IFR Probabilities computed from GOES-14 (Upper Left), GOES-14 Brightness Temperature Difference (10.7 µm – 3.9 µm) (Upper Right), GOES-R Cloud Thickness (Lower Left), Toggle between MODIS brightness temperature difference (11 µm – 3.7 µm) and GOES-R IFR Probabilities computed from MODIS (Lower Right)

GOES-13 has a co-registration error between the 10.7 and 3.9 µm channel.  That is, the two different channels do not view the same identical pixel.  There is expected to be some variance (at the sub-pixel scale), but the differences exceed system specifications.  This error is also present in GOES-14, as shown above.  The brightness temperature difference product from GOES-14 (upper right) erroneously depicts the presence of Fog/Low Stratus along the western shores of Lakes Michigan and Winnebago and others, and along the various river valleys.  A MODIS image at the same time does not indicate low clouds at all.  The GOES imagery suggests clouds because of the coregistration error:  one channel sees the water and one sees the land, so the difference is actually a land-sea temperature difference rather than one due to emissivity differences between the two wavelengths for water clouds.

The error in GOES propagates into the GOES-R IFR probability fields as a thread of higher probability paralleling the water.  Cloud Thickness fields do not show the signal, however.

This example shows the benefit of using two different satellites to view the same scene.  An misalignment in one typically is not present in the second.

GOES-R IFR Probabilities with the new GOES-East (GOES-14)

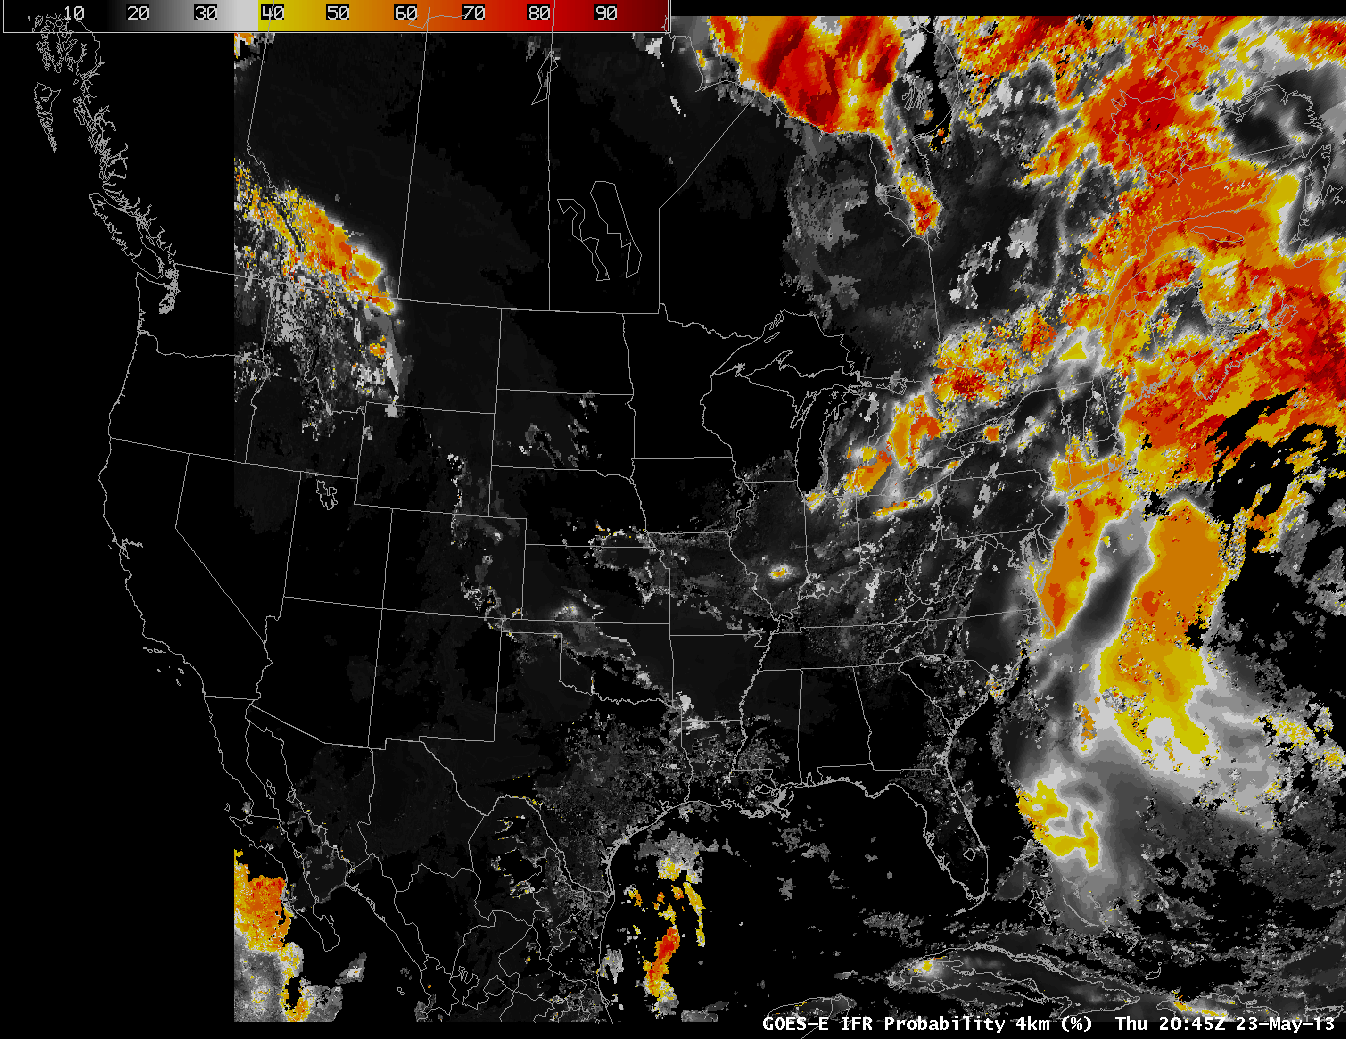
GOES-R IFR Probabilities computed using GOES-14, 2045 UTC 23 May 2013

GOES-R IFR Probabilities computed using the ‘new’ GOES-East, GOES-14, are now available in AWIPS.  Note that GOES-14 is positioned over 105.5 W, versus 75 W for GOES-13.  The most likely region for fog, over the shelf waters of the Atlantic Ocean off the mid-Atlantic Coast and in the Gulf of Maine, corresponds to regions where air with dewpoints in the 60s is moving over still-cold ocean waters.  Advection fog results. 

As above, but with visibilities/ceilings over New York and surroundings.

GOES-13 outage

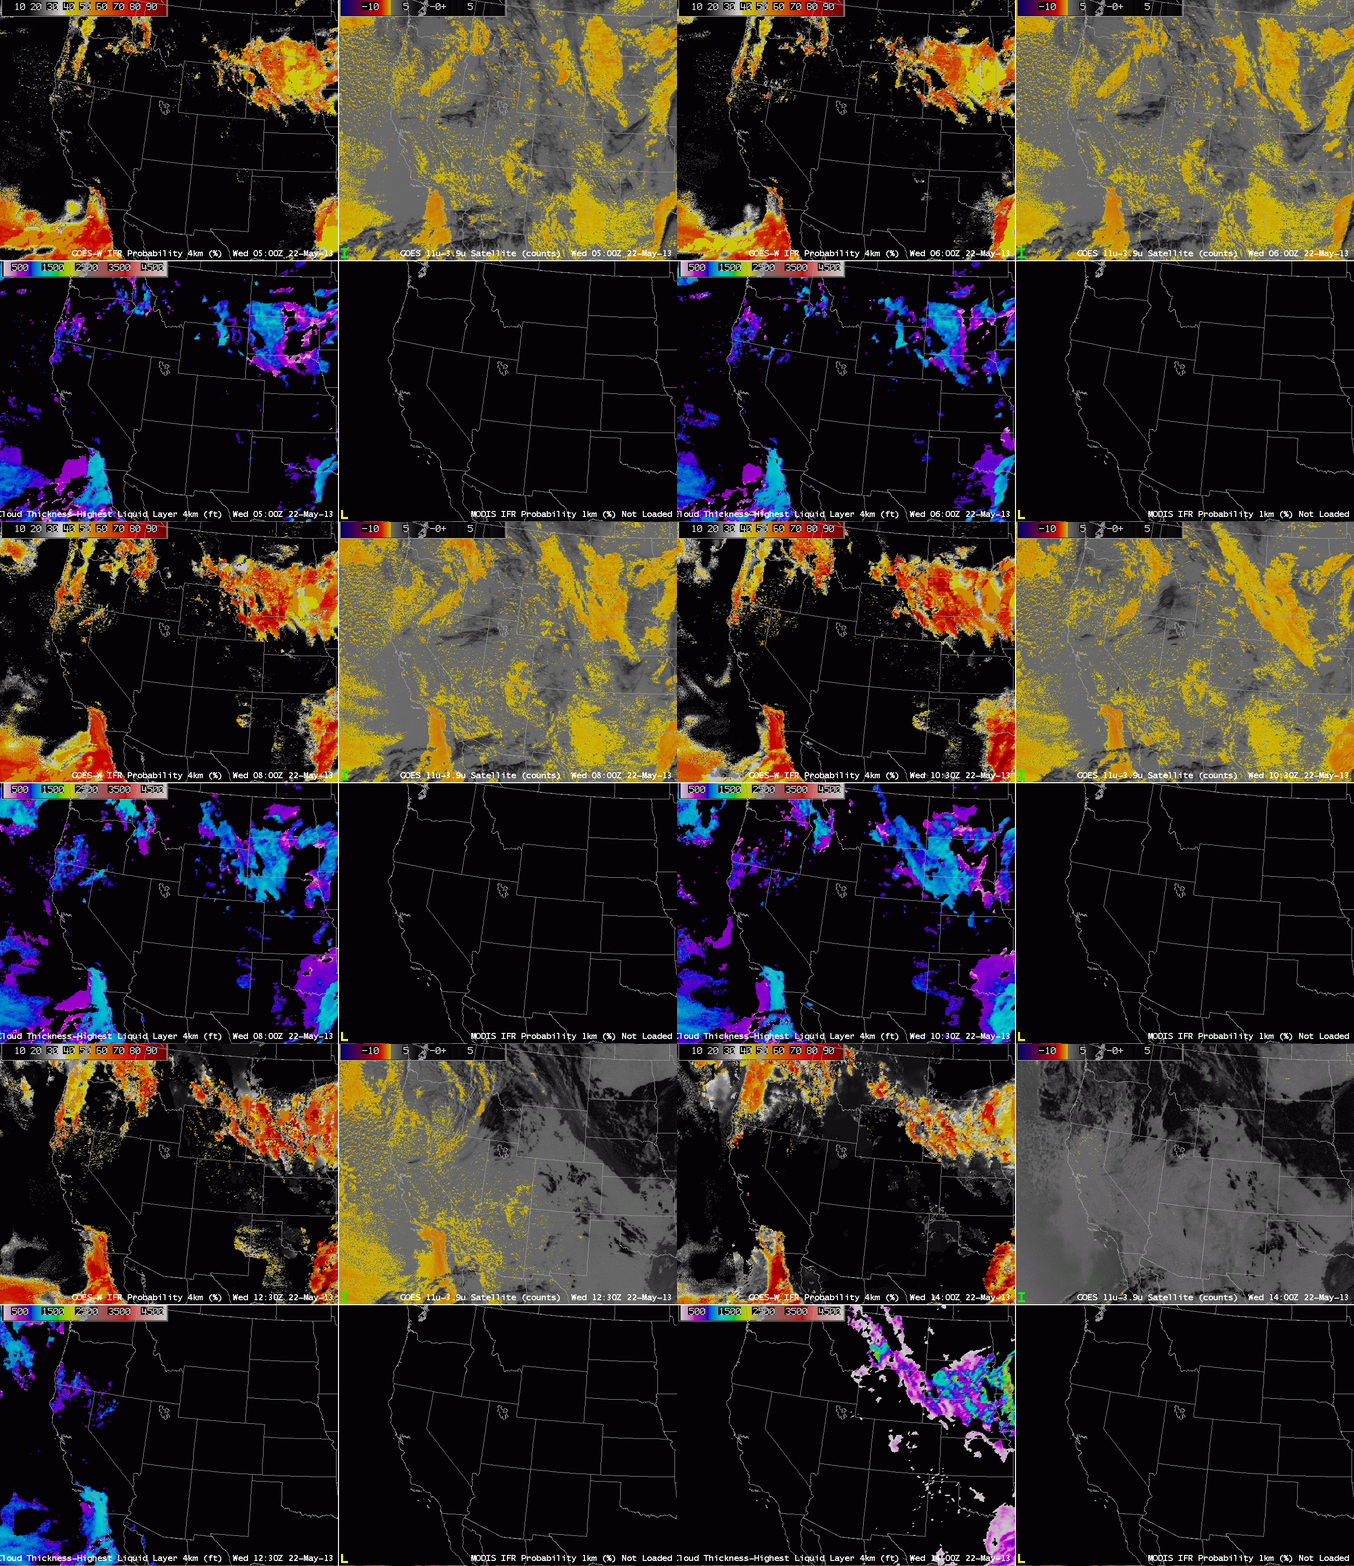
Half-hourly imagery of GOES-R IFR Probability (Upper Left) computed from GOES-West, GOES West Brightness Temperature Differences (10.7 – 3.9) (Upper Right), GOES-R Cloud Thickness (Lower Left), GOES-R IFR Probability from MODIS (Bottom right)

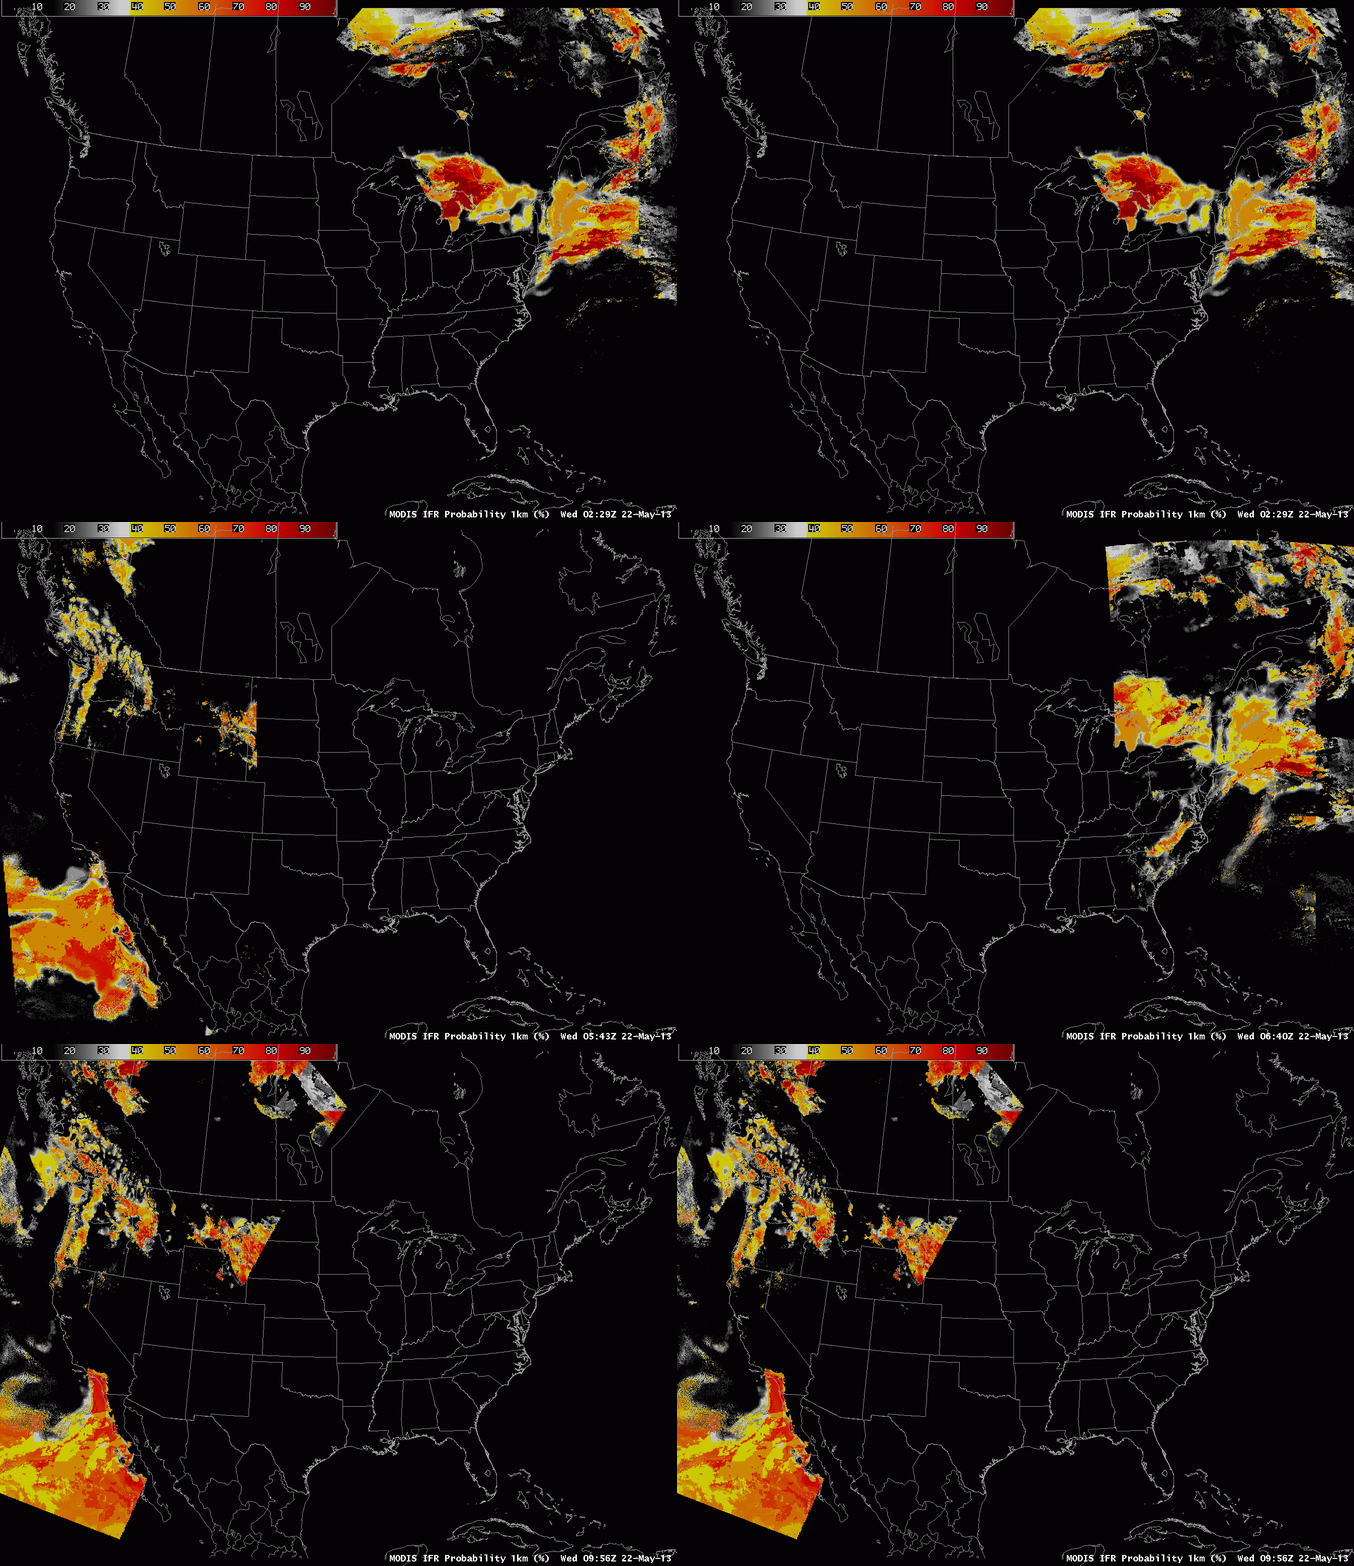
GOES-13 has experienced an anomaly, and is in safe mode.  While this occurs, GOES-15 will operates in full-disk mode.   GOES-R IFR Probability coverage is therefore limited east of the Missouri River Valley.  When GOES-14 starts transmitting imagery, starting at around 0500 UTC 23 May, GOES-East projections of GOES-R products will resume.  In the meantime, coverage along the East Coast is provided — at high resolution — by the MODIS-based GOES-R products, shown below. Temporal resolution is degraded in this polar-orbiter-based product, however.

The image loop above spans several MODIS IFR Probability products, but the MODIS products are not close enough to the half-hourly time steps to be included in the imagery.  The GOES-West-based IFR probability products identify the four main regions of reduced visibilities overnight:  the Pacific Northwest, southern California, the northern Plains, and east Texas.  Other regions that show a strong return in the brightness temperature difference product have either elevated stratus (Texas Panhandle) or soil with variable emissivity properties (the intermoutain West).

GOES-R IFR probabilities computed from MODIS data, 0230 UTC – 1000 UTC, 22 May 2013

Identifying regions of fog underneath multiple cloud layers

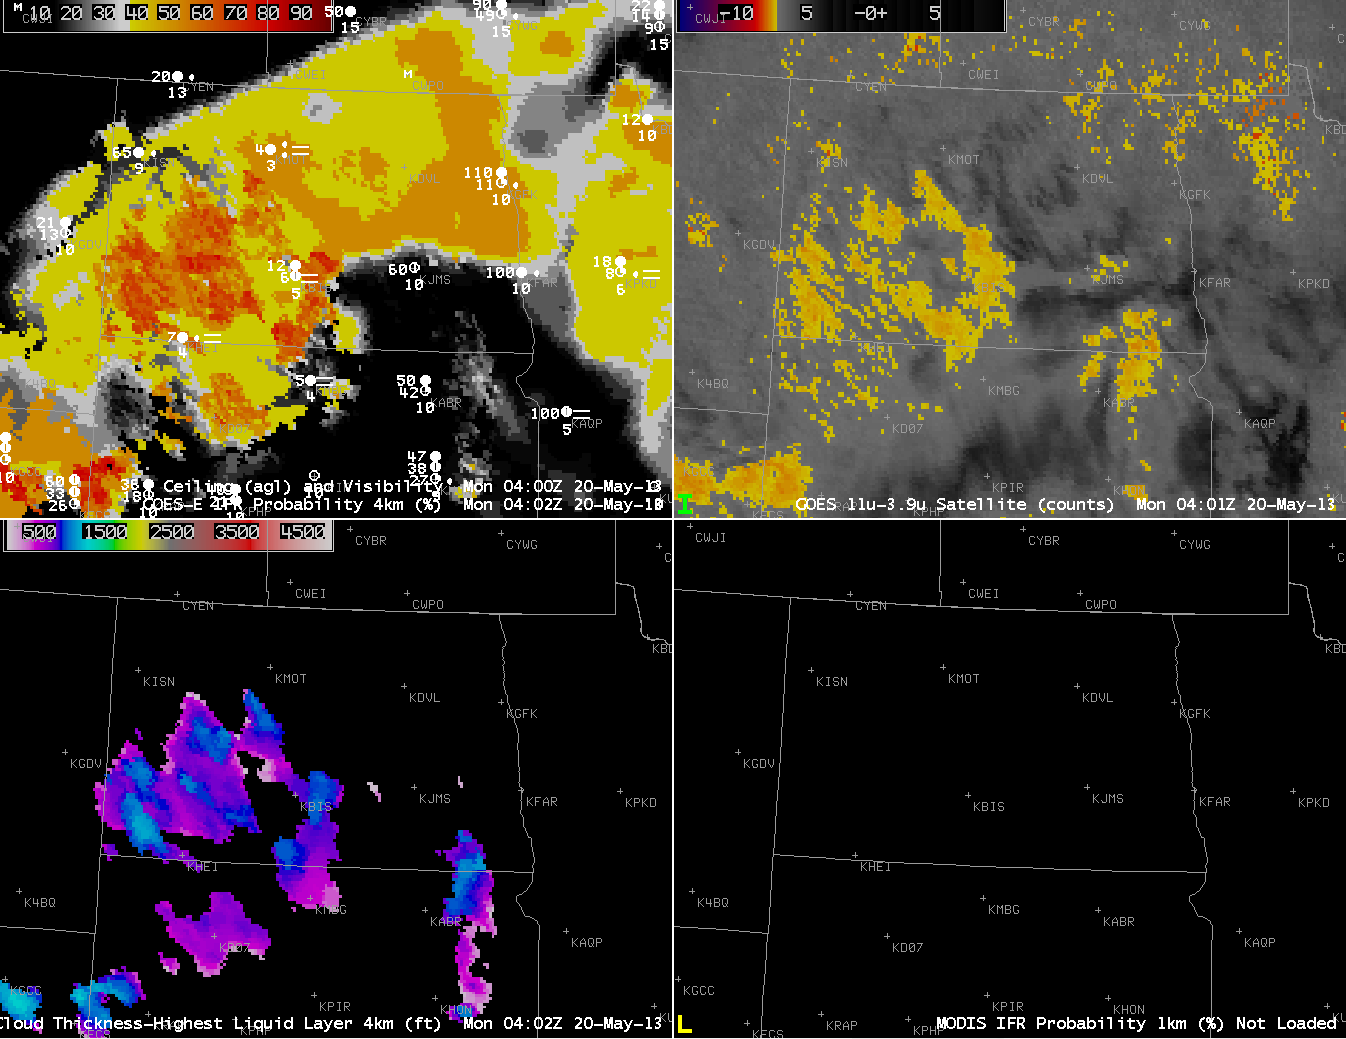
GOES-R IFR Probabilities computed from GOES-East (Upper Left), GOES-East Brightness Temperature Difference (10.7 µm- 3.9 µm) (Upper Right), GOES-R Cloud Thickness (Lower Left), GOES-R IFR Probabilities computed from MODIS (Lower Right).  All imagery around 0400 UTC 20 May 2013

When multiple cloud layers are present, the traditional method of detecting fog, the brightness temperature difference between the 10.7 µm and 3.9 µm channels on the GOES Imager, will fail.  For such a configuration of clouds, the GOES-R IFR Probability field will yield information because it also uses information from the Rapid Refresh model to predict whether fog is possible.  The image above contains regions where both model and satellite data are used to compute the IFR probability, and where model data only are used.  How can you differentiate between the two?

Regions over southwest North Dakota are not overlain by high clouds.  In those regions, a strong signal in the brightness temperature difference fields is present.  There is also a north-south oriented signal over extreme southeast North Dakota and northeast South Dakota.  In both of those regions, the Cloud Thickness product is predicting a thickness.  Such a prediction works only when low clouds are visible by the satellite.

The GOES-R IFR Probability field, in the upper left, contains regions where both satellite and model are used (and these mostly overlay the regions where the Cloud Thickness field is present) and where only model data are used (because the satellite signal for low clouds is blocked by mid- and high-level clouds).  The horizontal homogeneity of the field over northeast North Dakota is characteristic of GOES-R IFR Probability fields that are determined largely by model data only.  Compare that to the more pixelated field over southwest North Dakota where Cloud Thickness fields are also computed:  Pixelation is a hallmark of the use of satellite data in the prediction of the IFR Probability.

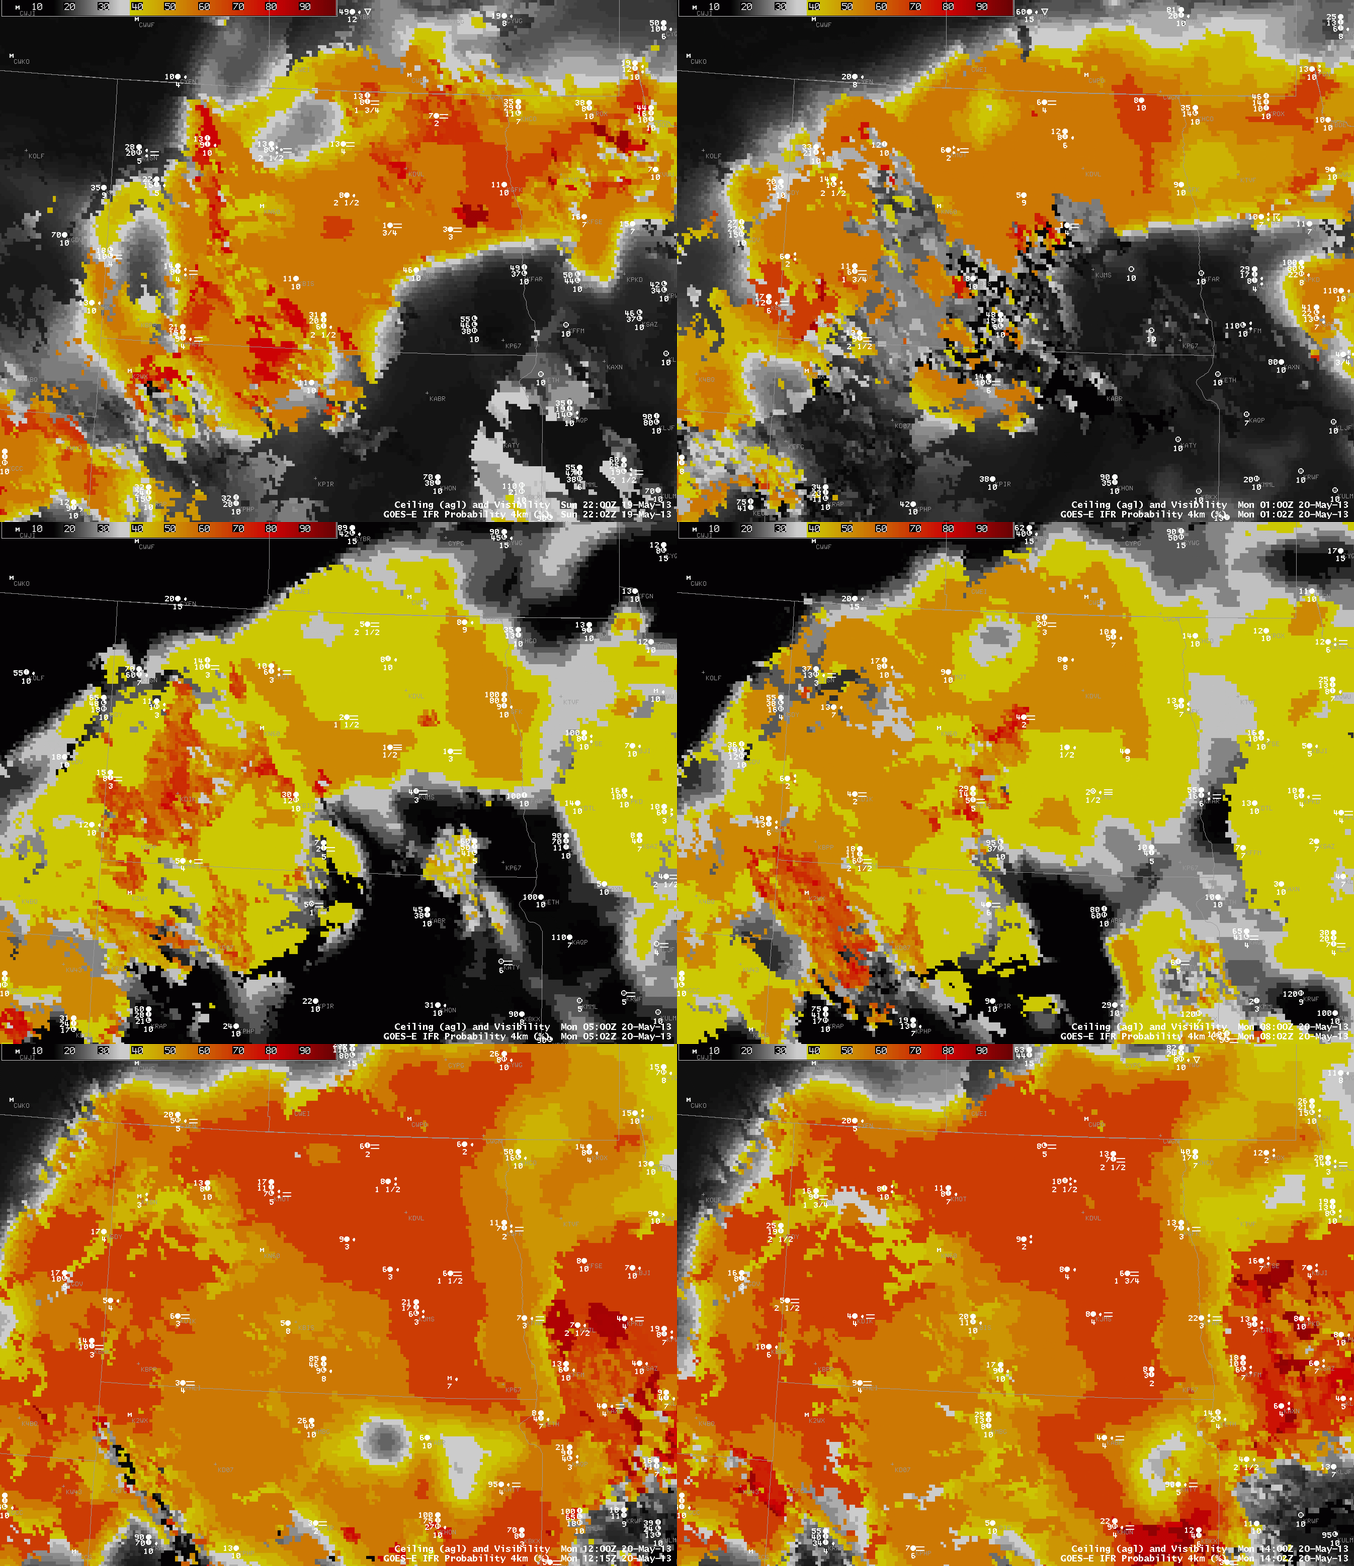
Hourly evolution of GOES-R IFR Probability (with surface plots of ceiling/visibility) over North Dakota, 2202 UTC 19 May through 1402 UTC 20 May 2013

The GOES-R IFR probability field accurately depicts the region of IFR conditions over northeast North Dakota that is separate from southeast North Dakota where higher ceilings/visibilities are present.  (Consider the observations at Jamestown, ND (KJMS), for example).  As nighttimes progresses, IFR probabilities increase over most of the state.  The switch from daytime predictors (initially) to nighttime predictors is apparent in the 0202 UTC image (the terminator slants southwest to northeast).  The switch back to daytime predictors occurs between the 1102 UTC and 1215 UTC imagery.

Small IFR Probabilities in clear regions: Why?

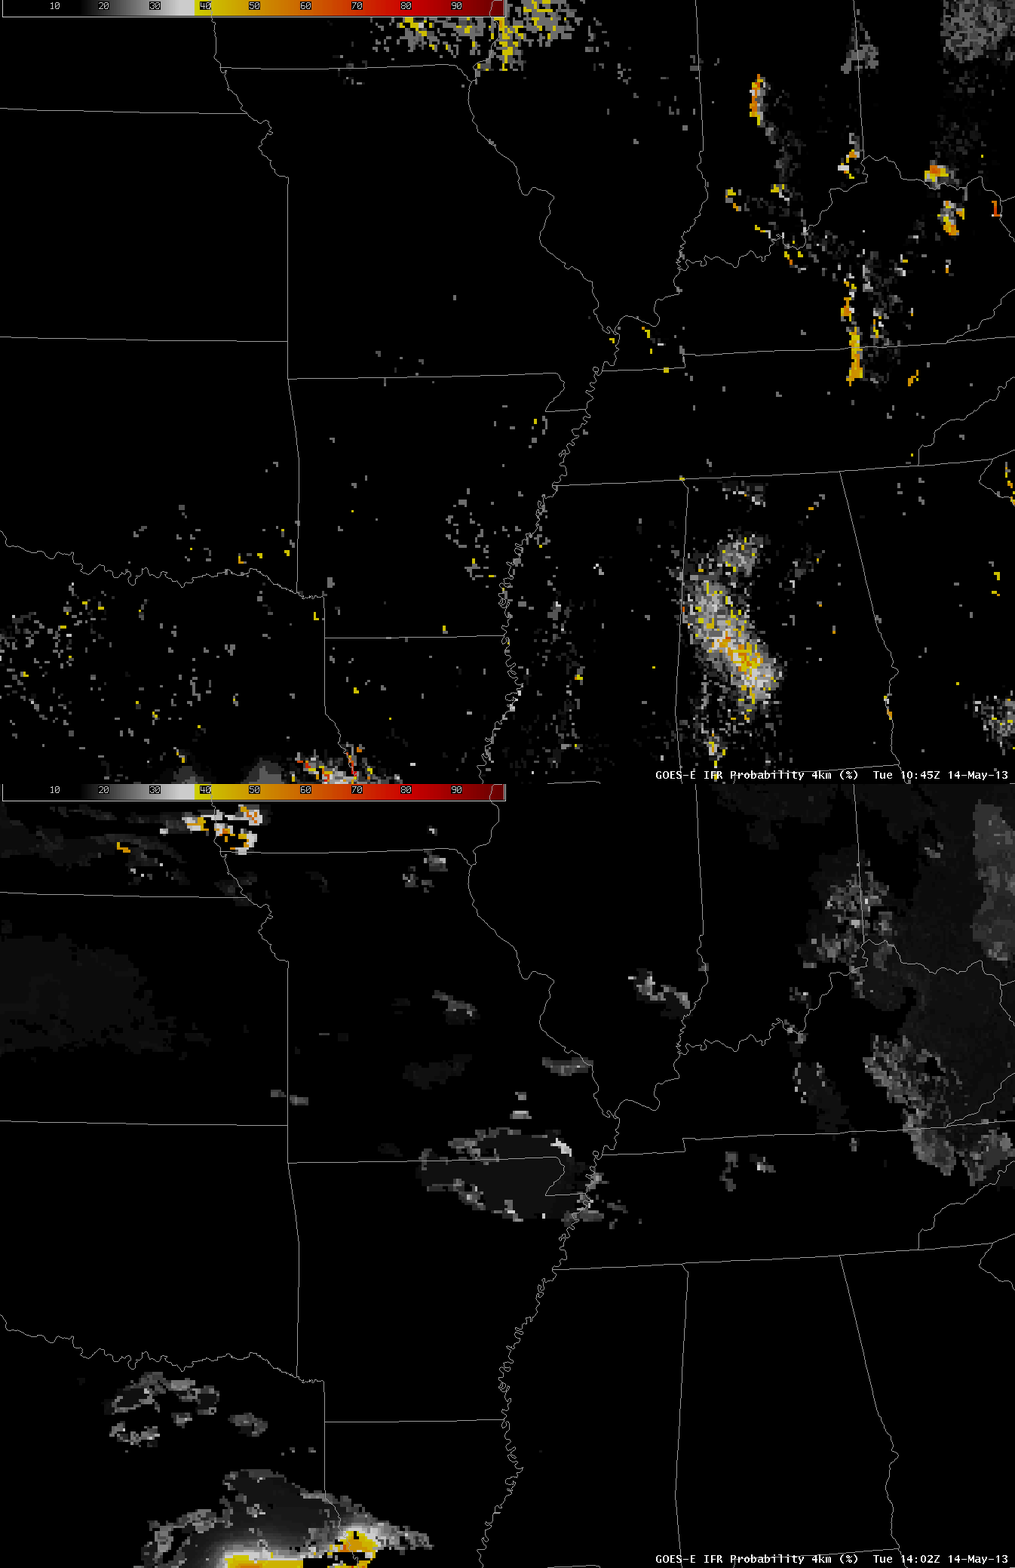
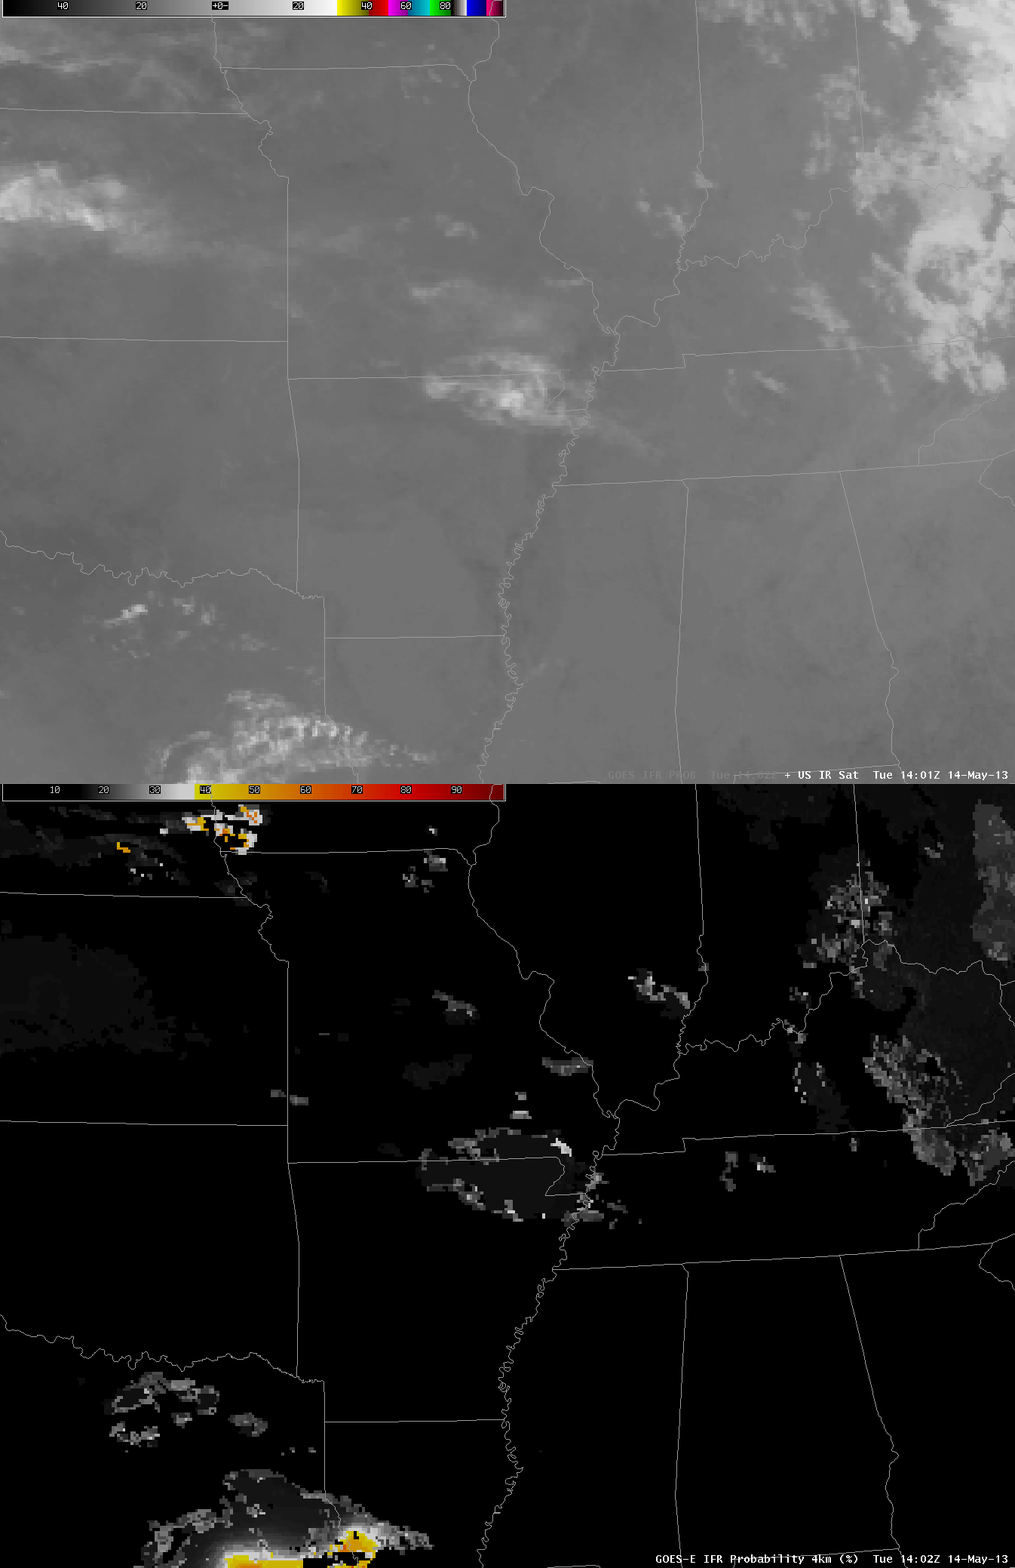
GOES-R IFR Probabilities over the Mississippi River Valley, 1045 and 1402 UTC 14 May 2013

GOES-R IFR Probabilities over the bootheel of Missouri and northeast Arkansas were erroneously high on Tuesday 14 May (and also on Monday 13 May).  This was a region of mostly clear skies.  Why, then did IFR probabilities have values exceeding zero?

Toggle between 10.7 µm imagery and GOES-R IFR Probabilities, 1402 UTC 14 May 2013

The 10.7 µm imagery does show a cool cloud overlaying the region of modest IFR probabilities.  This cloud has the appearance of a thin cirrus cloud through which radiation emitted from the surface is filtering.  Brightness temperatures at the outer edge of the cloud — where IFR probabilities are highest — are around 10 C.  This thin cloud might normally be screened out by the daytime visible cloud mask.  However, as shown below, the thin cirrus cloud is over a surface that is white enough that the cloud mask considers it to be cloud.

Always use the IFR probability in concert with other available data to ensure the computed probabilities are sensible.

Visible Imagery, 1402 UTC on 14 May 2013

Resolution: MODIS vs. GOES

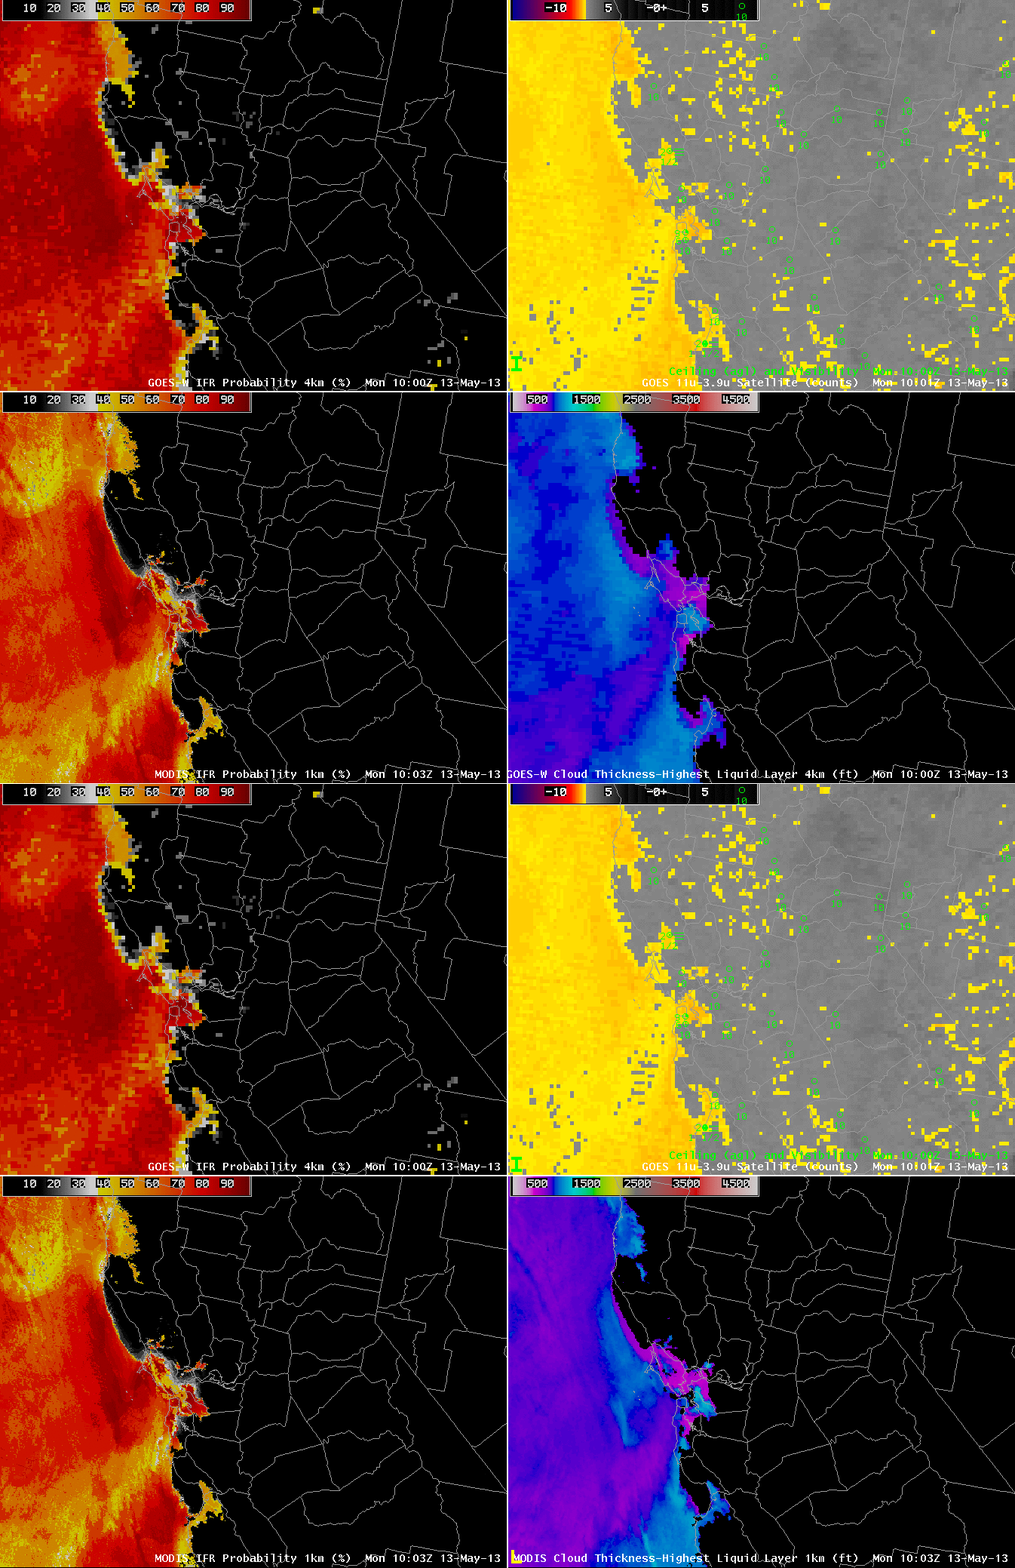
GOES-R IFR Probabilities computed from GOES-West data (Upper Left), GOES-West Brightness Temperature Difference (10.7 – 3.9 ) (Upper Right), GOES-R IFR Probabilities computed from MODIS data (Lower Left), Toggle between GOES-R Cloud Thickness computed with GOES-West data and with MODIS data, all imagery around 1000 UTC on 13 May 2013

The high spatial resolution on MODIS allows a much more detailed description of IFR probability fields, and cloud thickness fields, than from the GOES-West Imager instrument.  Note in the IFR probability fields on the left, and in the toggle of the Cloud Thickness fields, how the MODIS fields show crisper edges to the fog.  The IFR probability is also — correctly — screening out brightness temperature difference signal in regions where fog and low stratus are not present (in central California and over Nevada).  Note how the three stations reporting IFR conditions all sit within the region where the brightness temperature difference field has a strong signal, and where the IFR Probability is high.

GOES-R Resolution will be between MODIS and present GOES;  that is, nominal pixel size in the GOES-R era will be 2 km.

Radiation Fog and Dissipation Time in Florida

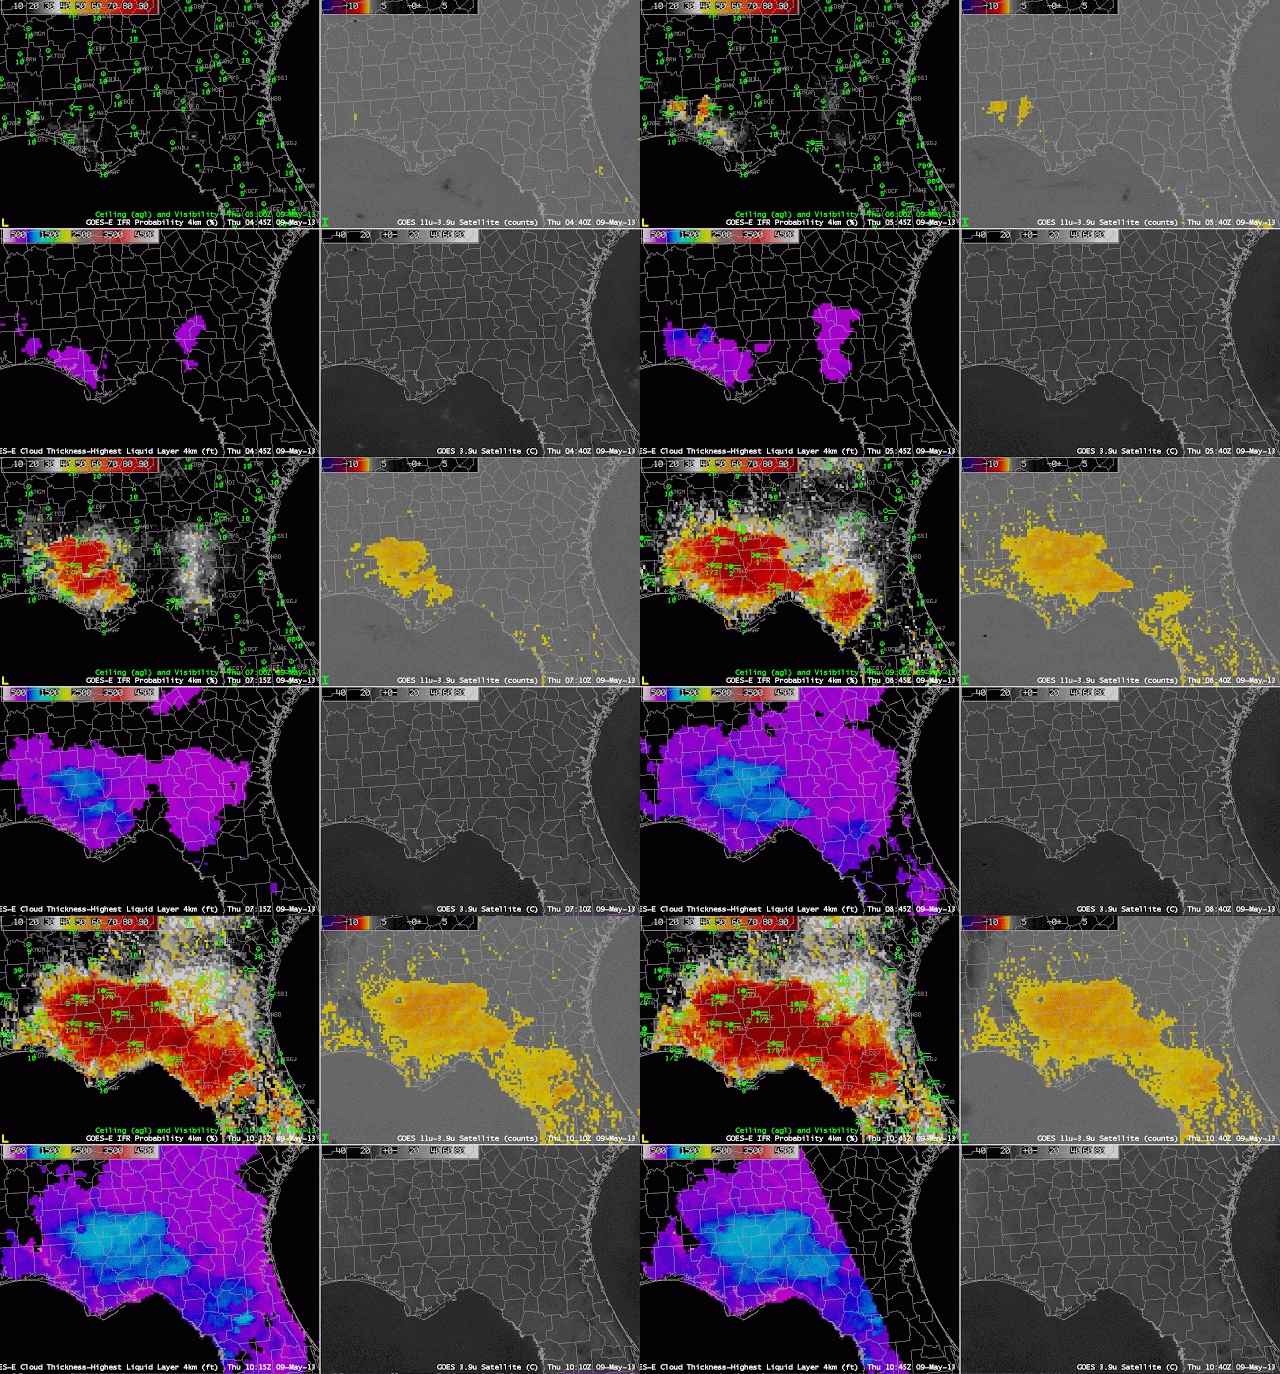
GOES-R IFR Probability computed from GOES-East (Upper left), GOES-East Brightness Temperature Difference (10.7 µm- 3.9 µm) (Upper right), GOES-R Cloud Thickness (Lower Left), GOES-East 3.9 µm Brightness Temperature (Lower Right)

GOES-R Fog/Low Stratus fields can be used to predict fog dissipation times, and in cases of radiation fog, the IFR probability fields sometimes give advance notification of developing IFR conditions before the traditional brightness temperature difference field has a strong signal.

In the example above, for instance, IFR probabilities at 0715 UTC suggest IFR conditions are possible over Perry, FL — in Taylor County, Florida — (where IFR conditions are observed) before the Brightness Temperature Difference field has a signal.   Predictions of IFR conditions via that GOES-R fields before the Brightness Temperature Difference field has a strong signal are common.

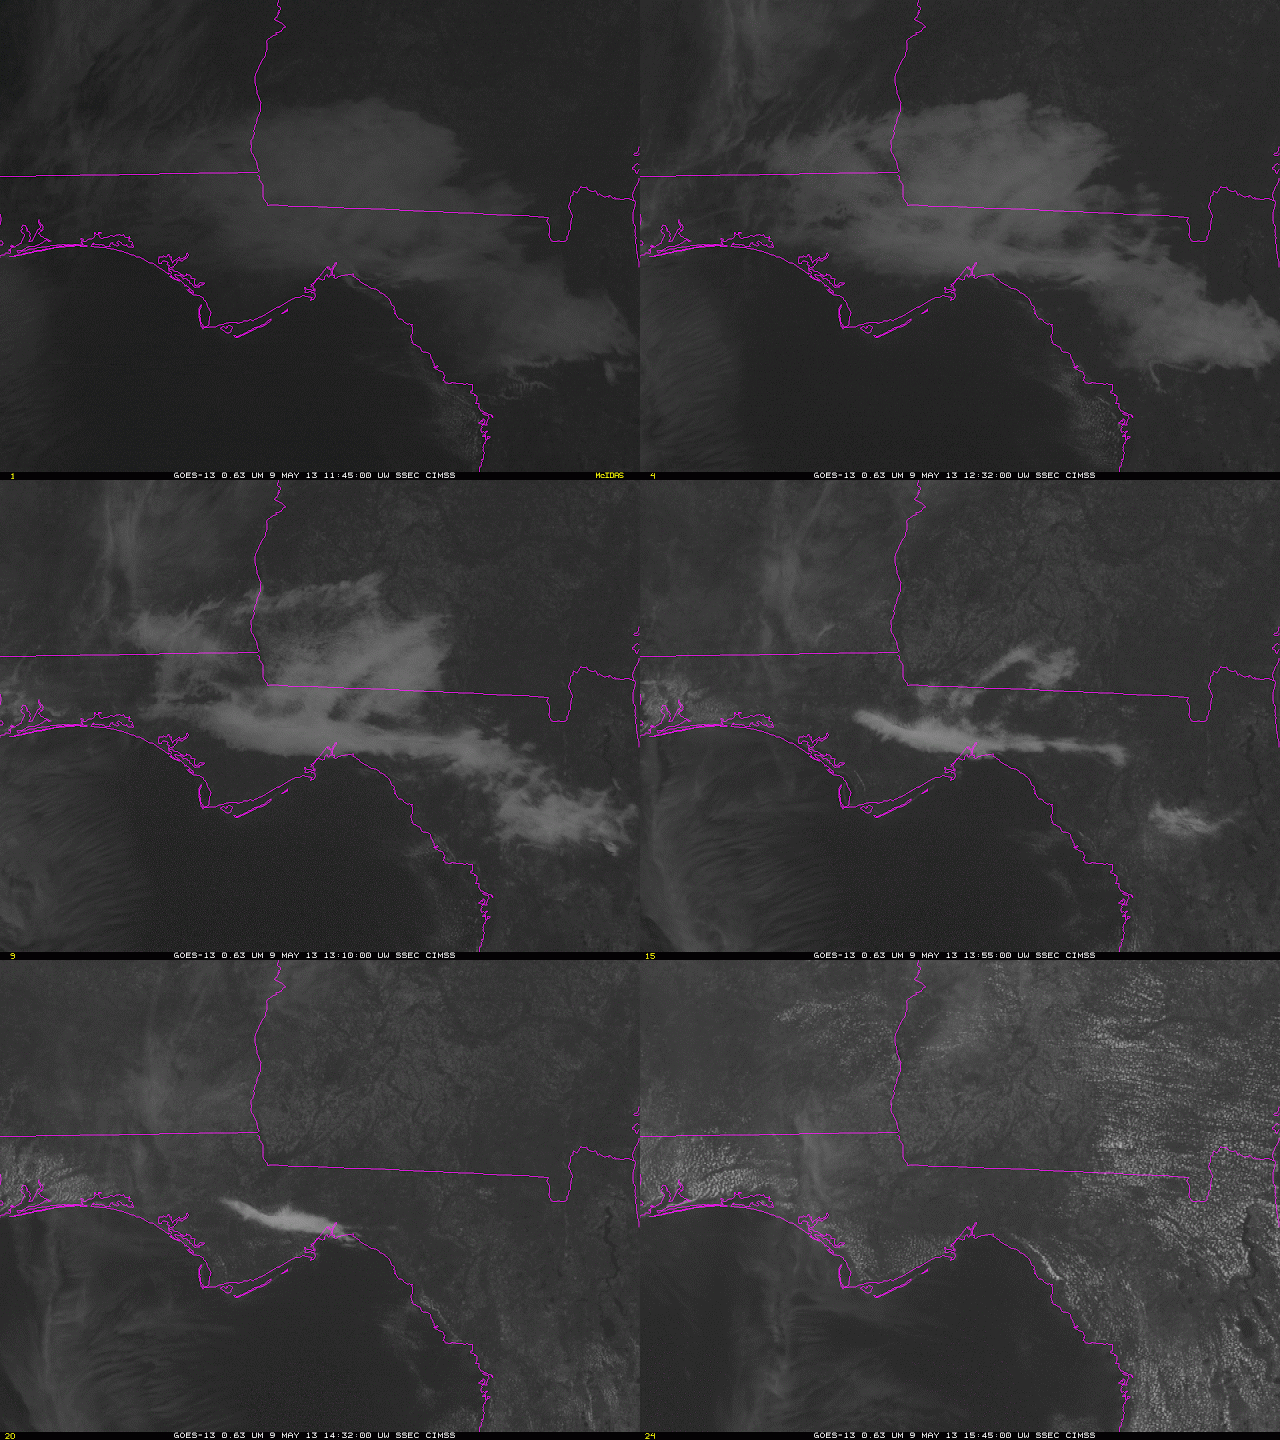
The GOES-R Cloud Thickness observed just before twilight conditions is used with this scatterplot to predict dissipation time.  In the example above, thicknesses are near 1000 feet over northern Florida and southern Georgia, so fog will dissipate in between 2 and 4 hours, according to the points plotted, or in a little over 3 hours according to the best linear fit through the plotted points.  The visible imagery animation, below, shows the fog dissipating as expected from the scatterplot.

GOES-13 Visible Imagery over northern Florida

Stratus and Fog over the Midwest, Tuesday Morning May 7 2013

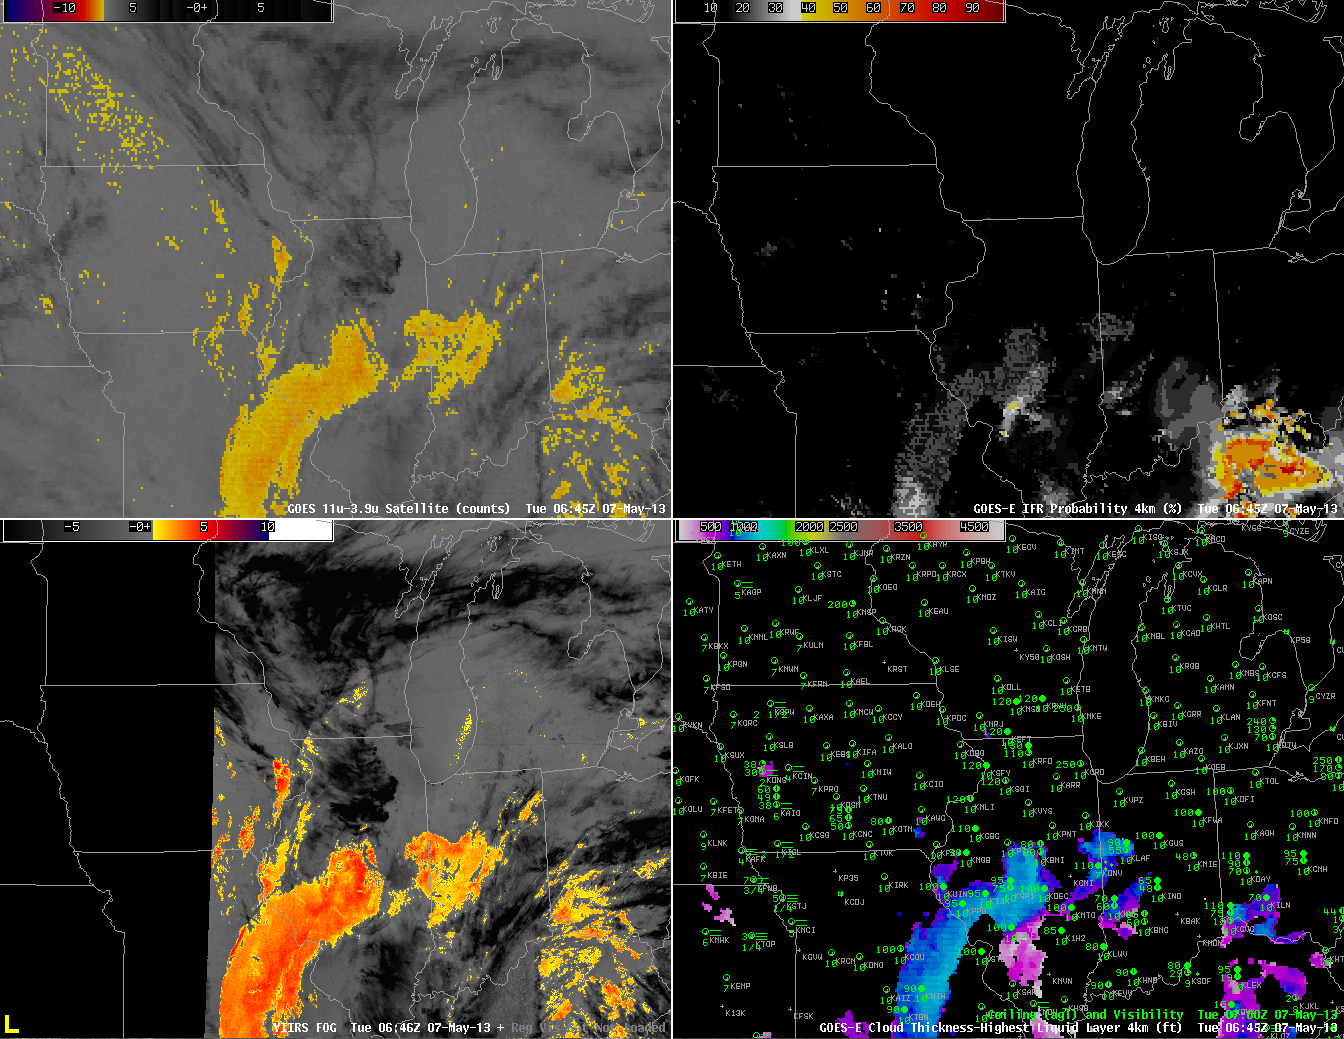
GOES-East Brightness Temperature Difference (10.7 µm – 3.9 µm) (Upper left), Suomi/NPP VIIRS Brightness Temperature Difference (10.35 µm – 3.74 µm) (Lower Left), GOES-R IFR Probability computed from GOES-East (Upper Right), GOES-R Cloud Thickness of highest water cloud (Lower Right), all imagery near 0645 UTC May 7 2013.

Areas of low stratus and fog developed over the upper Midwest in the morning on Tuesday, May 7th 2013.  In the image above from ~0645 UTC, both GOES and Suomi/NPP detect clouds comprised of water droplets over central Illinois southwestward through St. Louis and into central Missouri.  Careful examination of the ceilings/visibilities in that region, however, suggests that this is a mid-level stratus deck, and IFR Probabilities are suitably low.  Fog is observed in northwest Missouri and over western Iowa.  In this region, GOES does not detect water-based clouds, and IFR probabilities are low.

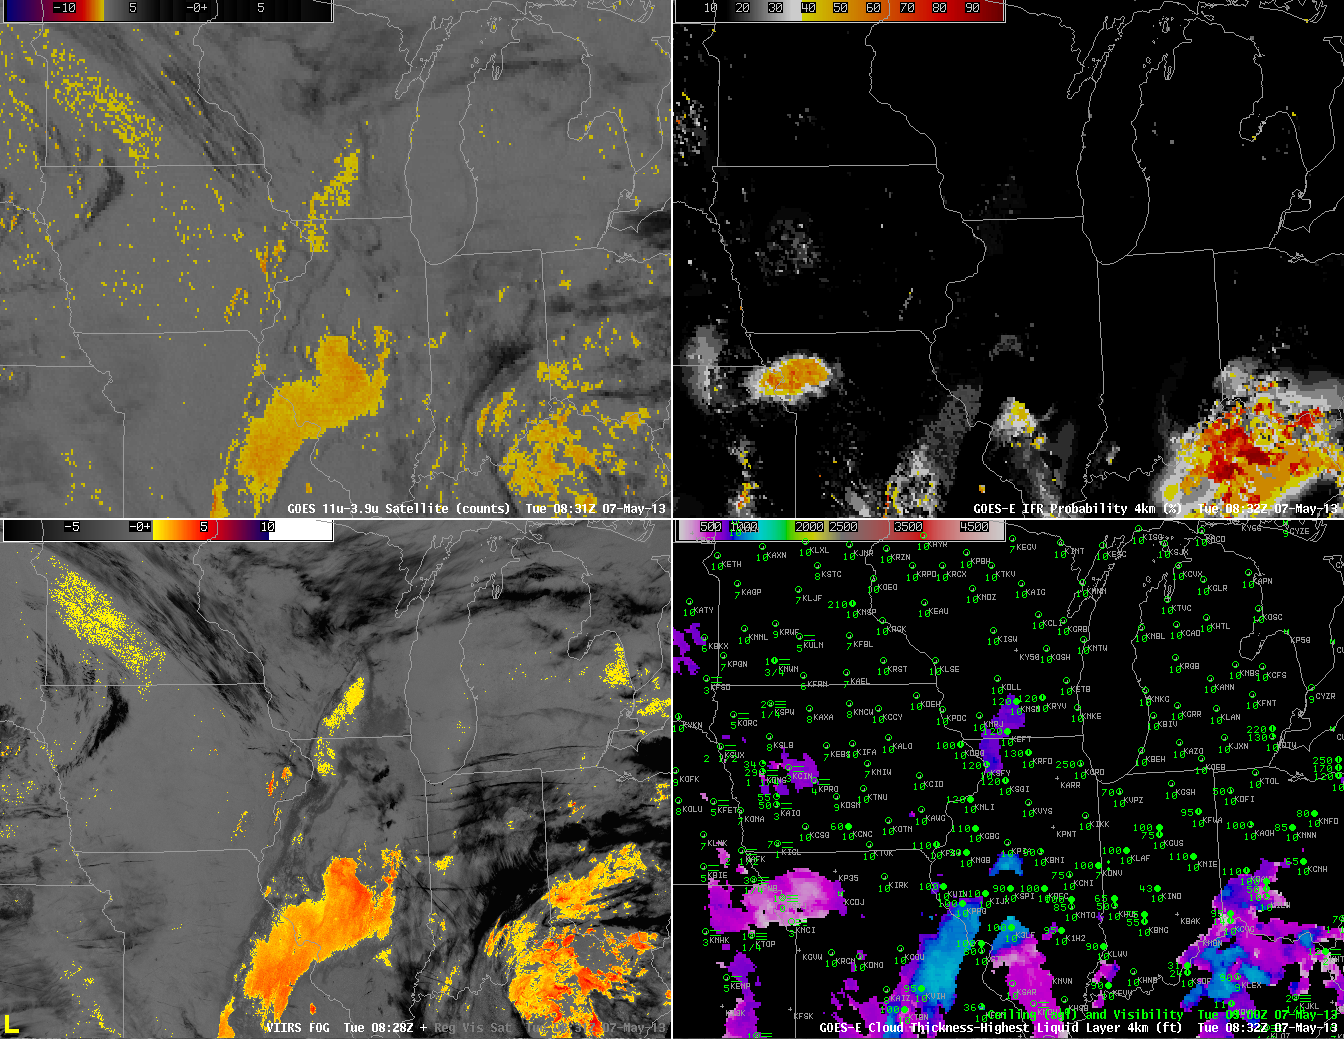
As above, but for times near 0830 UTC 7 May 2013

Two hours later, at 0830 UTC, (above) the mid-level clouds persist near St. Louis.  IFR conditions are not occurring there, however, and IFR probabilities are low.  IFR probabilities have increased around Kansas City, however, and they’re increasing in western Iowa as well, where numerous reports of reduced visibilities due to fog are occurring. This is a region where the brightness temperature difference product, the heritage method for detecting fog and low stratus, gives no information because of multiple cloud layers.

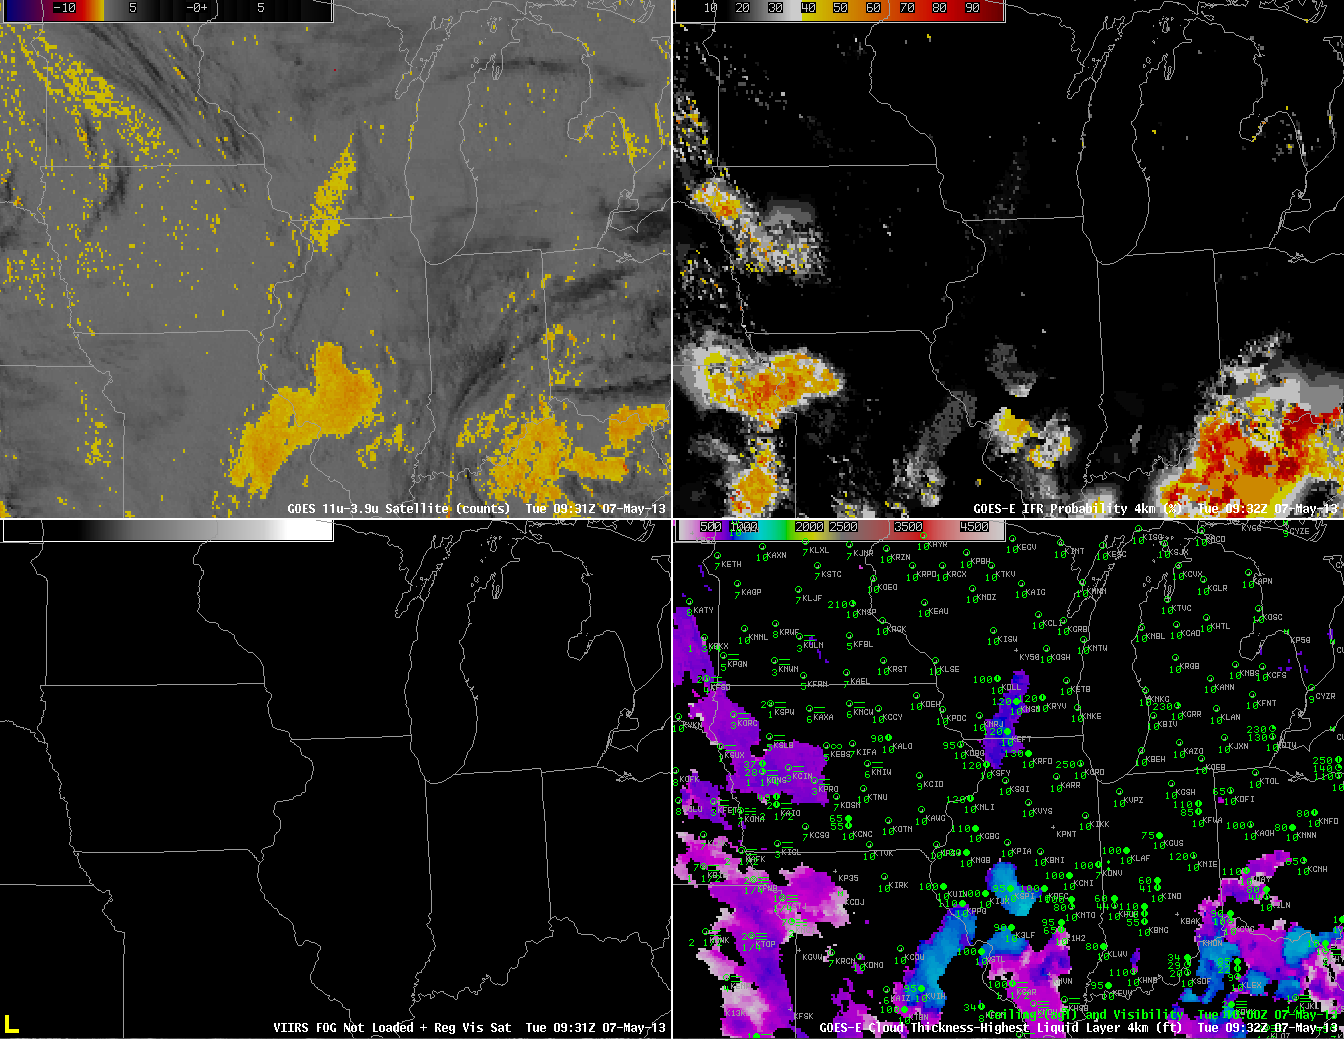
As above, but for times near 0930 UTC

At 0930 UTC (above), IFR Probabilities continue to increase over western Iowa southward into eastern Kansas, and they continue to be (correctly) suppressed near St. Louis where the traditional brightness temperature difference field notes the presence of a cloud comprised of water droplets.

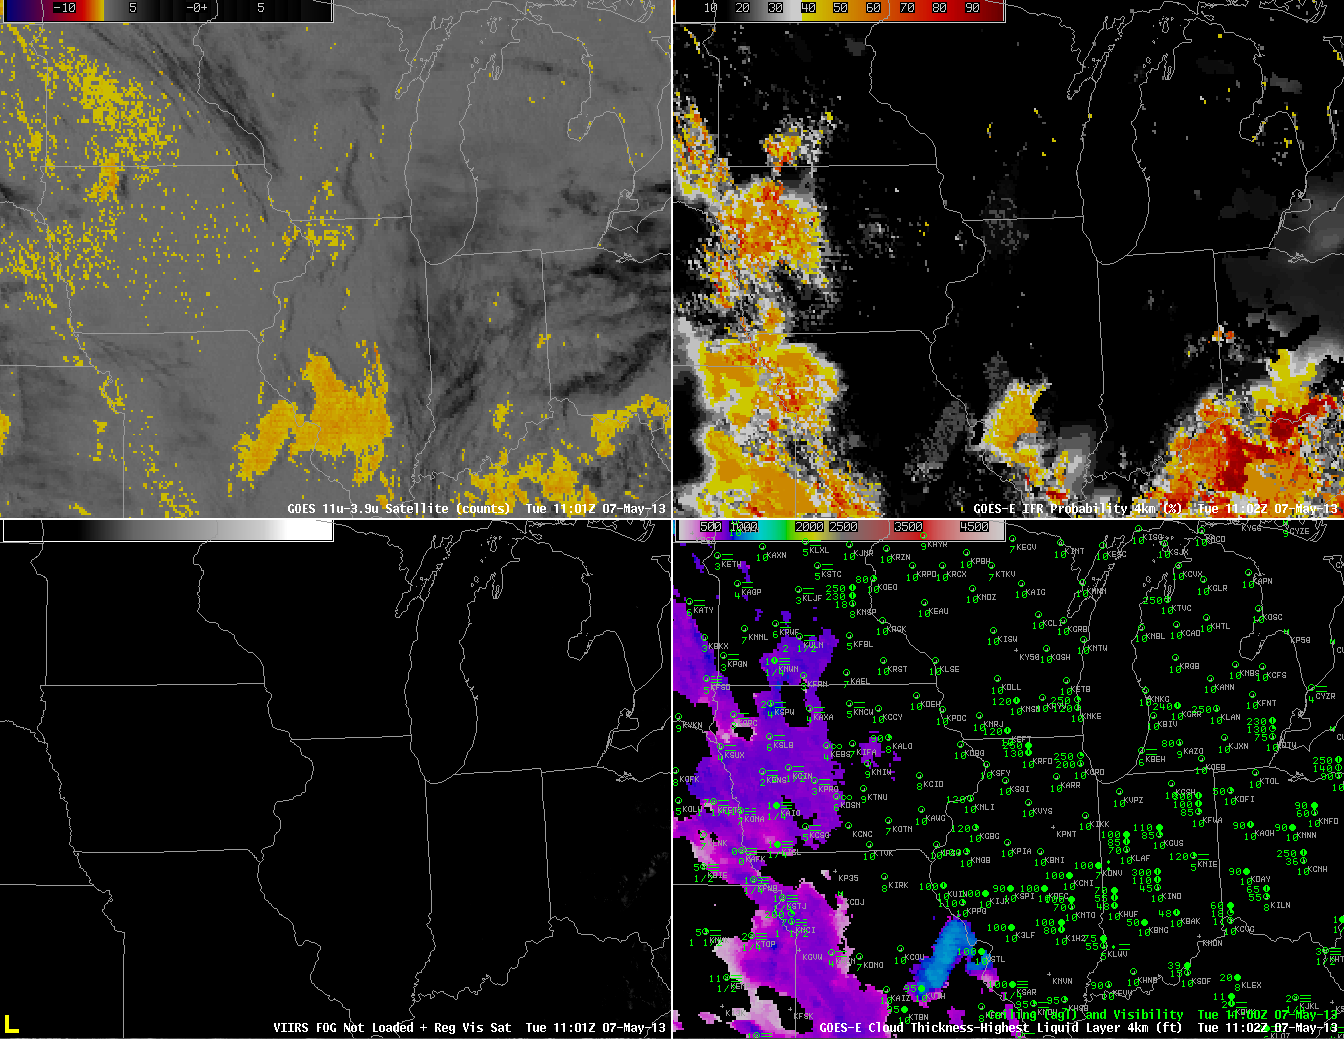
As above, but for 1100 UTC

By 1100 UTC (above), IFR probabilities are fairly high over most of western Iowa, western Missouri and eastern Kansas where many stations are reporting lowered ceilings and reduced visibility.  Again, this is a region where the traditional brightness temperature difference does not indicate the presence of fog and stratus.

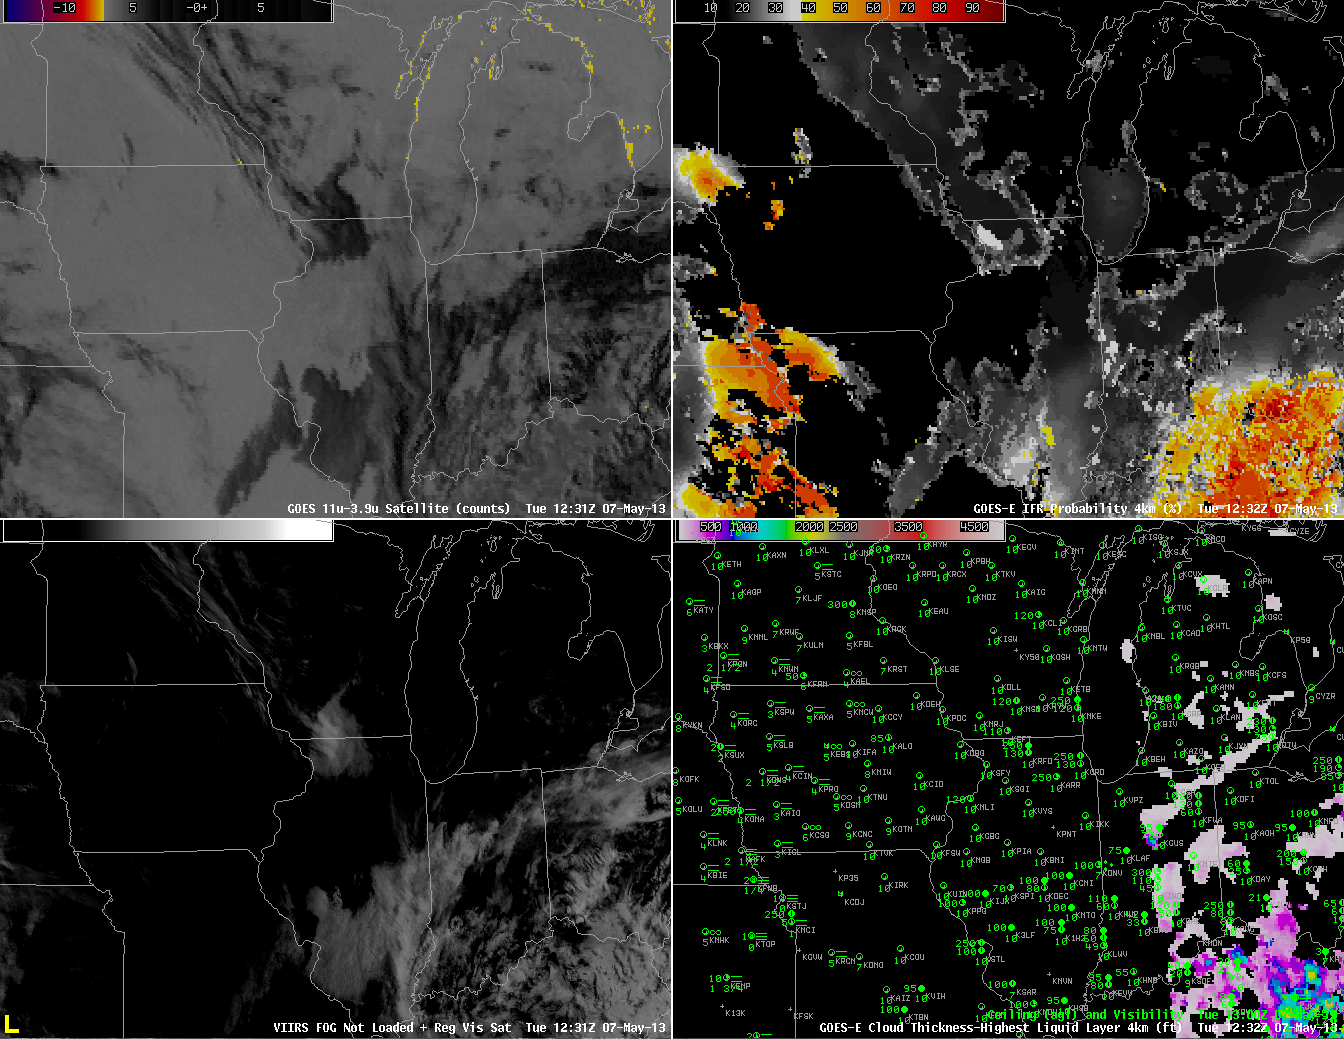
As above, but for 1230 UTC 7 May.  GOES-East Visible Imagery substituted for Suomi/NPP VIIRS Brightness Difference (bottom left)

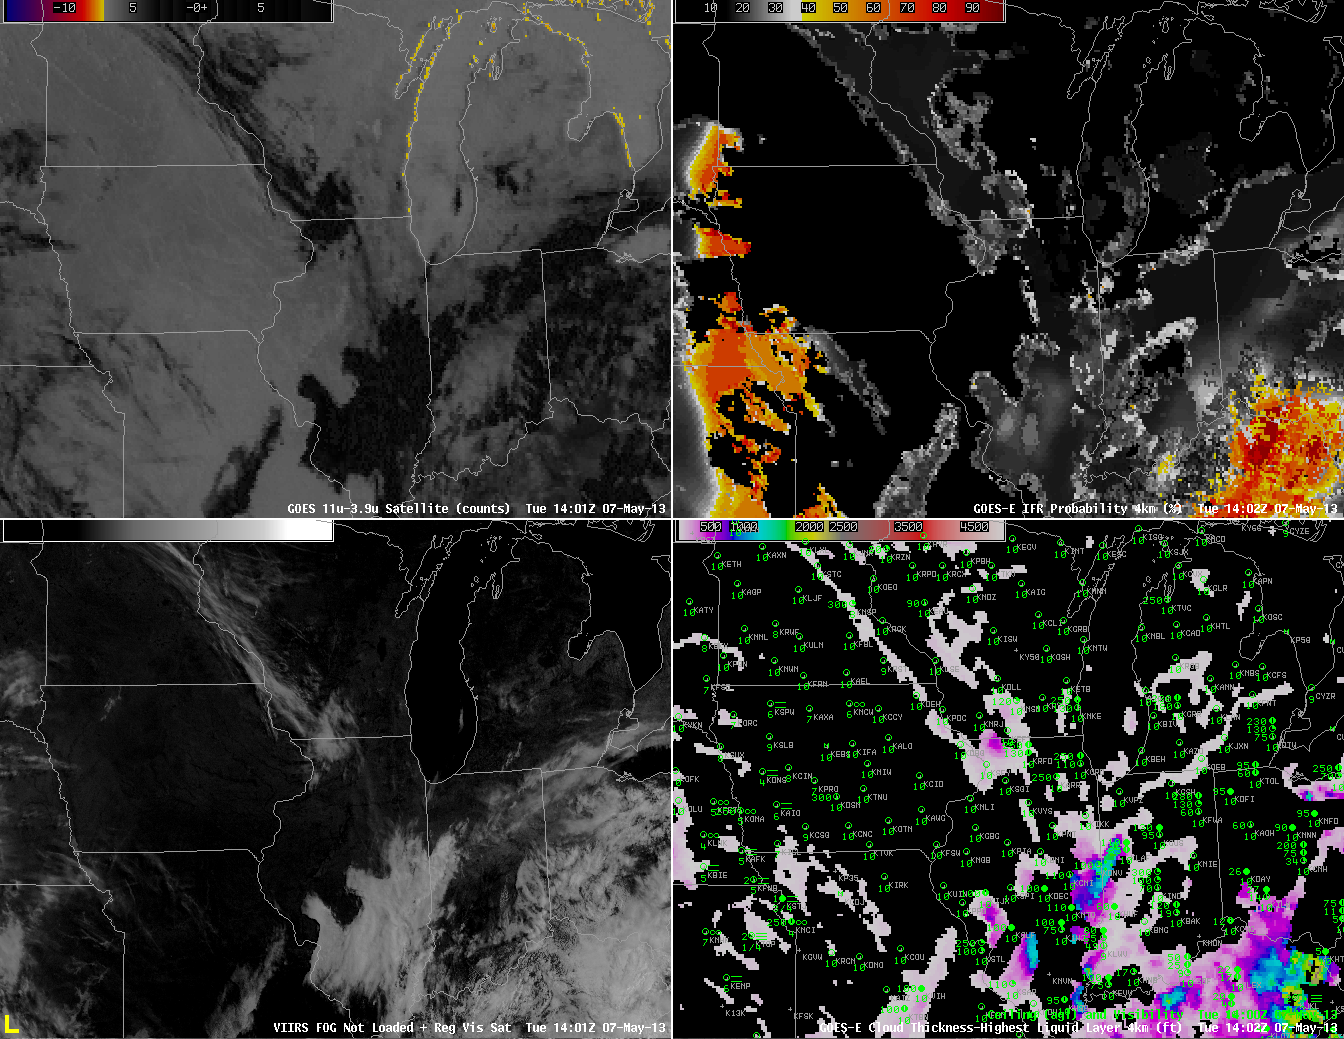
 Shortly after sunrise, at 1230 UTC, above, IFR probabilities continue to be fairly high over western Missouri and eastern Kansas, a region where some stations are reporting IFR conditions (most notably in the Missouri River valley).  One reason that IFR Probabilities have dropped quickly over Iowa is that visible imagery shows no fog there, so the cloud-clearing part of the IFR Probability algorithm used during daytime conditions is operating properly.  Note also the false brightness temperature difference signal along the western shores of the Great Lakes.  This signal arises from a co-registration error between the longwave and shortwave infrared channels.  It continues through 1400 UTC (below).

As above, but for 1402 UTC