Category Archives: MODIS

Coastal California Fog

NPP_DNB_BTD_1003UTC_12August2015toggle

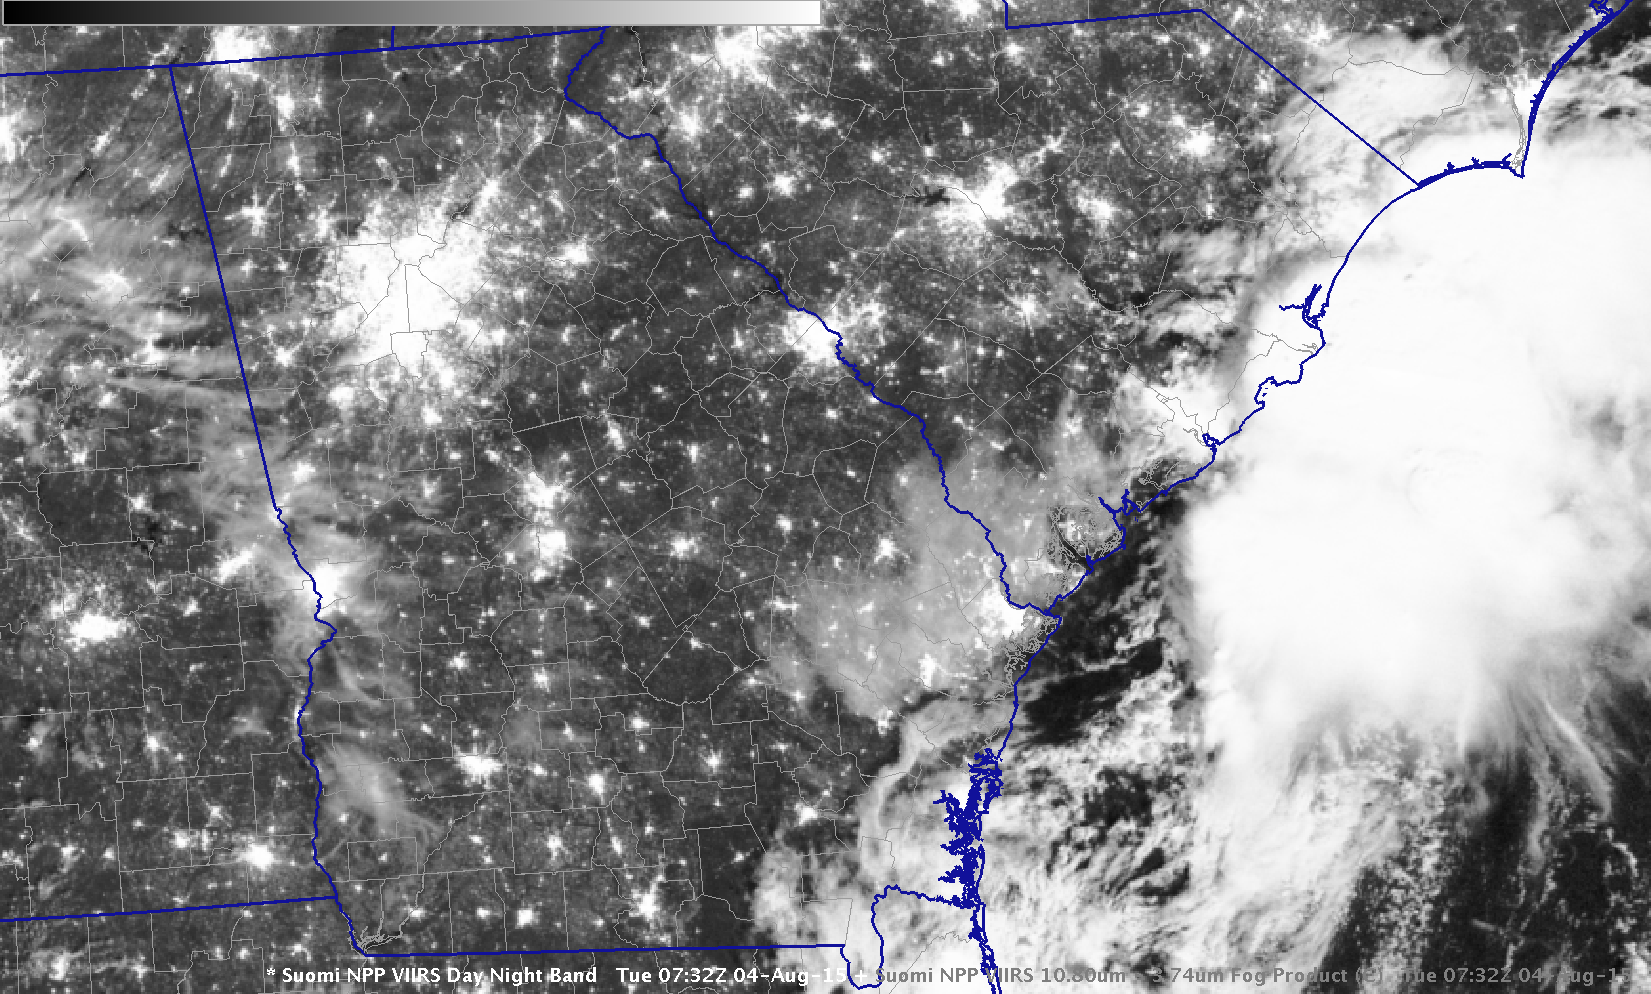
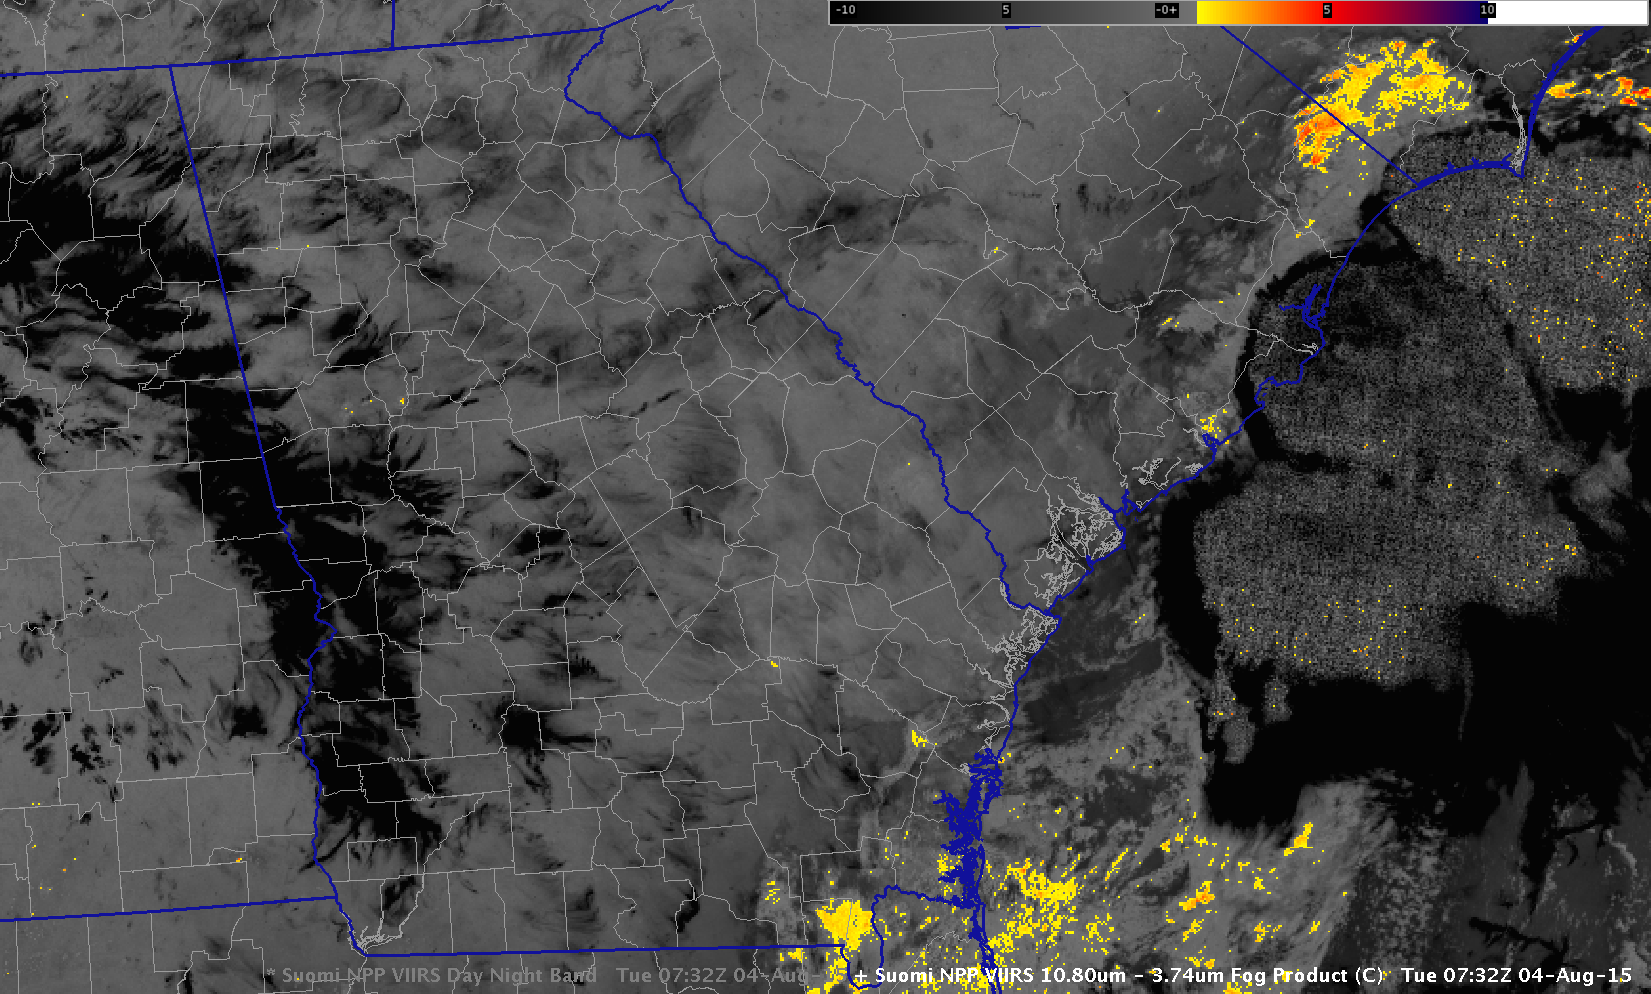
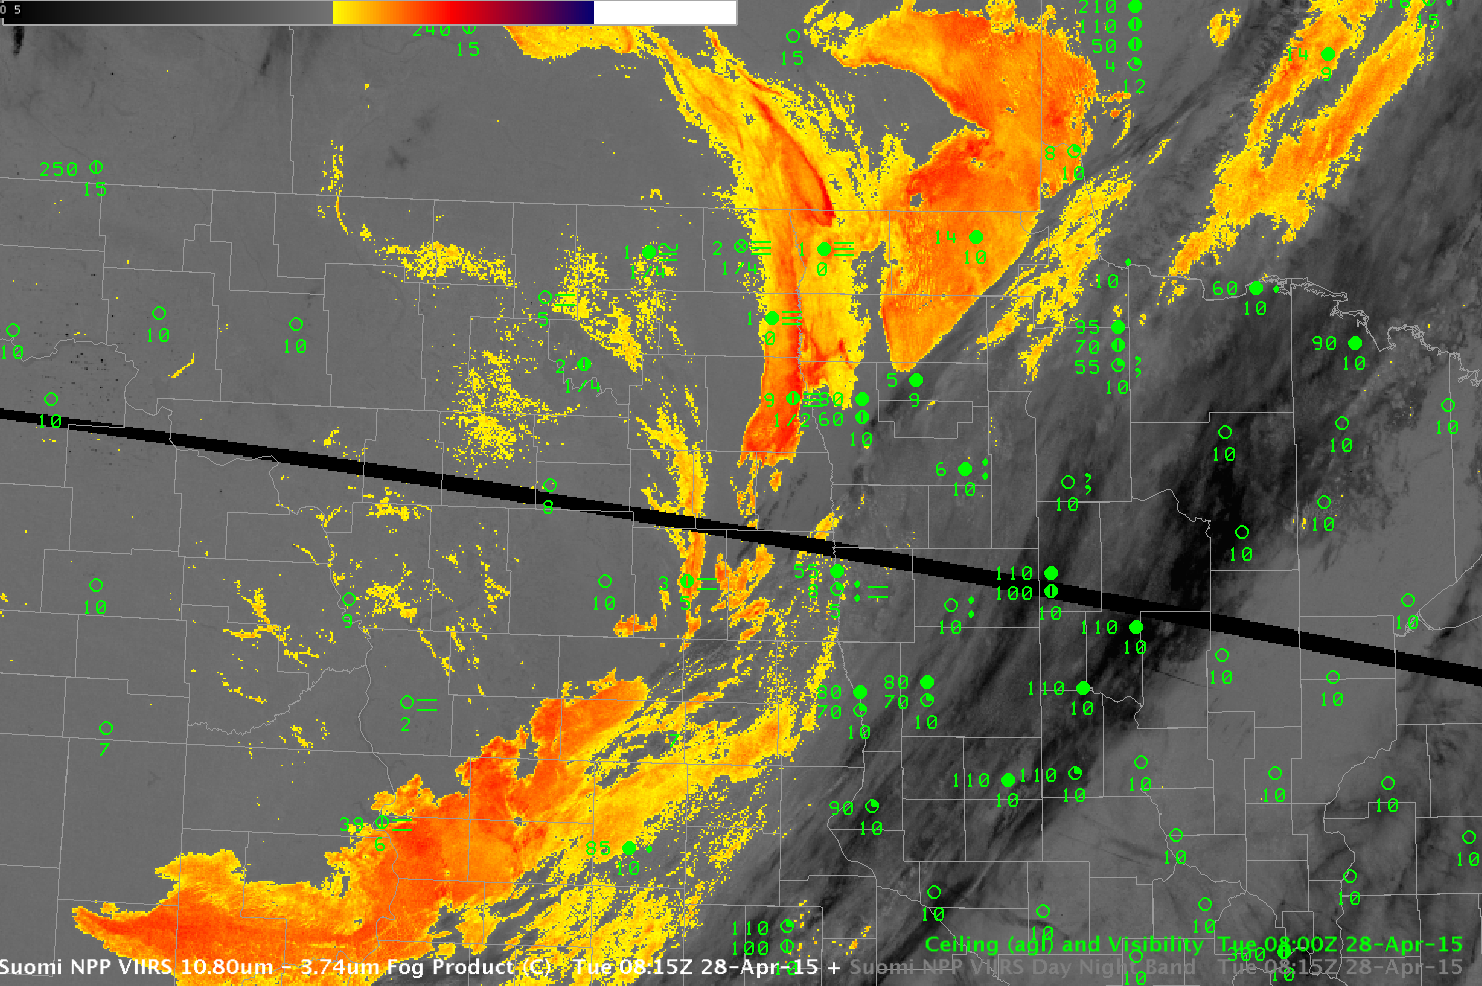
Toggle between Suomi NPP Day Night Band Visible (0.70 µm) Image and Brightness Temperature Difference (11.45 µm – 3.74 µm) , 1003 UTC 12 August 2015 (Click to enlarge)

Suomi NPP data from 1003 UTC on 12 August, above, shows evidence of a cloud bank hugging the northern California coast from Cape Mendocino to San Francisco Bay. It also penetrates inland to Santa Rosa in Sonoma County. (Note also how the fires burning in interior show up well in the Day Night Band — they are emitting visible light — and in the Brightness Temperature Difference band — because they are much warmer in the 3.74 µm image than in the 11.45 µm image).

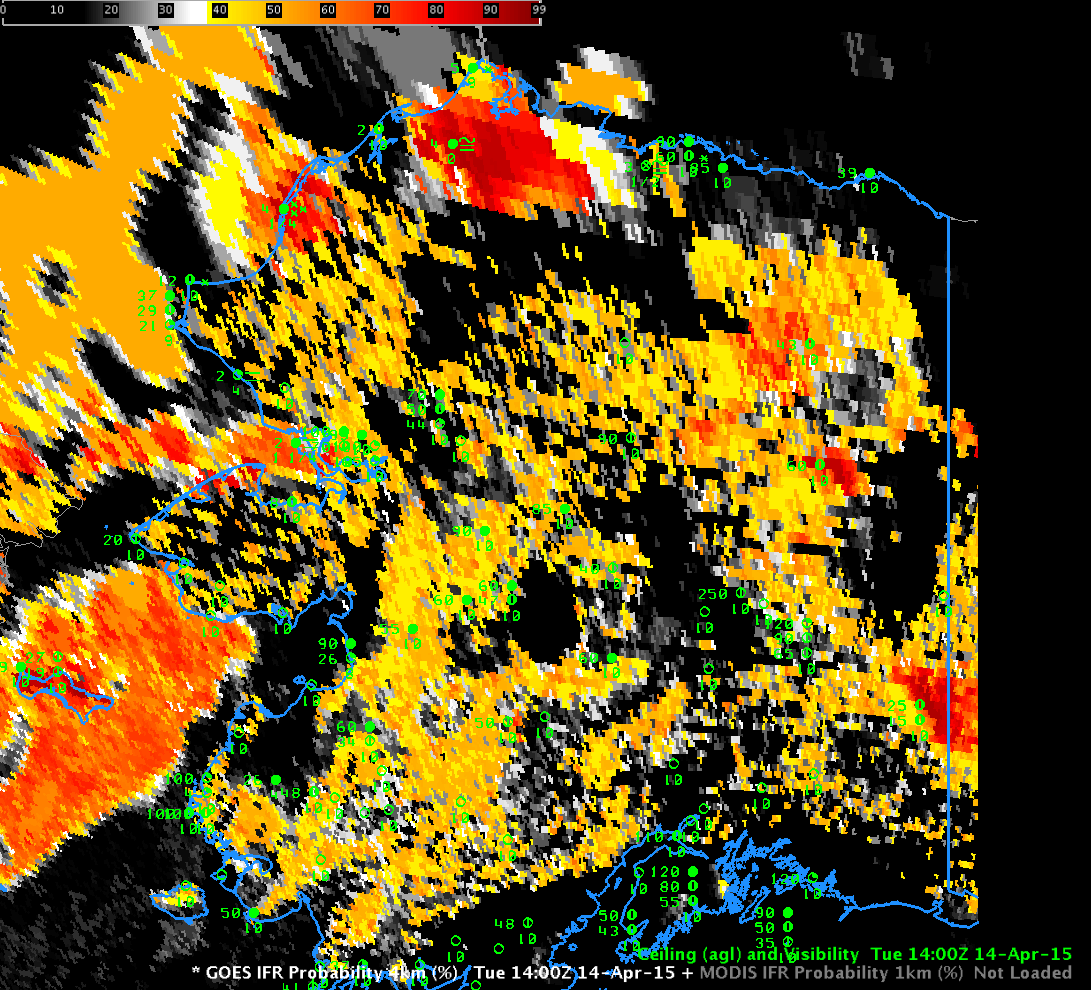
Terra overflew the California coast at ~0600 UTC and Aqua overflew the coast at ~1000 UTC; MODIS-based IFR Probabilities could be constructed from these overpasses, and they are shown below.  At 0609 UTC, High IFR Probabilities (>90%) are confined to coastal Sonoma County and along the coast from Humboldt county north.  By 1023 UTC, high IFR Probabilities stretch along the entire coast from Cape Mendocino to the mouth of San Francisco Bay, with evidence of inland penetration along river valleys.  (The Russian River, for example, and perhaps the Noyo River in Mendocino County)

MODIS_IFR_0609UTC_12August2015

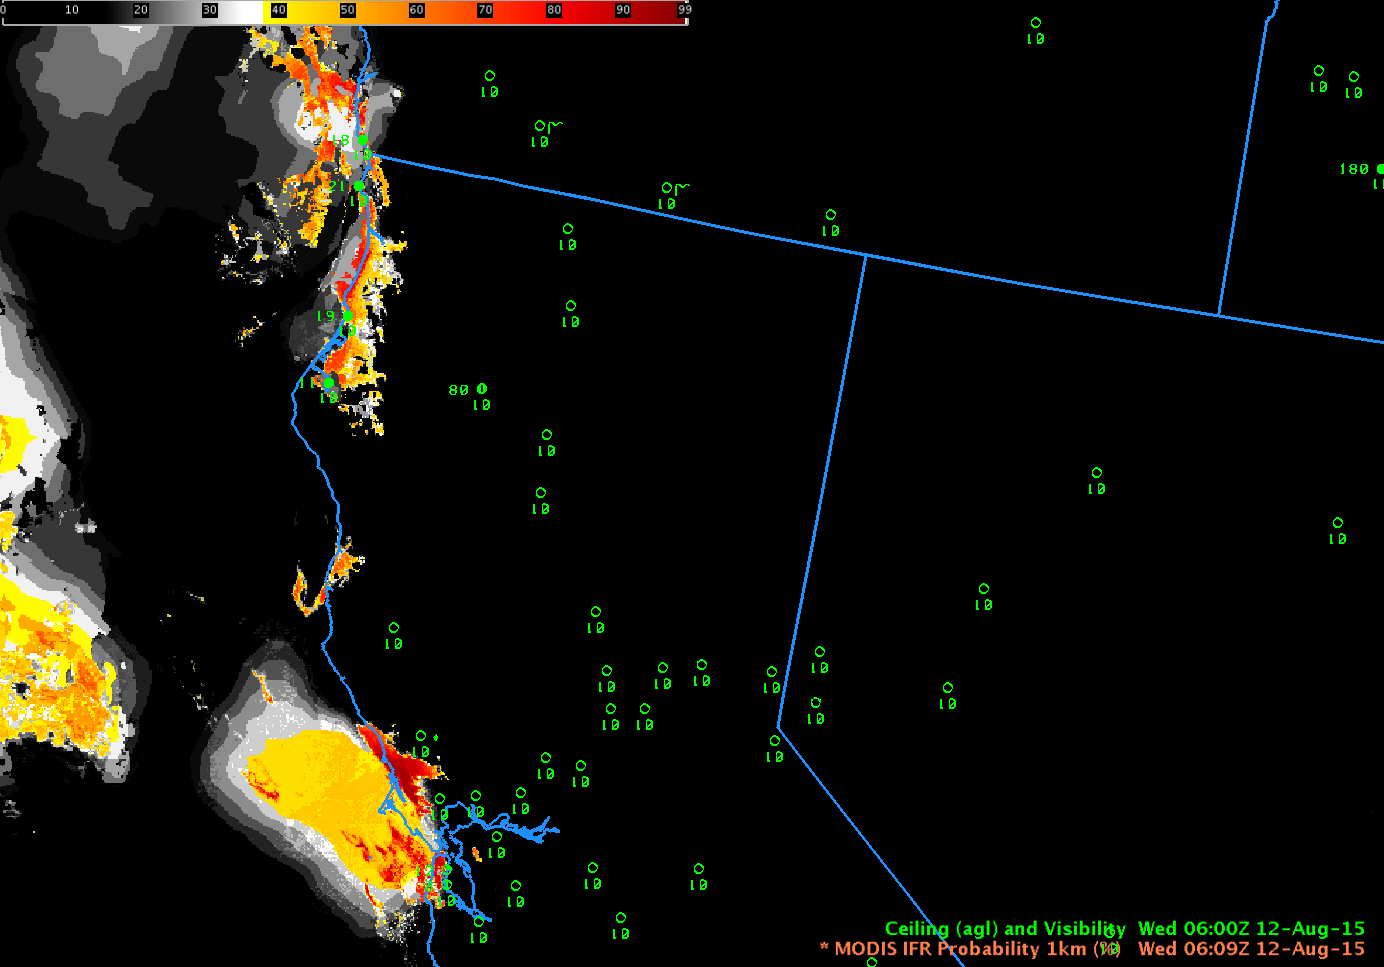
Terra MODIS-based GOES-R IFR Probability fields, 0609 UTC, 12 August 2015 (Click to enlarge)

MODIS_IFR_1023UTC_12August2015

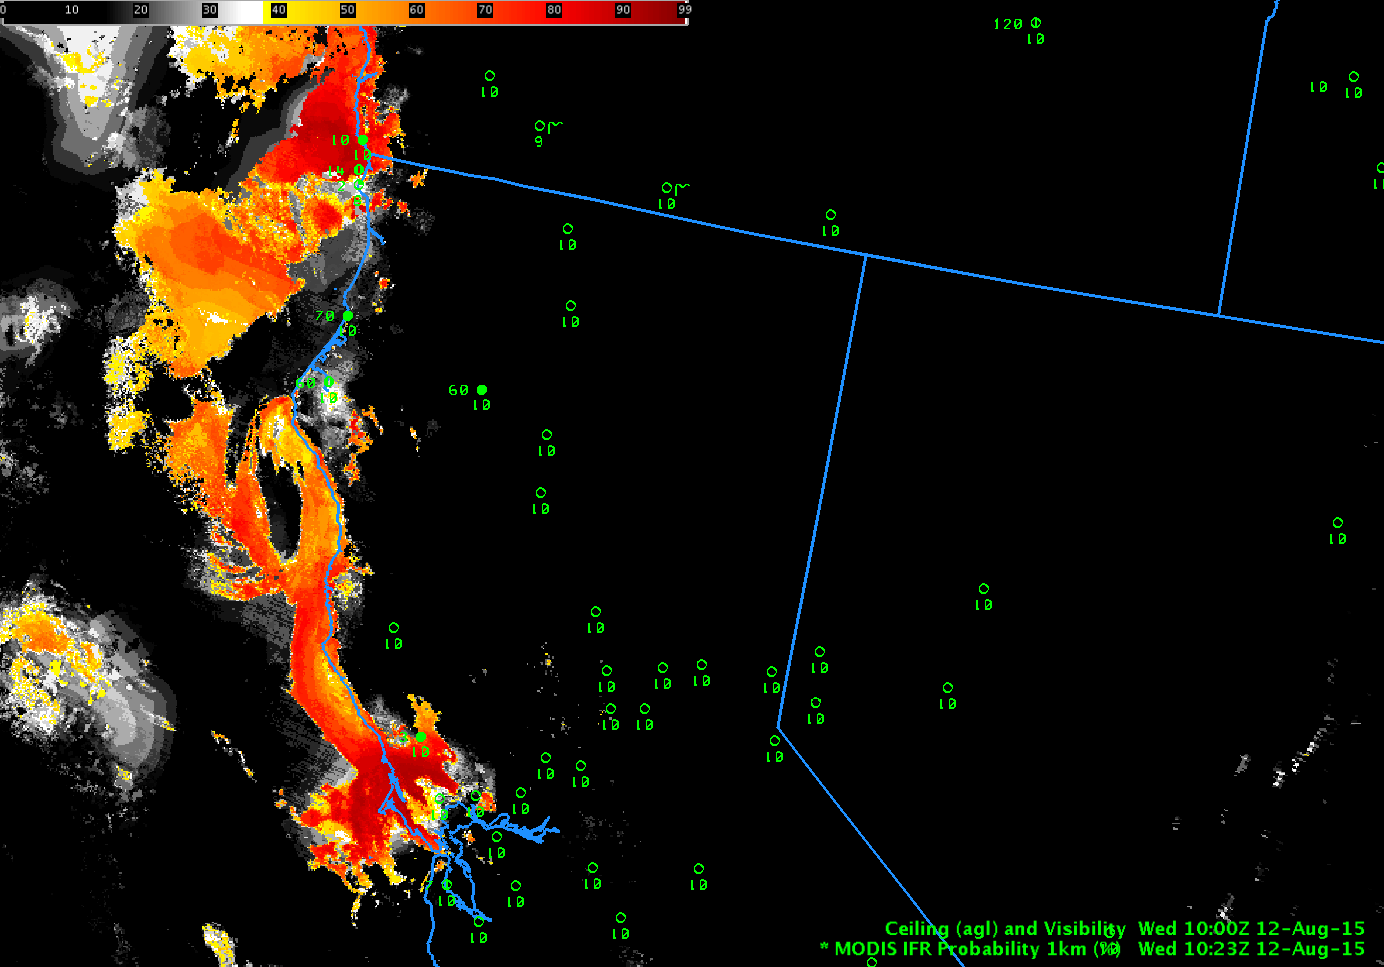
Aqua MODIS-based GOES-R IFR Probability fields, 1023 UTC, 12 August 2015 (Click to enlarge)

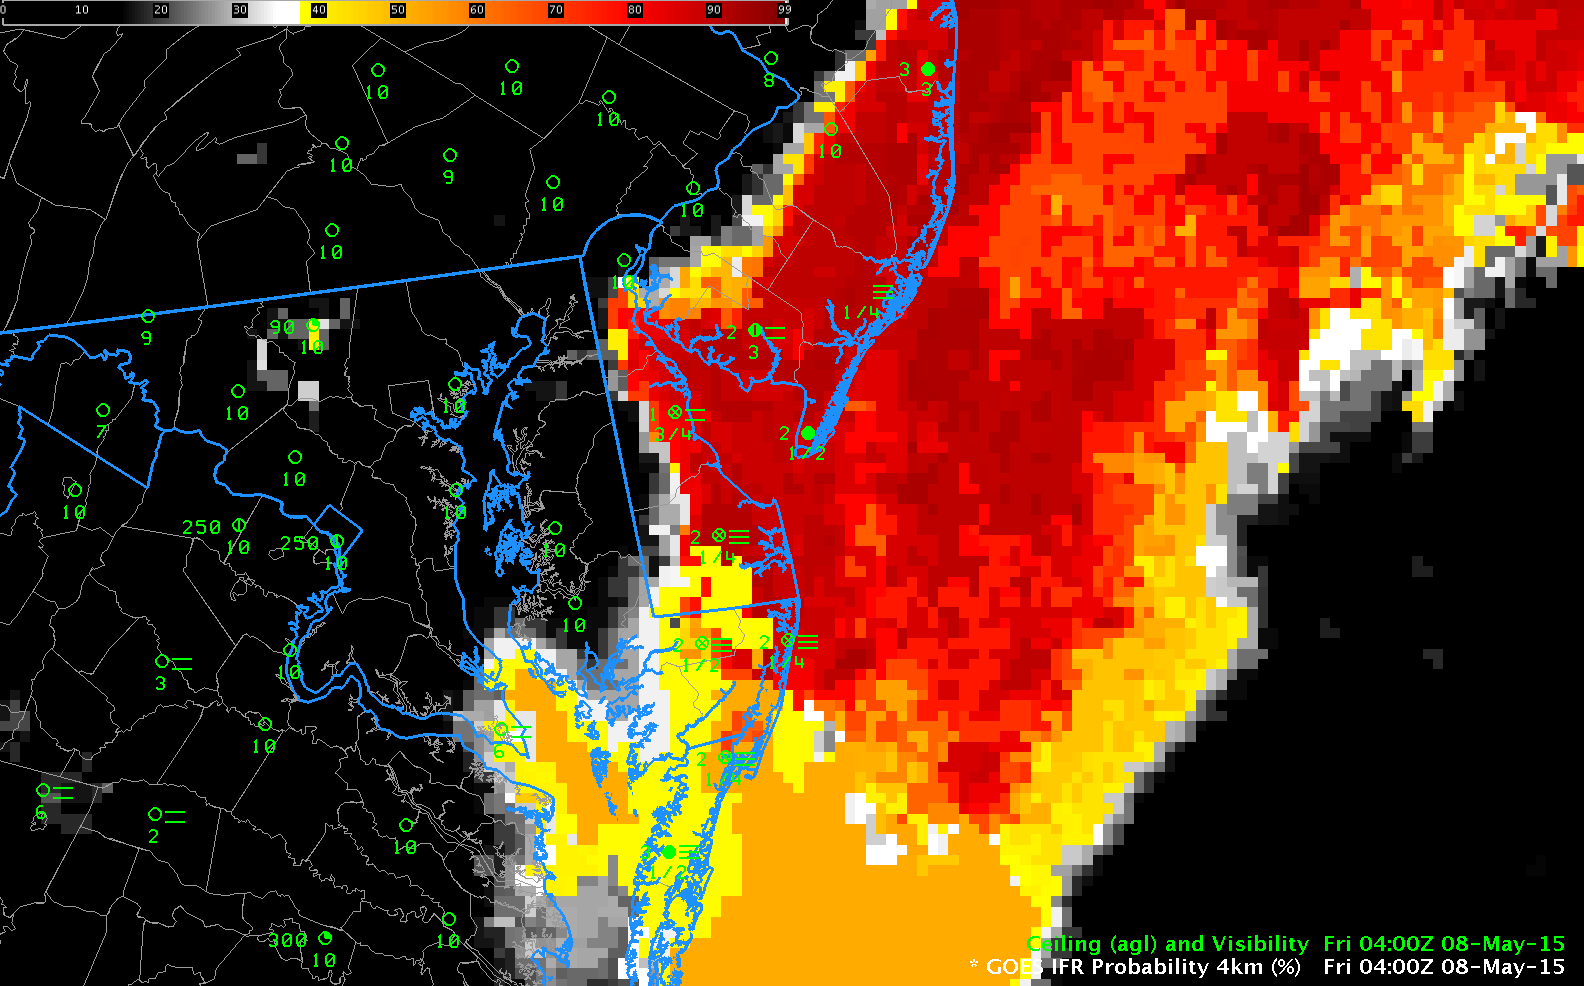
MODIS can give high-resolution imagery, but the infrequency of the scenes tempers its usefulness. In contrast, GOES-15 (as GOES-West) views the California coast every 15 minutes, and this excellent temporal resolution (that will improve in the GOES-R era) allows a better monitoring of the evolution of coastal fog. Hourly plots of GOES-R IFR Probability, below, computed from GOES-15 and Rapid Refresh Data show the slow increase in GOES-R IFR Probabilities along the coast as ceilings and visibilities drop.

GOESWIFR_12August2015_0400_1200anim

GOES-R IFR Probability fields, 0400-1200 UTC 12 August 2015 (Click to enlarge)

In the animation above, note the general increase in GOES-R IFR probabilities at 0900 UTC relative to 0800 and 1000 UTC. We are close enough to the Solstice that Stray Light Issues are starting. The 0800, 0900 and 1000 UTC brightness temperature difference imagery, below, shows the large signal increase at 0900 UTC that can be attributed to stray light. GOES-R IFR Probabilities can tone down that increase somewhat — because the model data will now show low-level saturation in regions where stray light erroneously suggests low clouds/fog might exist. GOES-R IFR Probabilities also screen out the constant fog signal over the Central Valley of California (and over Nevada) that is driven not by the presence of low clouds but by soil emissivity differences.

GOESWBTD_12August2015_0800_0900_1000step

GOES-15 Brightness Temperature Difference (10.7 µm – 3.9 µm), 0800, 0900 and 1000 UTC 12 August 2015 (Click to enlarge)


======================== Added =========================
GOES-14 in SRSO-R mode (see also this link) viewed the west coast starting at 1115 UTC today. The Brightness Temperature Difference field, below, (click here for mp4) shows the slow expansion/evaporation of the low stratus/fog. (GOES-R IFR Probabilities were not computed with the GOES-14 1-minute imagery). The rapid change in the field at sunrise occurs because solar radiation at 3.9 µm quickly changes the brightness temperature difference from negative to positive.

Visible Imagery is below (Click here for mp4).

960x1280_AGOES14_B1_GOES14_W_animated_2015224_133000_182_2015224_170000_182_GRAY

GOES-14 Visible Imagery (1330-1700 UTC) (Click to animate)

Dense Fog in South Carolina and Georgia

DenseFog_4Aug2015

Screenshot from Charleston WFO, 1230 UTC 4 August 2015

GOES_R_IFRP_0400_1215_4Aug2015anim

GOES-R IFR Probability fields computed from GOES-13 and Rapid Refresh Data, hourly from 0400 through 1215 UTC 4 August 2015 (Click to enlarge)

Dense fog developed over the piedmont of South Carolina/Georgia on 4 August 2015 in the wake of departing convection. The GOES-R IFR Probability fields, shown above hourly from 0400 to 1215, do parallel the development of the reduced ceilings and visibilities. Brightness Temperature Difference fields, below, from 0615 to 1215 UTC, do not show a strong fog signal until after 0800 UTC, yet IFR conditions at that time stretch from Walterboro SC (KRBW) southeastward to Eastman GA (KEZM) and Baxley GA (KBHC). GOES-R IFR Probabilities therefore give a better head’s up to a forecaster tasked with monitoring ceilings and visibilities.

GOES_BTD_0615_1215_4Aug2015anim

Suomi NPP overflew the Southeast United States at ~0730 UTC on 4 August. Ample illumination from the waning three-quarter moon showed cloudiness over southeastern coastal South Carolina and adjacent parts of Georgia but the brightness temperature difference field does not suggest that these are all water-based clouds (such clouds generally fall in the yellow or orange part of the enhancement).

SNPP_DNB_0732_04Aug2015

Suomi NPP Day Night Band visible (0.70 µm) image, 0732 UTC 04 August 2015 (click to enlarge)

SNPP_BTD_0732_04Aug2015

Suomi NPP Brightness temperature Difference field (11.45 µm – 3.74 µm), 0732 UTC on 4 August 2015 (click to enlarge)

MODIS data from Terra and Aqua satellites can also be used to compute GOES-R IFR Probability fields, and two MODIS swaths were produced over South Carolina/Georgia early on August 4. Toggles between the 0337 Terra-based GOES-R IFR Probability Field and the 0755 UTC Aqua-based GOES-R IFR Probability fields are below. The larger values from MODIS — especially at 0755 UTC — suggest the fog was initially at small-scale horizontally. The 1-km resolution pixels from MODIS better capture any small-scale features.

GOESMODIS_IFRP_0337_4Aug2015toggle

MODIS-based (Terra) and GOES-based (GOES-13) GOES-R IFR Probability fields at ~0340 UTC on 04 August 2015 (click to enlarge)

GOESMODIS_IFRP_0755_4Aug2015toggle

MODIS-based (Aqua) and GOES-based (GOES-13) GOES-R IFR Probability fields at ~0800 UTC on 04 August 2015 (click to enlarge)

Fog over Iowa

GOESIFR_20July2015_0400_1215anim

GOES-R IFR Probability fields, 0400-1215 UTC, 20 July 2015 (Click to enlarge)

Dense fog developed over portions of eastern Iowa early in the morning of 20 July 2015. The animation above shows the hourly evolution of the GOES-R IFR Probability fields computed using satellite data from GOES-13 and Rapid Refresh model output.  The flat nature of the fields in the animation above suggests the satellite data cannot view the near-surface because of higher level clouds;  Brightness Temperature Difference fields, below, from 0615, 0800 and 1000 UTC confirm that hypothesis.  This was a case where inclusion of the Rapid Refresh information was vital for the IFR Probability field to outline correctly the region of visibility restrictions due to fog. Note that the last GOES-based GOES-R IFR Probability image, at 1215 UTC, above, after sunrise, shows a general increase in values over the 1100 UTC image (just before sunrise). Daytime predictors (used here at 1215 UTC) result in a higher probability of IFR conditions that nighttime predictors (used here at 1100 UTC) in part because of the use of visible data for cloud-clearing.

GOES13_BTD_20July2015_0615_0800_1000step

GOES-13 Brightness Temperature Difference fields (10.7µm – 3.9µm) at 0615, 0800 and 1000 UTC on 20 July 2015 (Click to enlarge)

An Aqua overpass provided MODIS information at ~0830 UTC, and toggle between the brightness temperature difference field (11.0µm – 3.7µm) and MODIS-based IFR Probabilities, below, shows MODIS-based IFR Probabilities were enhanced over southern and eastern Iowa in a region where the brightness temperature difference field gave a signal consistent with mid- and high-level clouds.

MODIS_BTD_IFR_0836_20july2015toggle

Aqua MODIS Brightness Temperature Difference (11.0µm – 3.7µm) and MODIS-based GOES-R IFR Probabilities, ~0830 UTC on 20 July 2015 (Click to enlarge)

Using MODIS and GOES IFR Probabilities to gauge fog motion in the Pacific Northwest

MODIS_FOG_20150706_0547_0958toggle

MODIS-based brightness temperature difference fields, ~0550 and ~1000 UTC on 6 July (Click to enlarge)

MODIS-based Brightness Temperature Difference fields, above, from 0547 (Terra) and 0958 (Aqua) detect a large area of marine stratus over the Pacific Ocean that is penetrating inland up river valleys along the coasts of Washington and Oregon.  Dark reatures that are consistent with higher clouds are also present over southern Oregon. GOES-R IFR Probability fields can be computed from MODIS data, and those fields (below) show high probabilities along the coast, in regions where IFR or near-IFR conditions are observed. Aspects of the GOES-R IFR Probability field deserve comment. Where high clouds are present in the MODIS data, GOES-R IFR Probabilities are largely controlled by model-based fields that are typically smooth. This is the case over the northwest corner of the IFR Probability field, for example, and also off the southern Oregon coast at ~0550 UTC. The blocky nature of the IFR Probability fields off the central Oregon coast at ~0550 UTC is likely related to model relative humidity fields that show saturation both near the surface and aloft.

MODIS_IFR_PROB_20150706_0550_1004toggle

MODIS-based GOES-R IFR Probabilities, ~0550 and ~1000 UTC on 6 July 2015 (Click to enlarge)

Suomi NPP Day Night Band visible imagery had ample illumination early on 6 July with a waning gibbous moon. Imagery below from 1000 UTC (very close to the Aqua pass) also shows thin tendrils of fog moving up river valleys. The VIIRS instrument that provides the Day Night imagery is only on one satellite, however, (compared to MODIS on both Aqua and Terra) so such views are infrequent.

VIIRS_DNB_FOG_20150706_0959toggle

Suomi NPP Day Night Band Visible imagery and Brightness Temperature Difference fields at 0959 UTC, 6 July 2015 (Click to enlarge)

MODIS and Suomi NPP imagery suggest fog is penetrating preferentially into river valleys along the west coast. This should color the interpretation of GOES-based GOES-R IFR Probabilities. GOES-15 lacks the horizontal resolution to resolve fully most river valleys (Rapid Refresh data, similarly, does not resolve small valleys); however, GOES-15 does have excellent temporal resolution, and combining that with the intermittent information from polar orbiters such as Terra, Aqua and Suomi-NPP provides a fuller picture of the evolution of near-surface IFR conditions. The animation of GOES-R IFR Probabilities from GOES-15 is shown below.

GOES_IFR_PROB_20150706_0445_1345anim

GOES-15 based GOES-R IFR Probabilities, 0445-1345 UTC, 6 July 2015 (Click to enlarge)

MODIS-based vs. GOES-based IFR Probabilities

The CIMSS Satellite Blog shows a case on July 2nd 2015 of Day Night Band detection of river valley fog over the upper midwest. River Valley fog is a challenge for GOES detection because of the large pixel footprint. So how did it do in this case, and how does that compare to MODIS-based detection? The animation below shows the three MODIS scenes during fog development that occurred. MODIS-based IFR Probability at 0432 UTC (from Terra) hints at the development of fog over the Wisconsin and Kickapoo Rivers over southwestern WI. GOES-based IFR Probability from 0430 UTC (shown below the MODIS data) shows no signal there. GOES-based IFR Probabilities do appear at 0715 UTC, however. The MODIS-based signal has given any forecaster an early alert to the development of fog over the River valleys. (Toggles between GOES and MODIS-based IFR Probabilities are available for 0430 UTC, 0715 UTC and 0845 UTC). Note that both 0710 and 0848 UTC MODIS-based fields (from Aqua) have a geometry such that the Mississippi River valley is near the edge, and artifacts related to the so-called bow-tie effect are present as repeated features in the field. Nevertheless, the MODIS-based field correctly limits the fog to the River Valleys and shows very high IFR Probabilities; GOES-based pixels fail to resolve narrow river valleys.

MODIS_IFR_PROB_20150702_0432_0848anim

MODIS-based GOES-R IFR Probabilities, 0432, 0710 and 0848 UTC on 2 July 2015 (Click to enlarge)

GOES_IFR_PROB_20150702_0430_0845anim

GOES-based GOES-R IFR Probabilities, 0430, 0715 and 0845 UTC on 2 July 2015 (Click to enlarge)

An animation of GOES-based IFR Probabilities, below, suggests that GOES data identified the likelihood of IFR conditions starting around 0515 UTC, almost 45 minutes after the higher-resolution MODIS pass at 0432 UTC.

GOES_IFR_PROB_20150702_0430_0545anim

GOES-based GOES-R IFR Probabilities, 0430 – 0545 UTC on 2 July 2015 (Click to enlarge)

Dense Fog over Iowa and Illinois


DVN_29June2015

Front page of the National Weather Service in the Quad Cities, Monday morning 29 June 2015 (Click to enlarge)

Dense fog developed over the mid-Mississippi Valley early on Monday, 29 June 2015, and Dense Fog Advisories were hoisted by the DVN WFO, as shown above. How did the GOES-IFR Probabilities (and other products) capture this event? The animation below shows the evolution of surface visibilities at 0600, 0800 and 1000 UTC. IFR Conditions have developed by 0600 UTC and they subsequently expand.

VIS_IA_0600_1000_29JUNE2015anim

Surface Visibilities (Statute Miles) over Iowa, 0600, 0800 and 1000 UTC, 29 June 2015. IFR Conditions are highlighted in white (Click to enlarge)

The Day Night band suggests clouds are present over parts of Iowa at 0707 UTC, but the waxing gibbous moon has set by 0848 UTC (below), and the lack of reflected moonlight at the later time precludes cloud detection. The brightness temperature difference (11.45µm – 3.74µm) from Suomi NPP can detect the tops water-based low clouds and it does confirm that the clouds have not vanished at 0848 UTC despite the lack of signal in the Day Night band. The brightness temperature difference field includes signals (black in the enhancement used) that suggest the presence of cirrus clouds.

VIIRS_DNB__REF_20150629_toggle_0707_0848

Visible Imagery from the Suomi NPP Day Night Band, 0707 and 0848 UTC on 29 June 2015 (Click to enlarge)

VIIRS_FOG_20150629_toggle_0707_0848

Suomi NPP Brightness Temperature Difference (11.45µm – 3.74µm) at 0707 UTC and 0848 UTC (Click to enlarge)

MODIS data can be used to compute IFR Probability fields. These fields are not available frequently, although they do present a high-resolution view of events when available. Two overpasses, at 0408 (Terra) and 0817 (Aqua), provided imagery early on 29 June. The MODIS data suggests the development of a large area of fog. What does GOES data show? Click here for a comparison of MODIS and GOES at 0408 UTC, and here for a comparison of MODIS and GOES at 0817 UTC). The chief difference between MODIS and GOES is somewhat higher values at the earlier time, and sharper edges (as might be expected given the resolution differences) at both times.

MODIS_IFR_PROB_20150629_0408_0817toggle

MODIS-based GOES-IFR Probabilities, 0408 and 0817 UTC on 29 June 2015 (Click to enlarge)

GOES-R IFR Probabilities computed from GOES-13 have a temporal resolution that allows for monitoring of fog development, and values increase rapidly after 0500 UTC over eastern Iowa, in accord with the development of IFR observations shown above. Brightness Temperature Difference fields (bottom) also suggest the development of low clouds over Iowa. However, there are places where high clouds prevent a signal and the rising sun (and its 3.9 µm radiation) mean the signal is reduced at the end of the animation. GOES-R IFR Probabilities maintain a coherent signal through sunrise.

GOES_IFR_PROB_20150629_0400_1215anim

GOES-based GOES-R IFR Probabilities, 0400-1215 UTC on 29 June 2015 (Click to enlarge)

Reg_11-3.9_Sat_20150629_0400_1215anim

GOES-13 Brightness Temperature Difference (10.7 µm – 3.9 µm), 0400-1215 UTC, 29 June 2015 (Click to enlarge)

Resolution Matters

MODIS_GOES_IFR_PROB_20150622_1000toggle

GOES-R IFR Probabilities computed from MODIS data and from GOES-15 data, ~1000 UTC on 22 June 2015 (Click to enlarge)

GOES-R IFR Probability was created with an eye towards using data from GOES-R (currently scheduled for launch at the end of March 2016). GOES-R will have better spatial, temporal and spectral resolution than the present GOES. A benefit of better spatial resolution is shown in the toggle above between present GOES (nominal 4-km resolution — vs. the nominal 2-km resolution that will be on GOES-R) and MODIS (1-km resolution). The small valleys along the northern California coastline are far better resolved. The fog/low clouds over San Francisco bay is also better resolved (and the same could be said for the Salinas Valley, south of Monterey Bay if this scene were shifted slightly south). (You might notice a slight 1-pixel shift between MODIS and GOES-15 IFR Probabilities. GOES-15 navigation is compromised by the lack of star-tracking data, so MODIS data are probably better navigated.)

US_11-3.9_IFRPROB_20150622_0955toggle

GOES-15 Brightness Temperature Difference (10.7 µm – 3.9 µm) and GOES-R IFR Probabilities, 1000 UTC on 22 June 2015 (Click to enlarge)

IFR Probabilities are derived from GOES-15 brightness temperature difference fields, and a benefit of the IFR Probabilities is obvious above. Brightness Temperature Differences can be driven by emissivity differences in soil. These false positives over Nevada (from the point of view of fog detection) are easily removed if the Model Data does not show low-level saturation.

VIIRS_3.74_BTD_DNB_20150622_0921

Suomi NPP Day/Night band imagery, Brightness Temperature Difference Fields (11.45 µm – 3.74 µm), and 3.74 µm Image, 0921 UTC on 22 June 2015 (Click to enlarge)

Suomi/NPP’s early morning overpass also detected the presence of fog/low stratus over the valleys along the northern California coast. The Brightness Temperature Difference field shows things distinctly. The Day-Night Visible imagery shows little in the way of fog on this day, as the waxing crescent moon had already set so no lunar illumination was present. The Day Night band is included here because it shows a very bright wildfire south of Lake Tahoe. That feature is also present in the 3.74 µm imagery. Fog and stratus is also evident in the 3.74 µm imagery, detectable based on its very smooth appearance.

Fog along the East Coast

GOESIFR_8May2015anim

GOES-R IFR Probability Fields computed from GOES-East and Rapid Refresh Data, hourly from 2300 7 May through 1200 8 May, and surface observations of ceilings/visibility (Click to enlarge)

GOES-R IFR Probability Fields showed large values at sunset over the Atlantic Ocean east of New Jersey and the Delmarva Peninsula. As night progressed, that fog penetrated inland. The IFR Probability field accurately depicts the region where visibilities due to fog were reduced. The 0400 UTC image in the animation above (reproduced below), has qualities that highlight the benefit of a fused product. The Ocean to the east of the southern Delmarva peninsula is overlain with multiple cloud layers that make satellite detection of low clouds/fog problematic. In this region, satellite data cannot be used as a predictor and the GOES-R IFR Probability field is a flat field. Because the GOES-R IFR Probability product includes information from the Rapid Refresh model (2-3 hour model forecasts, typically) and because saturation is indicated in the lowest 1000 feet of the model, IFR Probabilities over the ocean are high in a region where satellite data cannot be used as a predictor.

GOESIFR_8May2015-29

As above, but for 0400 UTC 8 May 2015 only (Click to enlarge)

GOES-R IFR Probabilities can also be computed using MODIS data, which data has better spatial resolution than GOES (1-km vs. nominal 4-km). The toggle below of the MODIS brightness temperature difference and the GOES-R IFR Probability shows a very sharp edge to the expanding fog field over New Jersey.

MODISIFR_BTDtoggle_0249_08May2015

MODIS Brightness Temperature Difference (11µm – 3.9µm) and MODIS-based GOES-R IFR Probabilities, ~0250 UTC on 8 May, 2015 (Click to enlarge)

The Gulf Stream is apparent in the Brightness Temperature Difference field above and IFR Probabilities are high over the ocean between the coast and the Gulf Stream. In the absence of observations, how much should those high IFR Probabilities be believed. There is high dewpoint air (mid-50s Fahrenheit) along the East Coast at this time, and advection fog could be occurring, for example. Suomi NPP also overflew the region shortly after midnight. The toggle below, of brightness temperature difference and the Day Night Band confirms the presence of (presumably) low clouds over the cold Shelf Water of the mid-Atlantic bight.

SNPPDNB_BTDtoggle_0643_08May2015

Suomi NPP Brightness Temperature Difference (11.35 µm – 3.74 µm) and Suomi NPP Day Night Band Visible Imagery (0.70 µm) at night, 0643 UTC on 8 May, 2015

Dense Fog over the Red River of the North

Dense Fog advisories were issued by the National Weather Service in Grand Forks as visibilities in the WFO dropped to near zero. How did the IFR Probability Fields and traditional Brightness Temperature Difference Fields capture this event? The animation below shows the brightness temperature difference field (10.7 µm – 3.9 µm) from GOES-13. Initially, a swath of mid-level and upper-level clouds covered the Red River Valley (this system had produced very light rains on Monday the 27th), but the clouds moved east and dense fog quickly developed (Cavalier, ND, for example, showed reduced visibility already at 0400 UTC).

Reg_11-3.9_Sat_20150428_03_11

GOES-13 Brightness Temperature Difference (10.7 µm – 3.9 µm) hourly from 0315 to 1115 UTC on 28 April 2015, along with surface plots of ceilings and visibility (Click to enlarge)

The IFR Probability fields for the same time, below, better capture the horizontal extent of the fog.  For example, the strong signal in the Brightness Temperature Difference field over South Dakota at the end of the animation, above, is not present in the IFR Probability fields.  IFR Conditions are not occurring over South Dakota.  The good match between the developing IFR Probability fields and the developing fog testifies to the satellite view of the fog and the accurate simulation of this event by the Rapid Refresh model.

GOES_IFR_PROB_20150428_03_11

GOES-R IFR Probability Fields hourly from 0315 to 1115 UTC on 28 April 2015, along with surface plots of ceilings and visibility (Click to enlarge)

Geostationary GOES fields give good temporal resolution to the evolving field. Polar orbiting satellites, such as Suomi NPP (carrying the VIIRS instrument) and Terra/Aqua (each carrying MODIS) each gave snapshot views of the developing fog. At 0355, IFR Probabilities are low, and the Red River valley is mostly obscured by higher clouds. Four hours later, at 0805 UTC, dense fog has developed and IFR probabilities are large.

MODIS_FOG_IFR_PROB_20150428_0355

Terra MODIS Brightness Temperature Difference (11µm – 3.9µm) and IFR Probability fields, ~0355 UTC on 28 April 2015 (Click to enlarge)

MODIS_FOG_IFR_PROB_20150428_0805

Aqua MODIS Brightness Temperature Difference (11µm – 3.9µm) and IFR Probability fields, ~0805 UTC on 28 April 2015 (Click to enlarge)

Suomi NPP also viewed the fog field. The toggle between the Day Night Band and the Brightness Temperature Difference field (11.45µm – 3.74µm), below, shows evidence of fog in the visible Day Night band imagery.  The lights of western North Dakota’s oil shale fields are also evident.

Polar-orbiting satellites give excellent high-resolution imagery of fog fields. When used in concert with the excellent time resolution of GOES imagery, a complete picture of the evolving fog field can be drawn.

SNPP_DNB_BTD_0815UTC_28April2015

Toggle between Day Night Band (0.70 µm) and Brightness Temperature Difference (11.45µm – 3.74µm) field from VIIRS on Suomi NPP at 0815 UTC (Click to enlarge)

GOES and MODIS IFR Probabilities over Alaska

MODIS_GOES_IFRPROB_0700_14Apr15

GOES-R IFR Probabilities computed from MODIS and from GOES-15, both at ~0700 UTC on 14 April 2015 (Click to enlarge)

At very high latitudes, limb effects can alter the brightness temperature difference between 10.7 µm and 3.9 µm. GOES also has very large pixel sizes at high latitudes. The image above toggles between the GOES-R IFR Probability computed using MODIS and GOES-15. Observations — scant over Alaska — of ceilings and observations are superimposed on the imagery. GOES-based GOES-R IFR Probabilities are elevated over much of Alaska; in contrast, MODIS-based IFR Probabilities show larger values in only a few regions.

MODIS-based values at high latitudes are available frequently compared to lower latitudes. At 0830/0845 UTC, below, MODIS data show a slow expansion in values (note that eastern Alaska was not viewed by MODIS at this time). At about 1100 UTC, the slow areal increase in IFR Probabilities continues.

MODIS_GOES_IFRPROB_0830_14Apr15

GOES-R IFR Probabilities computed from MODIS and from GOES-15, both at ~0830 UTC on 14 April 2015 (Click to enlarge)

MODIS_GOES_IFRPROB_1100_14Apr15

GOES-R IFR Probabilities computed from MODIS and from GOES-15, both at ~1100 UTC on 14 April 2015 (Click to enlarge)

The 1100 UTC MODIS pass was over only eastern Alaska, and it shows relatively large values in some spots of northeastern Alaska. The high values from the GOES-based GOES-R IFR Probabilities over central Alaska can probably be discounted. Note, however, that the highest GOES-based GOES-R IFR Probabilities do have a counterpart in the MODIS-based field.

At 1400 UTC, no MODIS pass was available. The GOES-based image, below, again has large values over northern Alaska (with corroborating surface observations at Point Lay (where snow is falling) and at Atqasuk (where freezing fog is reported).  MODIS-based data from earlier in the day adds confidence to the discounting of widespread modest (40-50%) IFR Probability values over central Alaska.

GOESIFRPROB_1400_14Apr15

GOES-R IFR Probabilities computed from GOES-15 at 1400 UTC on 14 April 2015 (Click to enlarge)