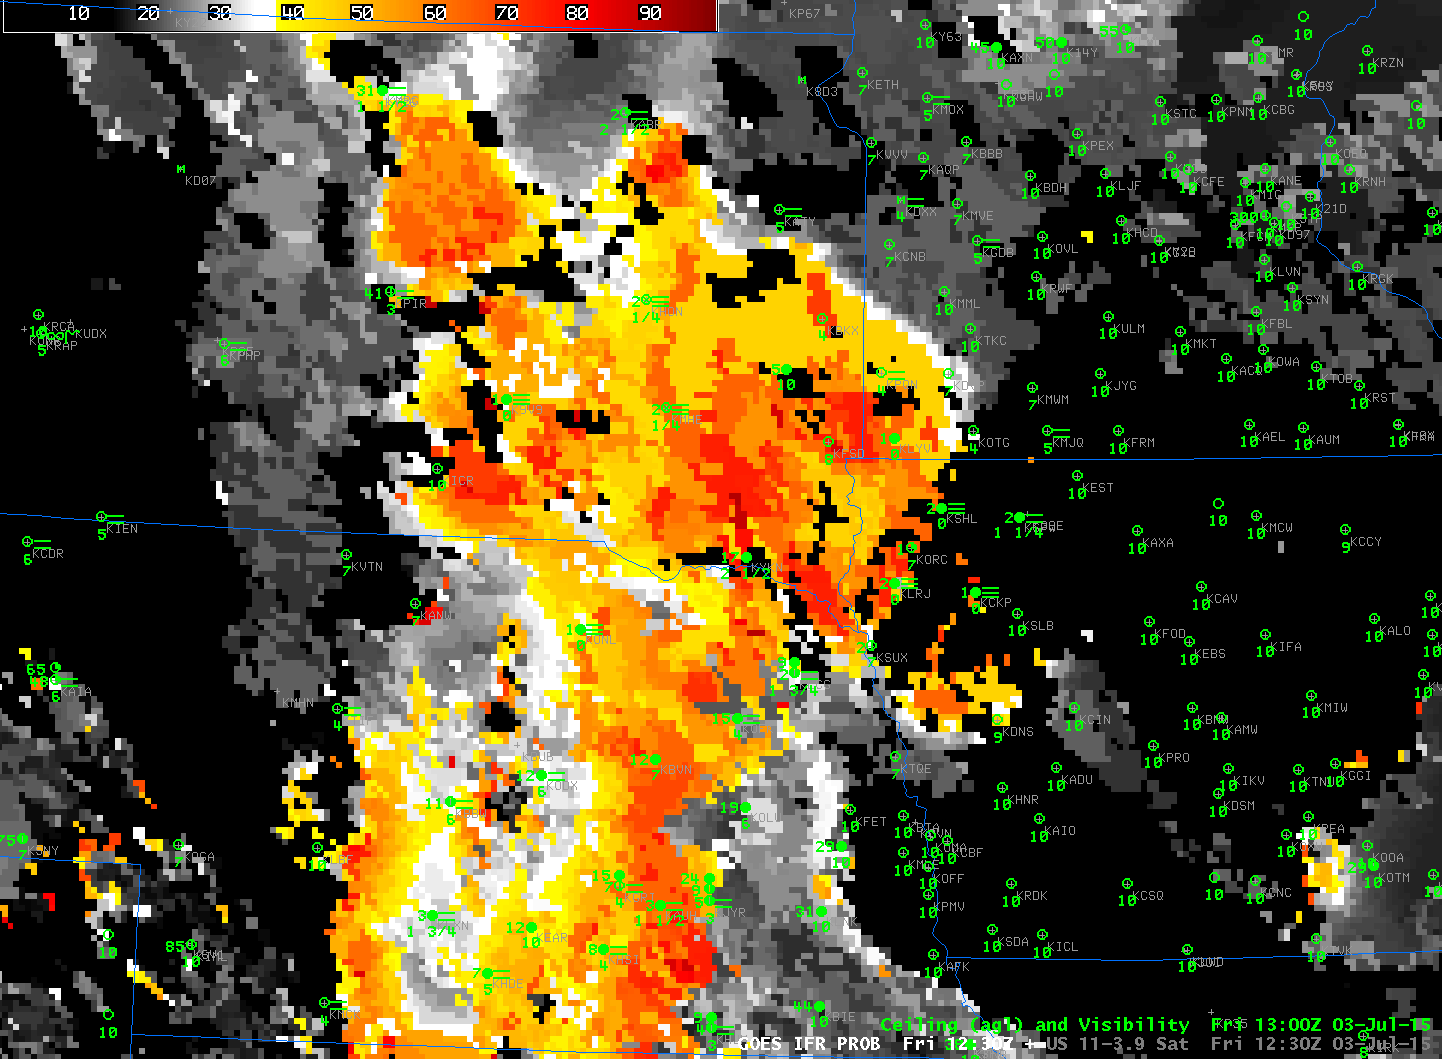
GOES-R IFR Probability Fields, hourly from 0700 through 1300 UTC, 30 July 2015 (Click to enlarge)
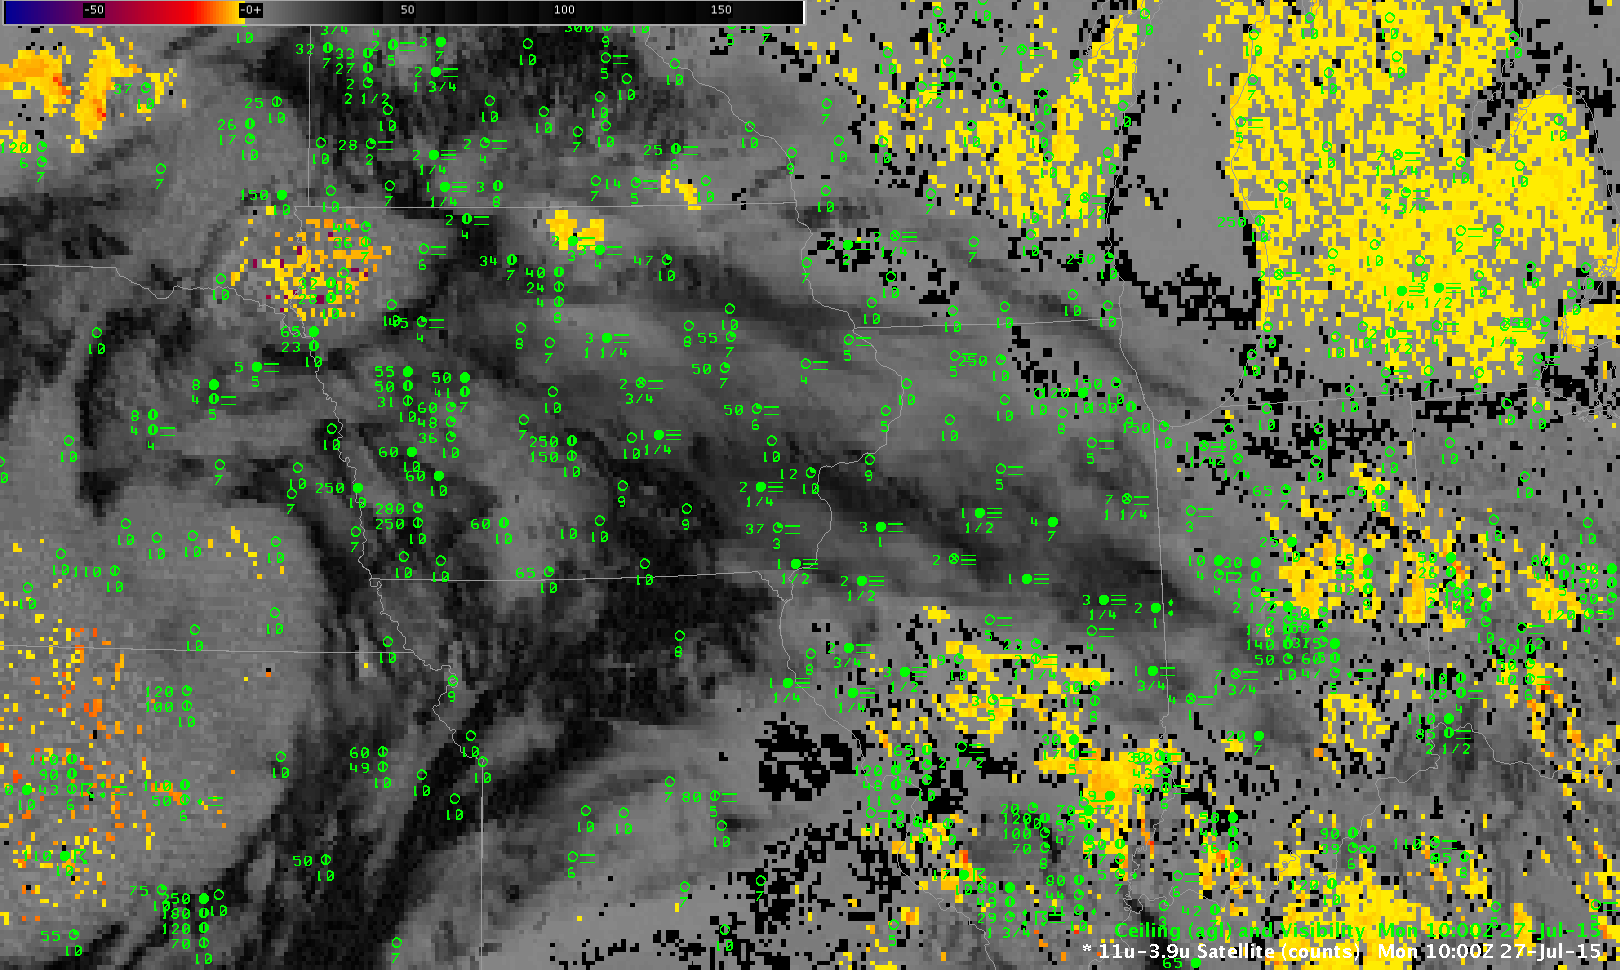
Dense Fog Advisories were issued over inland south Texas on the morning of Thursday 30 July (below). GOES-R IFR Probabilities of this event, above, capture the development of IFR conditions after 0700 UTC (2 AM CDT). Values are quite small until about 0900 UTC, as IFR conditions develop around Alice, TX and Orange Grove Naval Air Station (in Jim Wells County) and then expand. Comparing the GOES-R IFR Probability fields, above, and the GOES-13 Brightness Temperature Difference fields, below, suggest that the model component in the IFR Probability fields showed low-level saturation occurring a bit farther north than the initial strongest pixel returns in the Brightness Temperature Difference fields. For example, compare this toggle of GOES-R IFR Probability and GOES-13 Brightness Temperature Difference fields at 0800 UTC: Larger values of GOES-R IFR Probability (albeit still small — around 20%) are shifted north of the strongest enhancements in the 0800 Brightness Temperature Difference fields, which stronger enhancements are mostly near the Rio Grande). The toggle for 1000 UTC is here.
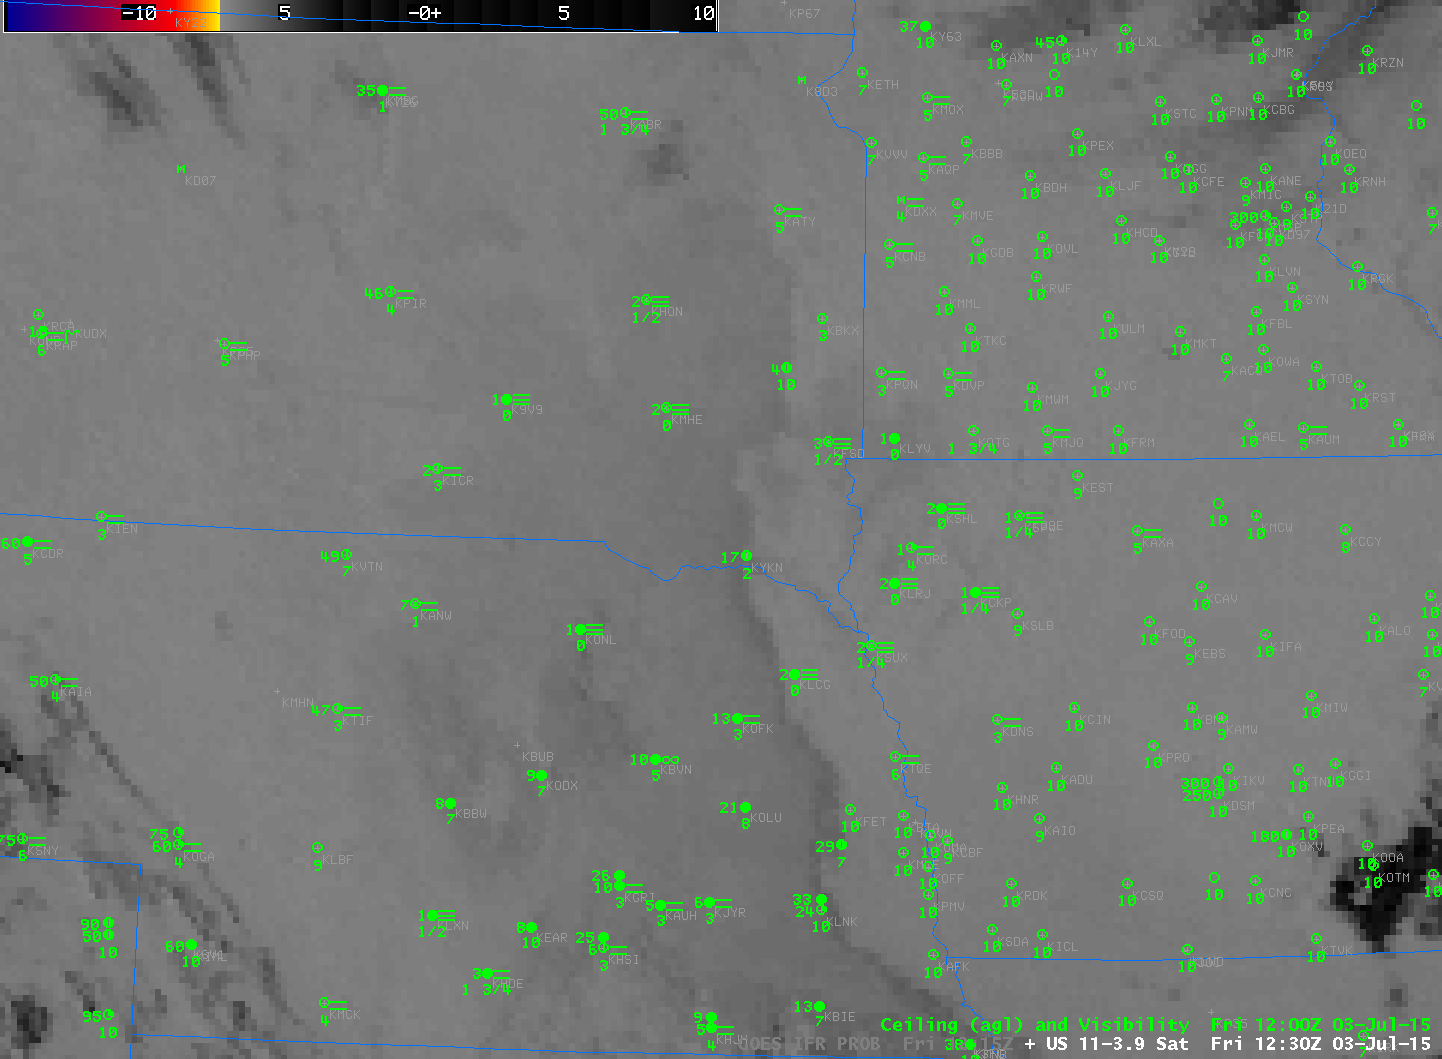
GOES-13 Brightness Temperature Difference (10.7µm – 3.9µm) Fields, hourly from 0700 through 1300 UTC, 30 July 2015 (Click to enlarge)
URGENT – WEATHER MESSAGE
NATIONAL WEATHER SERVICE BROWNSVILLE TX
612 AM CDT THU JUL 30 2015
…AREAS OF DENSE FOG CONTINUE TO DEVELOP ACROSS NORTHERN
RANCHLANDS THIS MORNING…
.CLEAR SKIES AND CALM WINDS CONTINUE TO ALLOW AREAS OF DENSE FOG
TO DEVELOP ACROSS NORTHERN PORTIONS OF DEEP SOUTH TEXAS THIS
MORNING. VISIBILITIES WILL BE REDUCED TO A QUARTER OF A MILE IN
AREAS OF DENSE FOG.
TXZ249-250-301400-
/O.NEW.KBRO.FG.Y.0016.150730T1112Z-150730T1400Z/
JIM HOGG-BROOKS-
INCLUDING THE CITIES OF…HEBBRONVILLE…FALFURRIAS
612 AM CDT THU JUL 30 2015
…DENSE FOG ADVISORY IN EFFECT UNTIL 9 AM CDT THIS MORNING…
THE NATIONAL WEATHER SERVICE IN BROWNSVILLE HAS ISSUED A DENSE
FOG ADVISORY…WHICH IS IN EFFECT UNTIL 9 AM CDT THIS MORNING.
* VISIBILITY…VISIBILITIES WILL BE REDUCED TO A QUARTER OF A
MILE.
* IMPACTS…DRIVING WILL BE DIFFICULT ON STREETS AND ROADS
ESPECIALLY IN RURAL AREAS.
PRECAUTIONARY/PREPAREDNESS ACTIONS…
MOTORISTS SHOULD SLOW DOWN…USE LOW BEAM HEADLIGHTS…AND
MAINTAIN A SAFE DISTANCE BETWEEN VEHICLES.
&&
$$
CASTILLO
URGENT – WEATHER MESSAGE
NATIONAL WEATHER SERVICE CORPUS CHRISTI TX
757 AM CDT THU JUL 30 2015
…DENSE FOG THIS MORNING OVER EASTERN PORTIONS OF THE RIO GRANDE
PLAINS…
.THE COMBINATION OF NEAR SURFACE MOISTURE…DRY AIR ALOFT…AND
LIGHT WIND…HAS RESULTED IN AREAS OF DENSE FOG OVER THE SOUTHERN
COASTAL BEND AND OVER EASTERN PORTIONS OF THE RIO GRANDE PLAINS
EARLY THIS MORNING. HOWEVER…CONDITIONS WILL IMPROVE BY MID
MORNING AS TEMPERATURES INCREASE SUFFICIENT TO RESULT IN
UNSATURATED CONDITIONS NEAR THE SURFACE.
TXZ230>232-240-241-301500-
/O.EXT.KCRP.FG.Y.0018.000000T0000Z-150730T1500Z/
MCMULLEN-LIVE OAK-BEE-DUVAL-JIM WELLS-
INCLUDING THE CITIES OF…CALLIHAM…CROSS…LOMA ALTA…TILDEN…
GEORGE WEST…THREE RIVERS…BEEVILLE…FREER…BENAVIDES…
SAN DIEGO…ALICE…ORANGE GROVE
757 AM CDT THU JUL 30 2015
…DENSE FOG ADVISORY NOW IN EFFECT UNTIL 10 AM CDT THIS
MORNING…
* VISIBILITY…ONE-QUARTER MILE OR LESS
* IMPACTS…DENSE FOG WILL RENDER DRIVING HAZARDOUS.
PRECAUTIONARY/PREPAREDNESS ACTIONS…
A DENSE FOG ADVISORY MEANS VISIBILITIES WILL FREQUENTLY BE
REDUCED TO LESS THAN ONE QUARTER MILE. IF DRIVING…SLOW DOWN…
USE LOW-BEAM HEADLIGHTS…AND LEAVE PLENTY OF DISTANCE AHEAD OF
YOU.
&&
$$
PZ
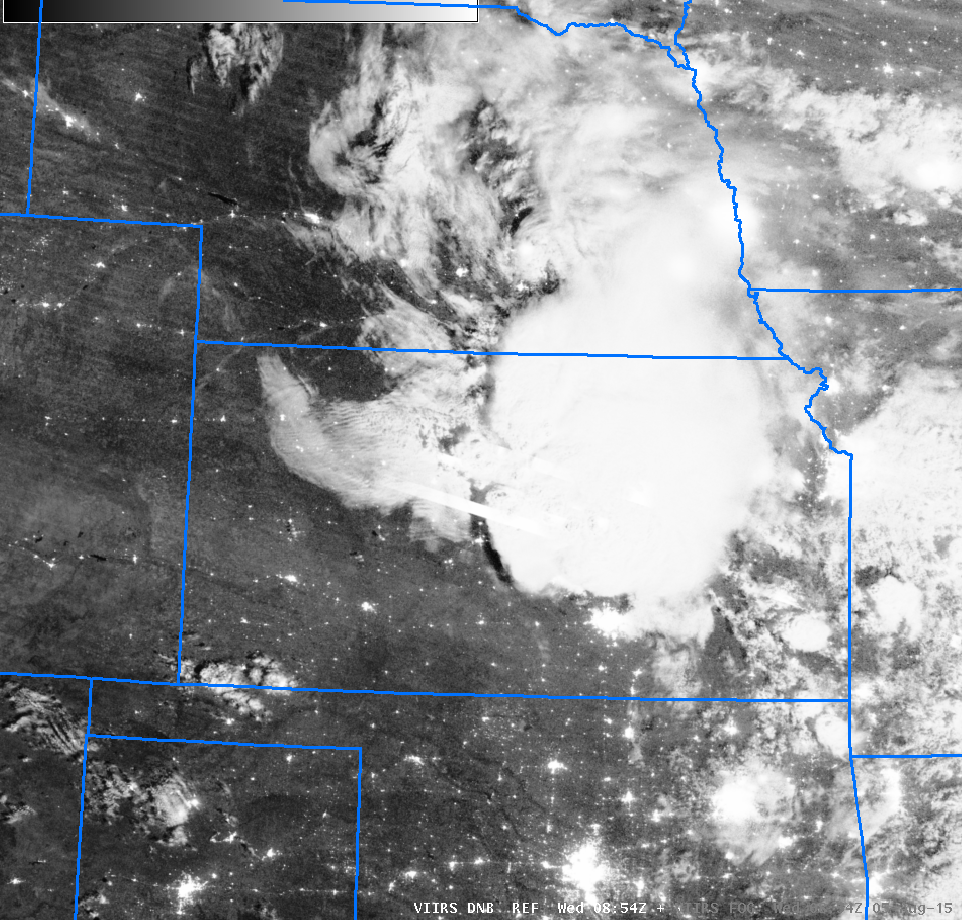
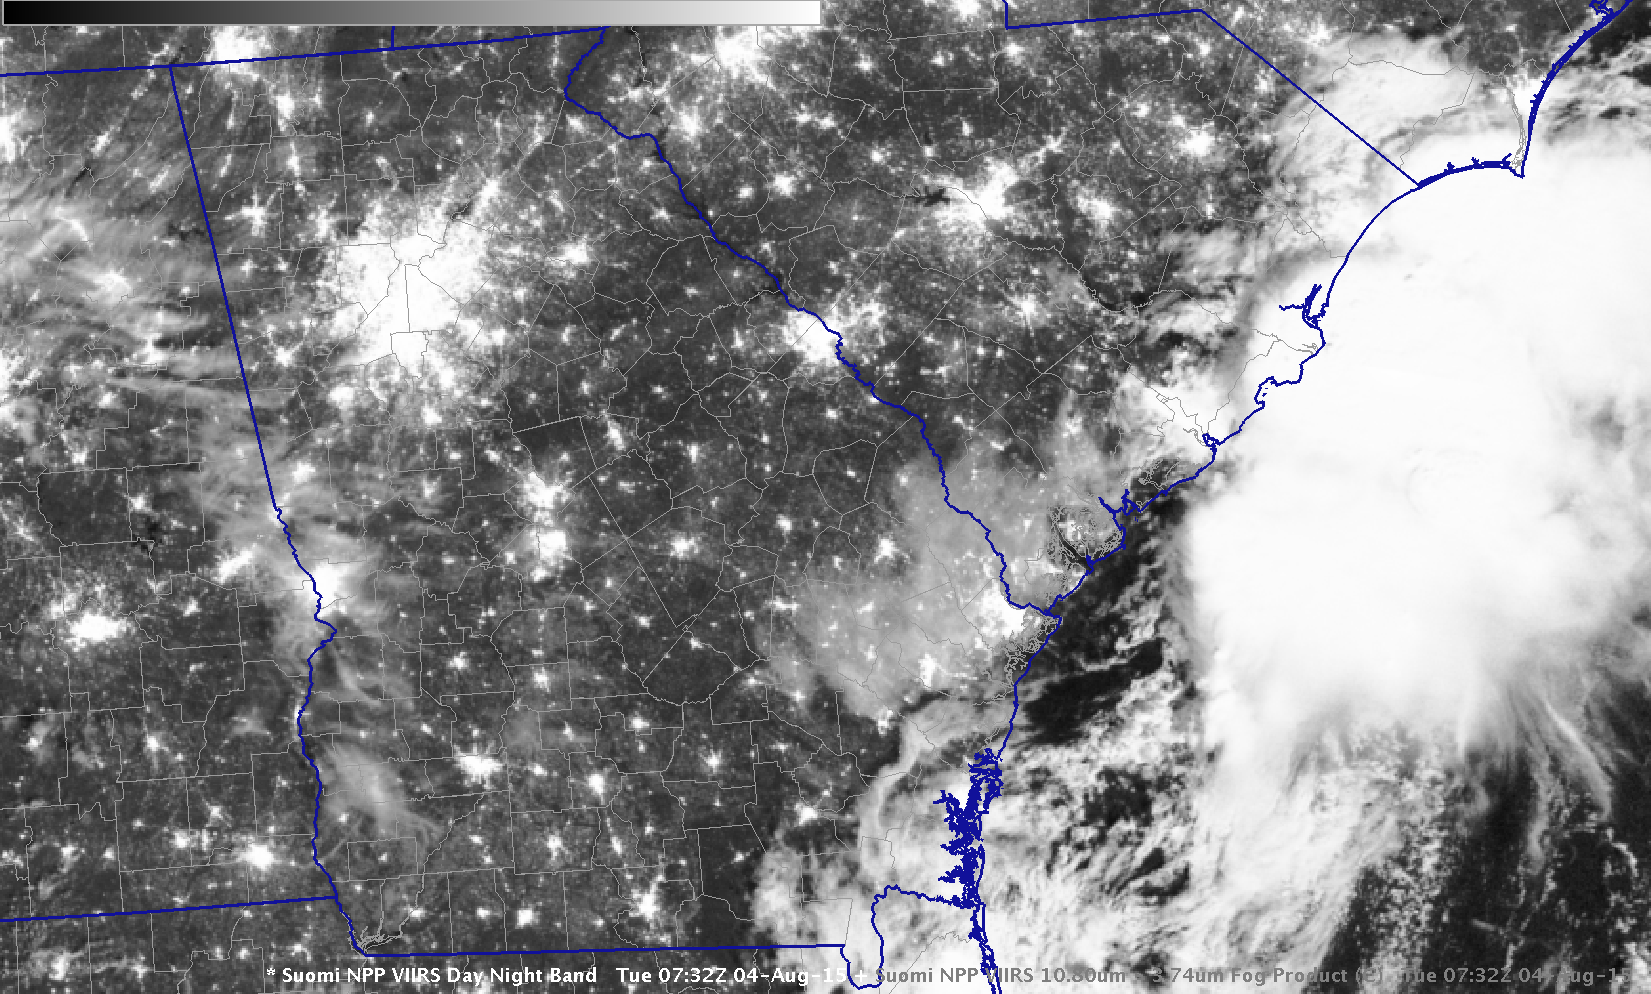
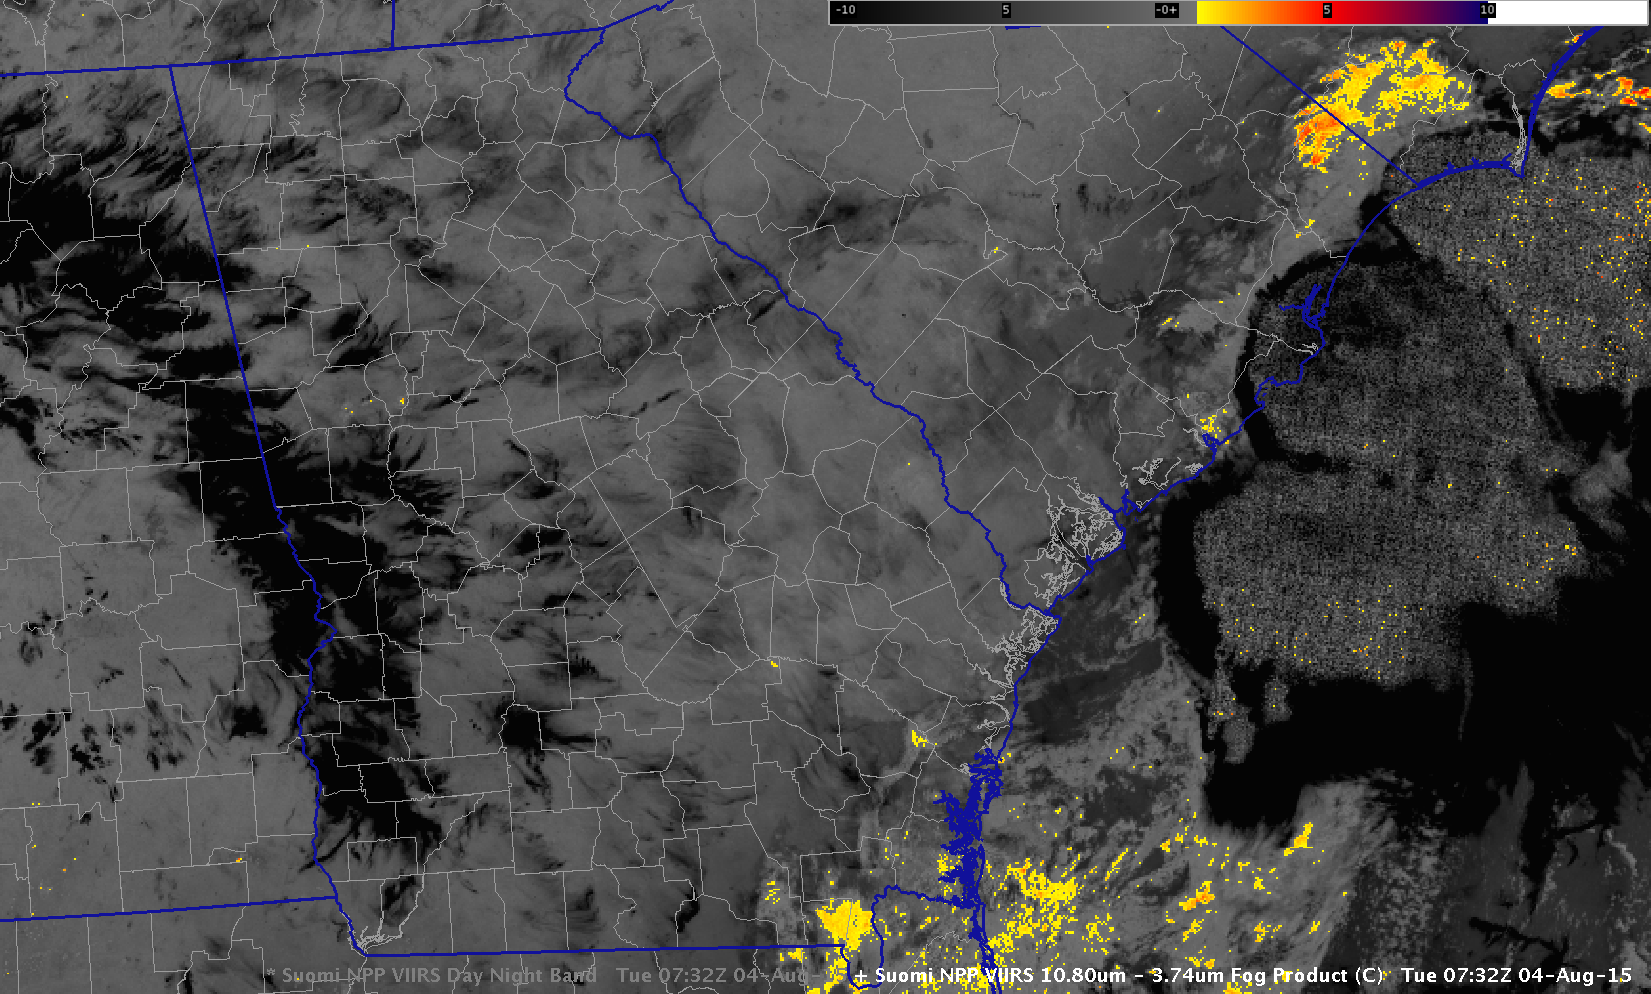
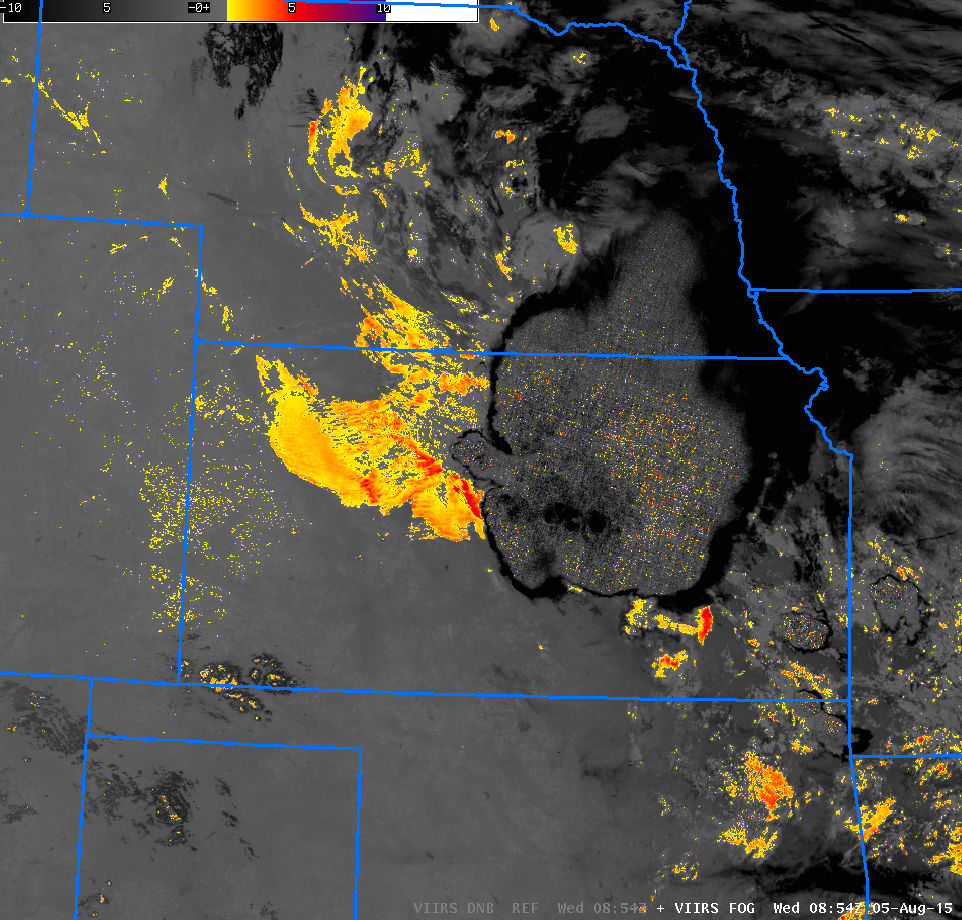
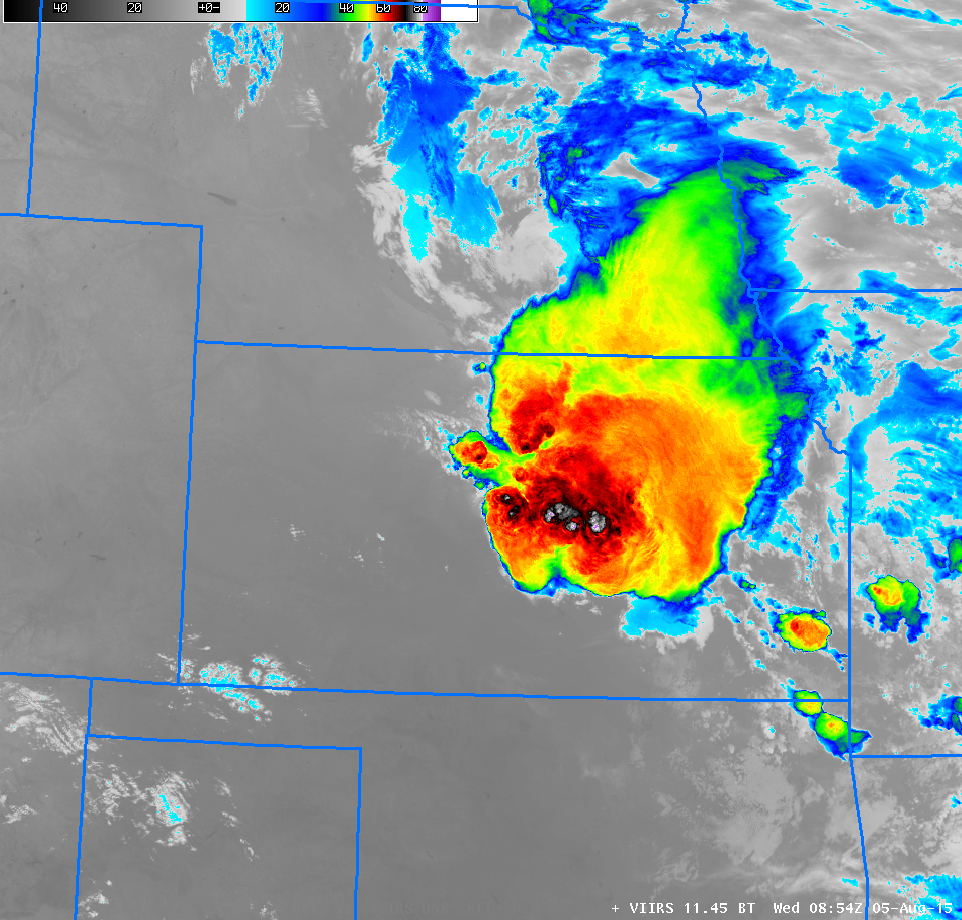
South Texas had favorable geometry today that allowed for successive Suomi NPP overpasses to provide information. The Day Night Band imagery, below, and the Brightness Temperature Difference fields, below the Day Night Band, suggest few clouds are detected at 0727 UTC or at 0906 UTC.
Suomi NPP VIIRS Day Night Band Visible Imagery (0.70µm) at 0727 and 0906 UTC 30 July 2015 (Click to enlarge)
Suomi NPP VIIRS Brightness Temperature Difference (11.45µm – 3.74µm) fields at 0727 and 0906 UTC 30 July 2015 (Click to enlarge)
=============================================================================
GOES-R IFR Probability Fields, hourly from 0700 through 1300 UTC, 30 July 2015 (Click to enlarge)
Northeast Florida also had reduced ceilings and visibilities on the morning of 30 July 2015. The animation above of GOES-R IFR Probabilities from 0700-1300 UTC (above) shows enhanced values in most of the inland northern Florida panhandle. The flat nature of the field suggests that higher clouds are preventing satellite detection of low clouds: predictors based on model fields only are being used to compute IFR Probabilities (that is, satellite predictors are not being used). The Brightness Temperature Difference animation for this event is below.
GOES-13 Brightness Temperature Difference (10.7µm – 3.9µm) Fields, hourly from 0700 through 1300 UTC, 30 July 2015 (Click to enlarge)

