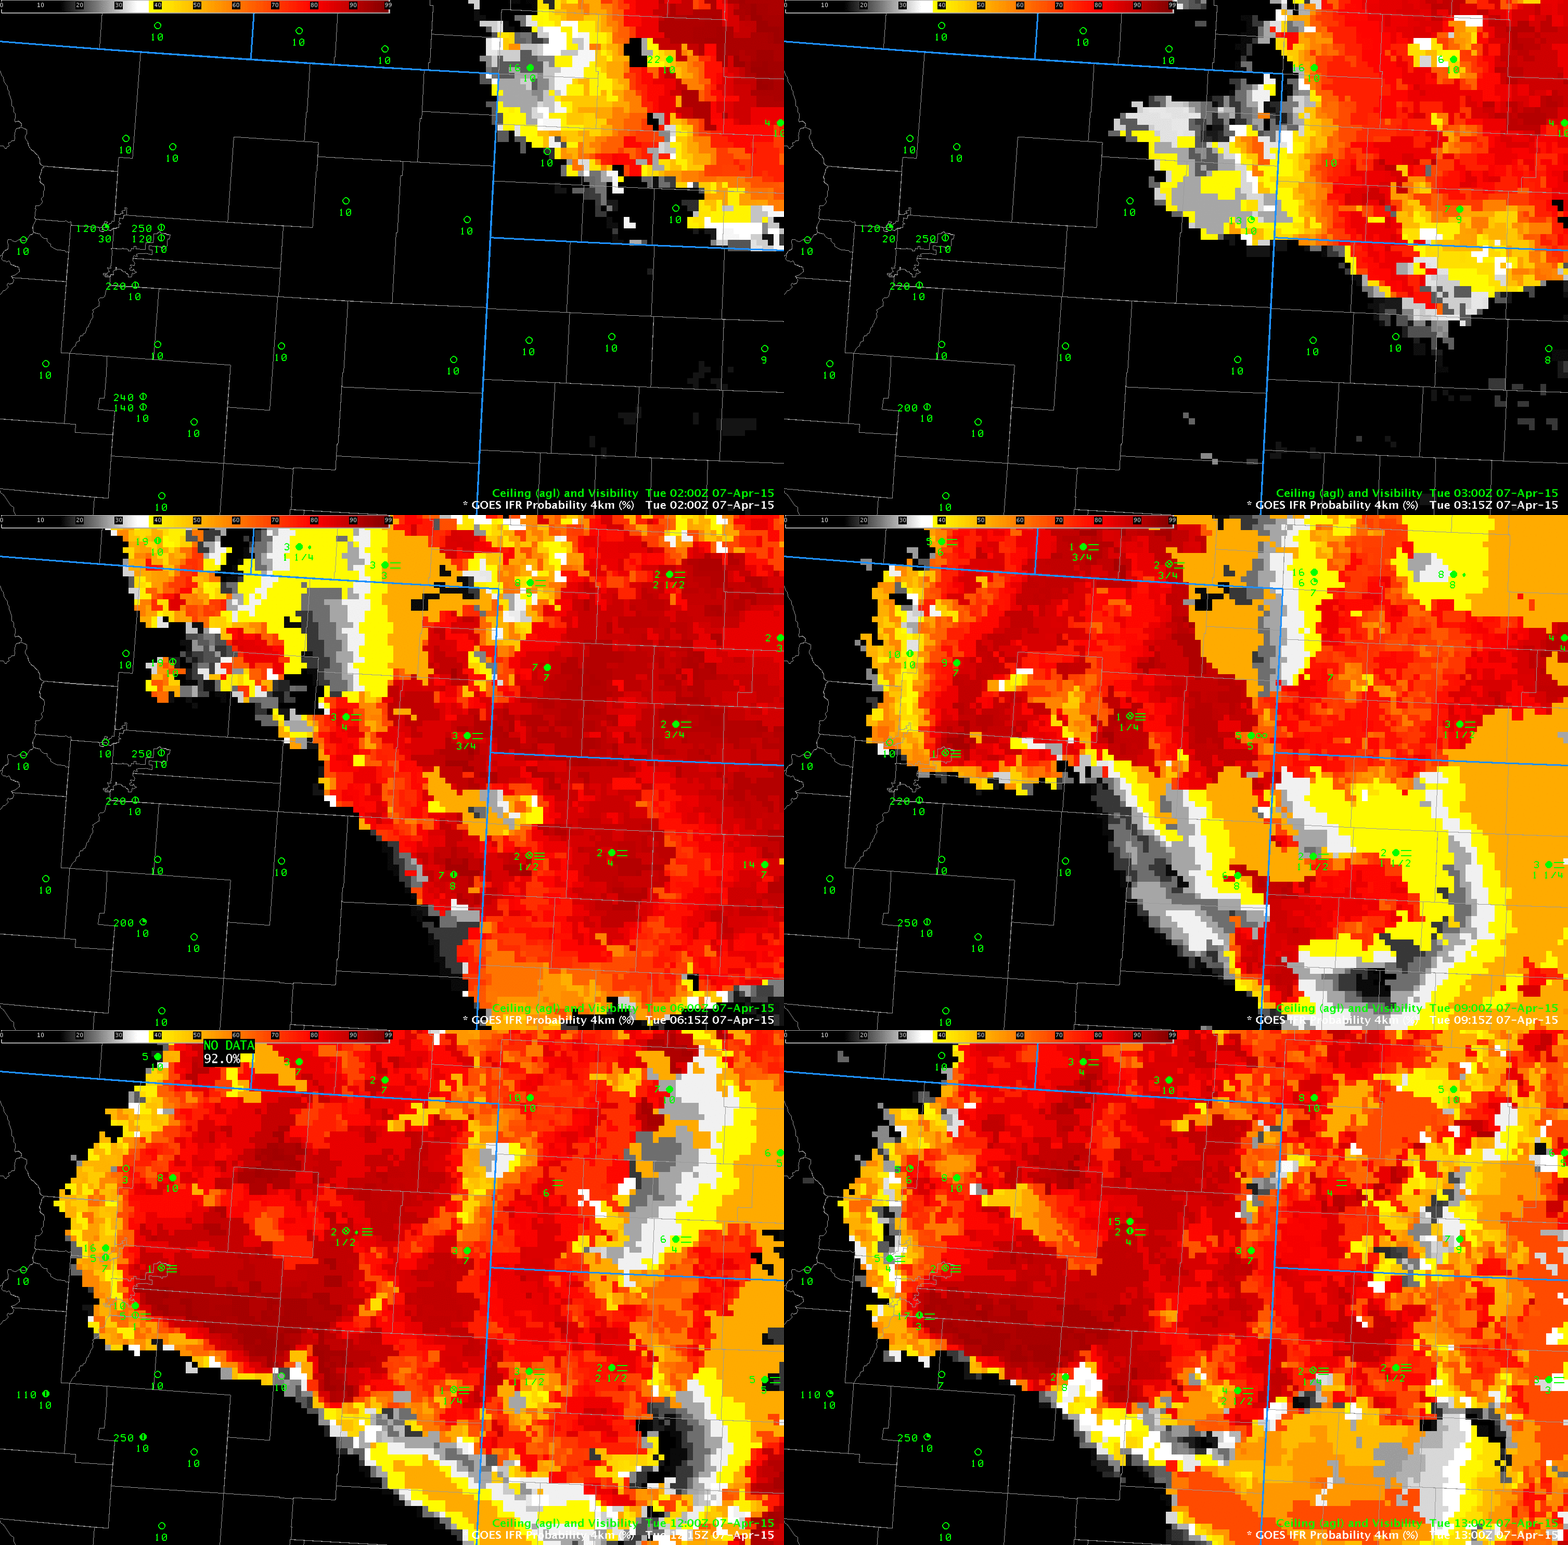
Denver International Airport had a period of restricted visibility during the morning of 7 April, starting around 0830 UTC, when northeast winds ushered in low ceilings and reduced visibilities. High Probabilities in the IFR Probability fields shift west and south with time, demonstrating how the fields can be used to anticipate the development of IFR conditions.
Category Archives: Uncategorized
Sea Fog on the Texas Gulf Coast
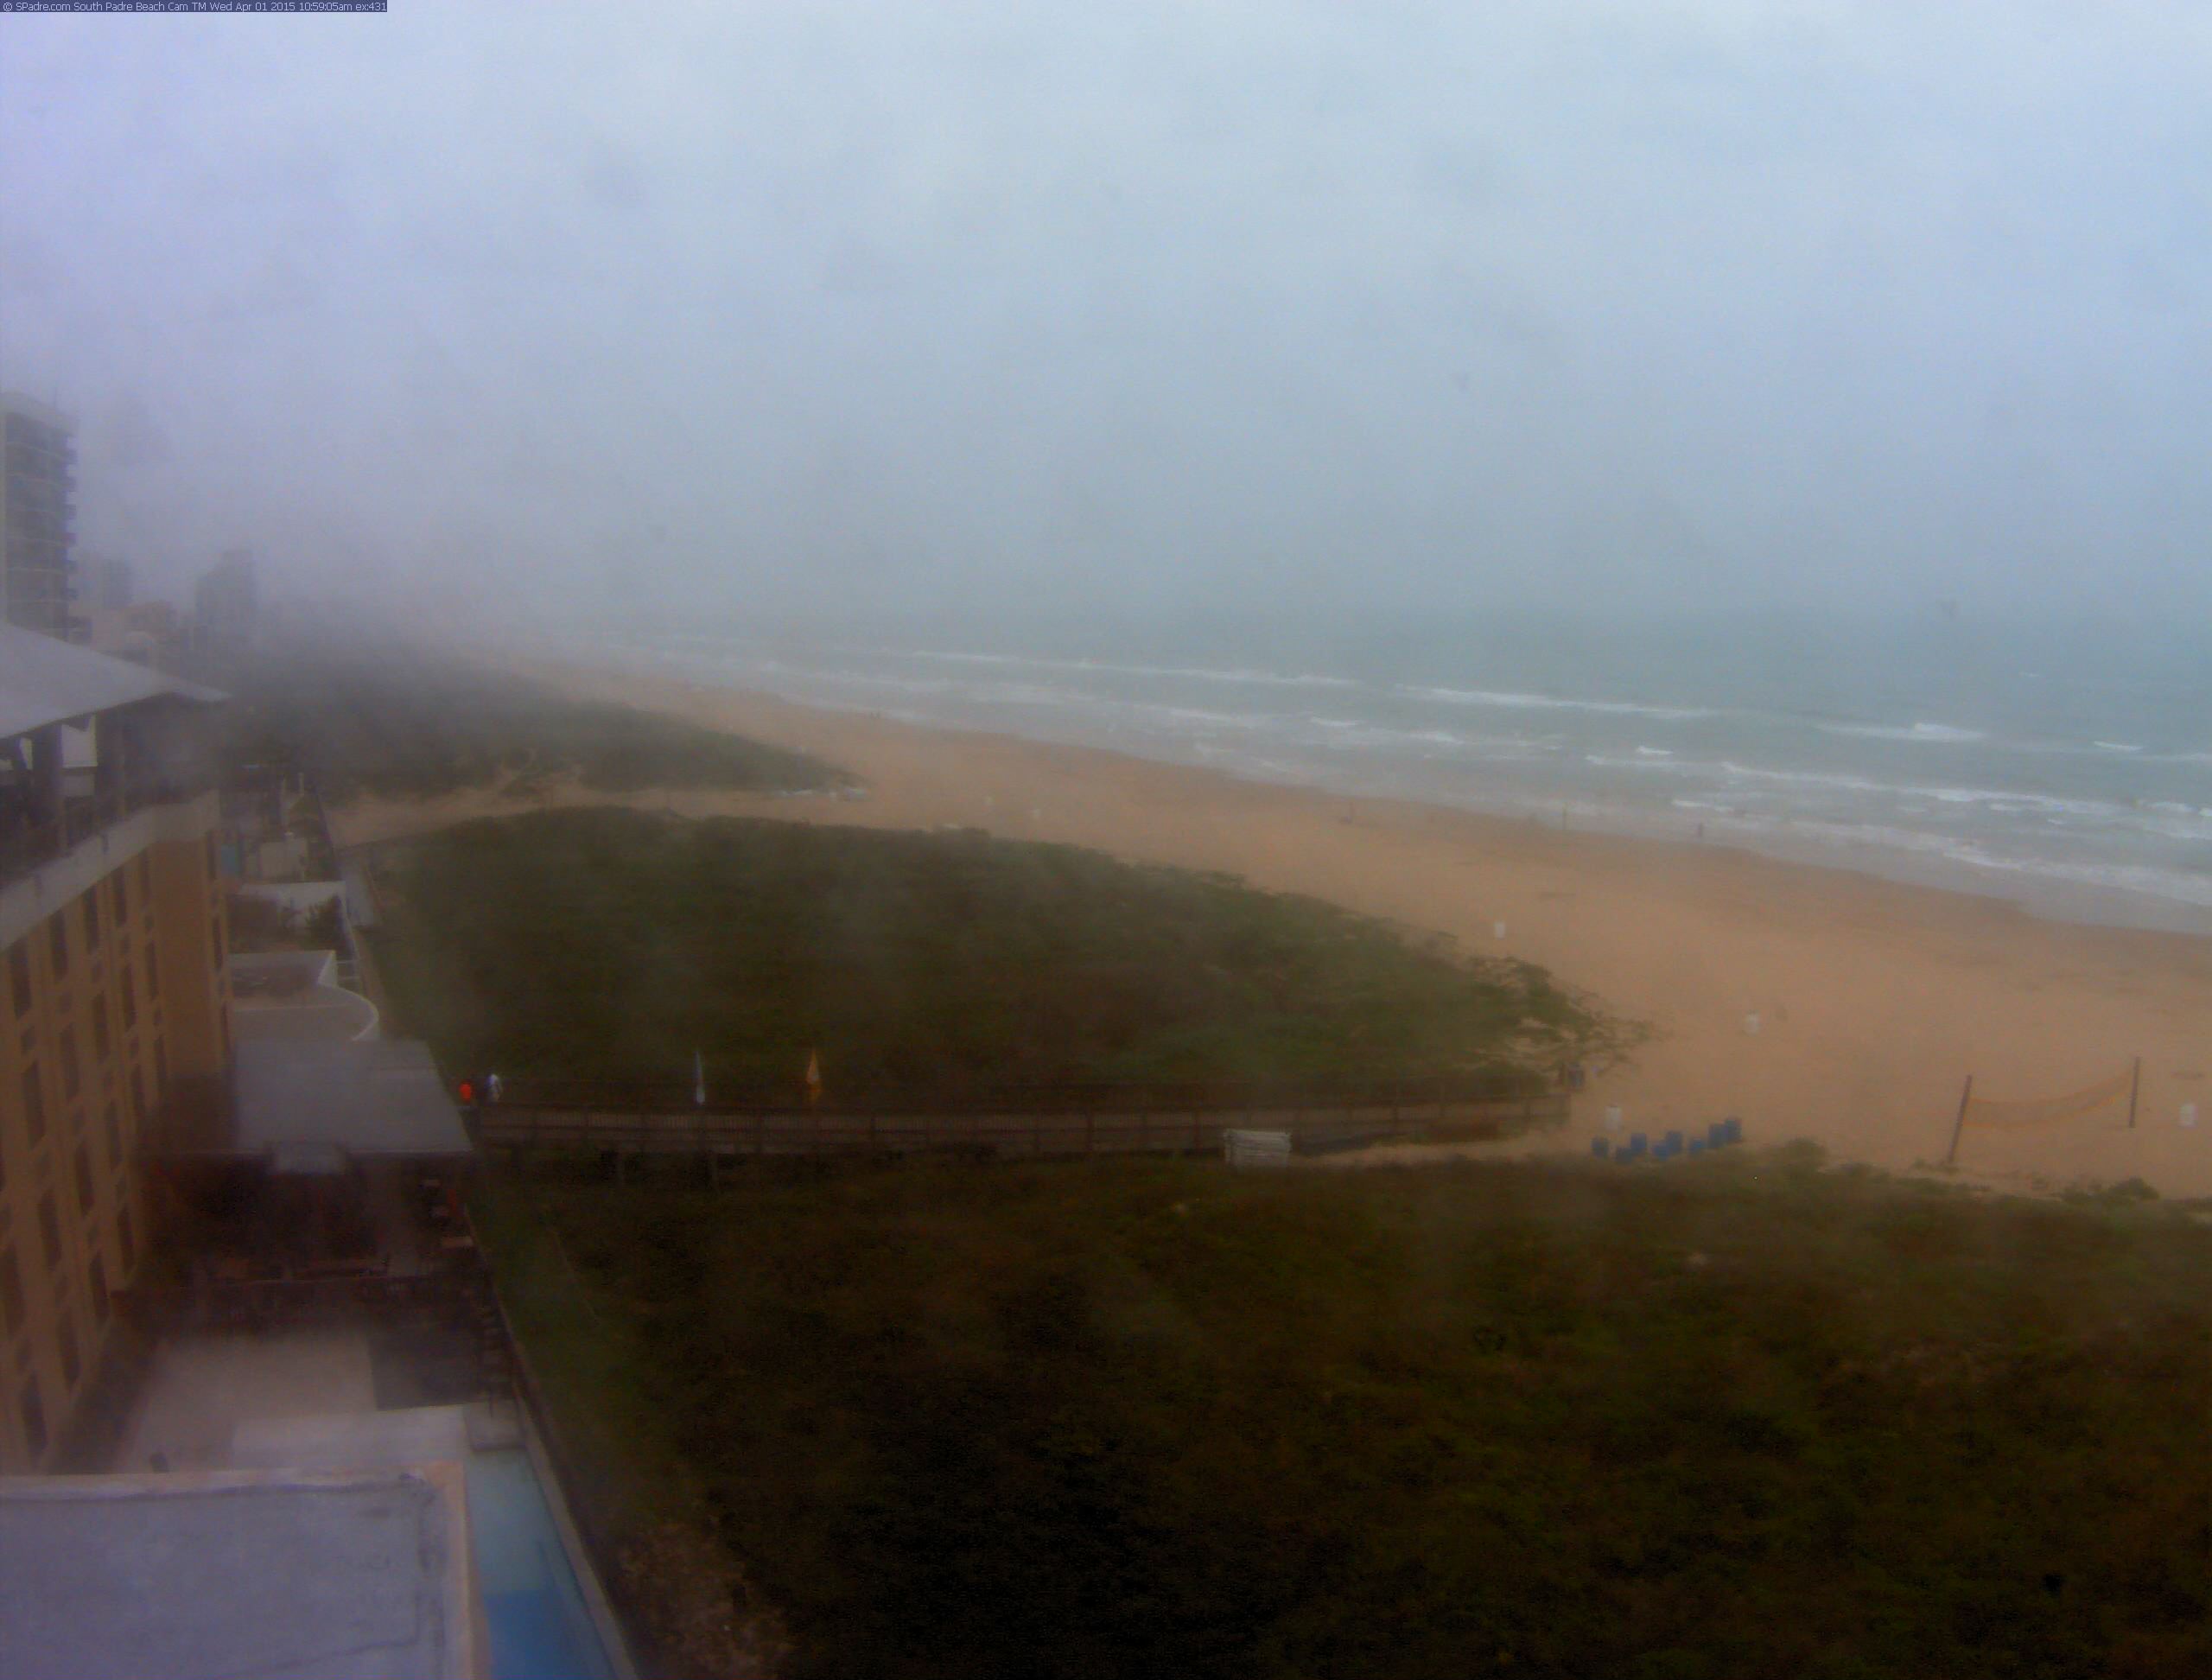
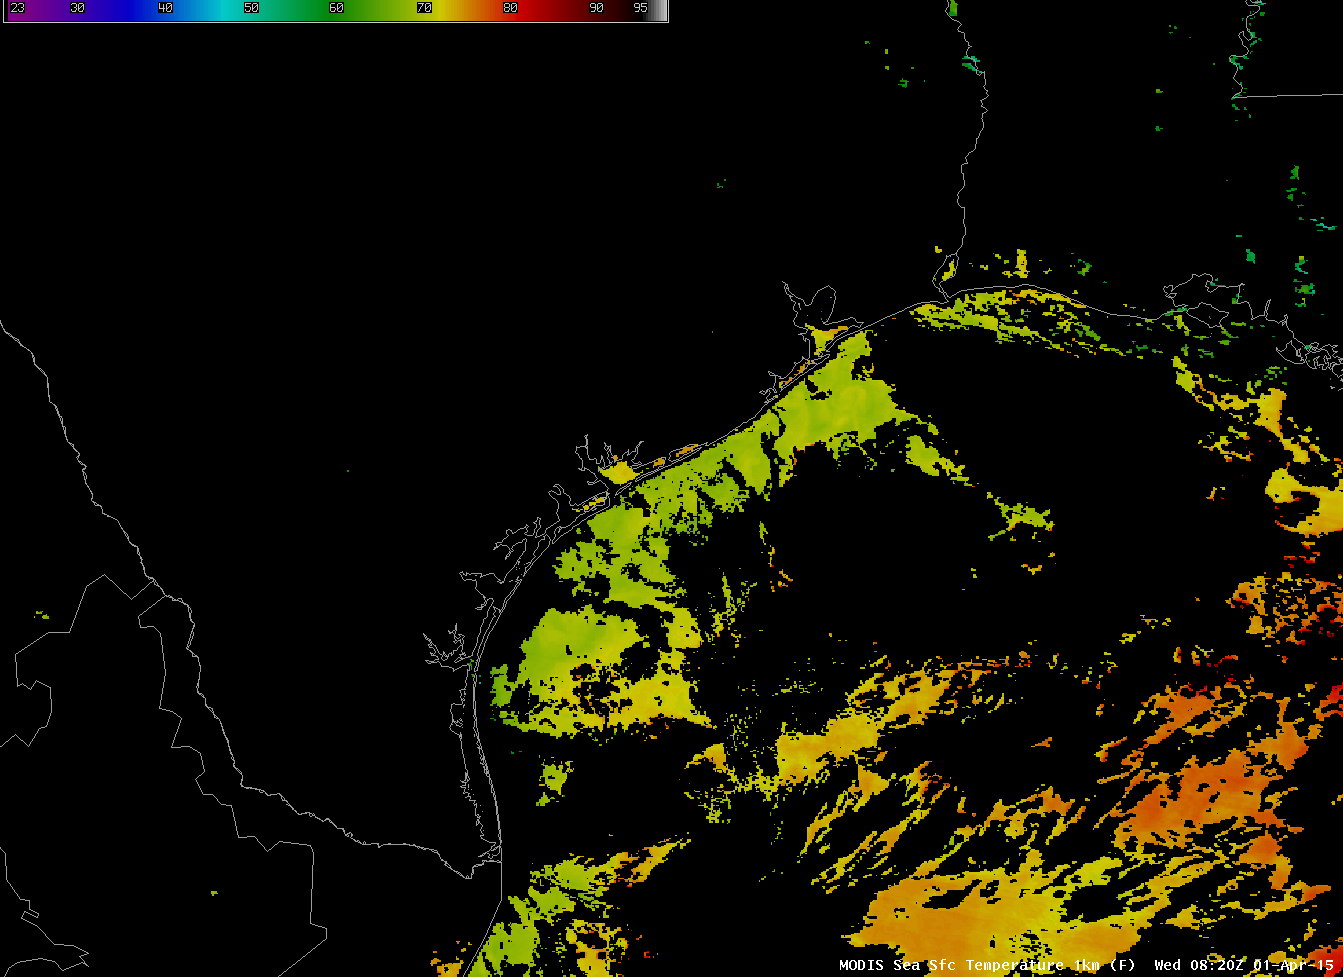
Webcam imagery from South Padre Island between 10 and 11 AM on 1 April (above, from this site) showed dense fog that had rolled in from the sea. This is likely an advection fog formed as humid air over the Gulf of Mexico moved over relatively cooler shelf water. SSTs in the region were in the upper 60s (Fahrenheit) as depicted by the image below.
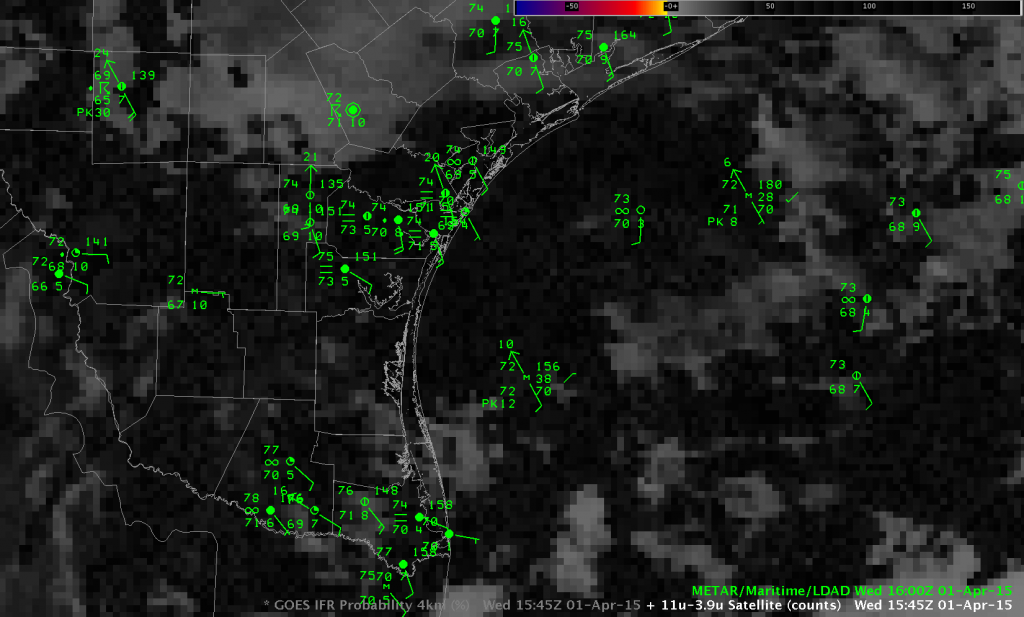
GOES-R IFR Probabilities, below, suggested the presence of the IFR conditions that existed at the coast. Very high probabilities are concentrated near South Padre Island, and spread north and northeastward, with highest values hugging the shoreline.
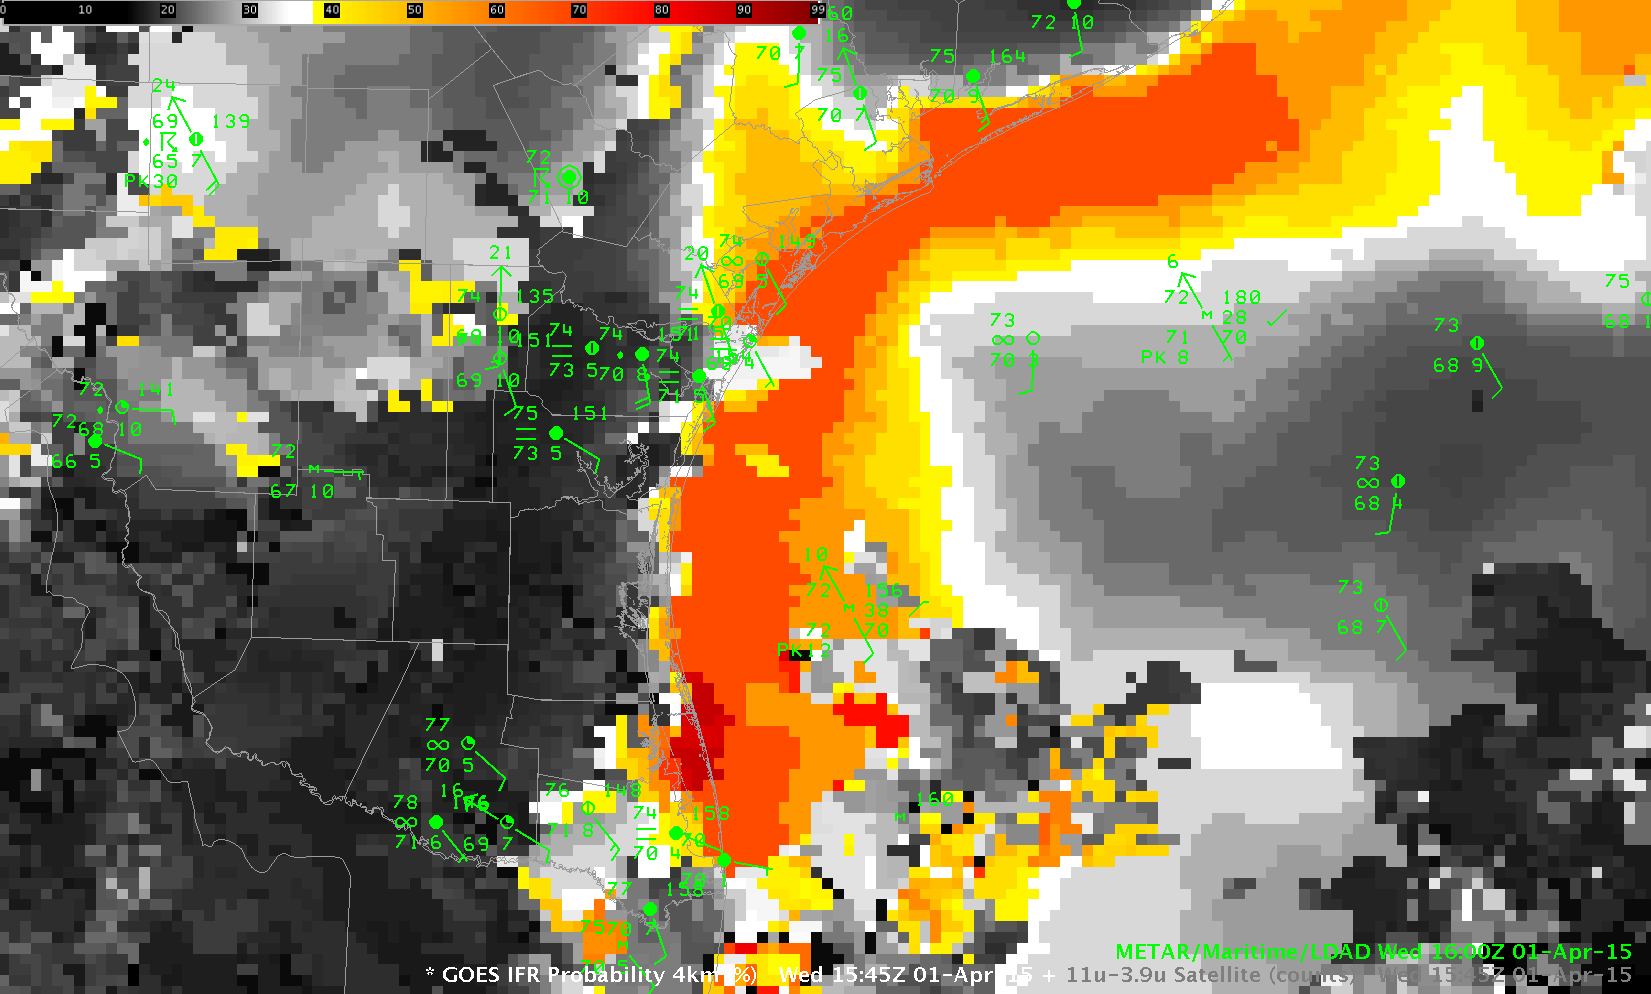
GOES-R IFR Probabilities computed from GOES-East and Rapid Refresh Data, 1545 UTC on 1 April 2015 (Click to enlarge)
Brightness Temperature Difference fields at the same time gave little surface information because of the presence of high clouds.
A similar event occurred in March 2015 along the Florida Atlantic Coast. (Link).
IFR Probabilities with a developing storm system
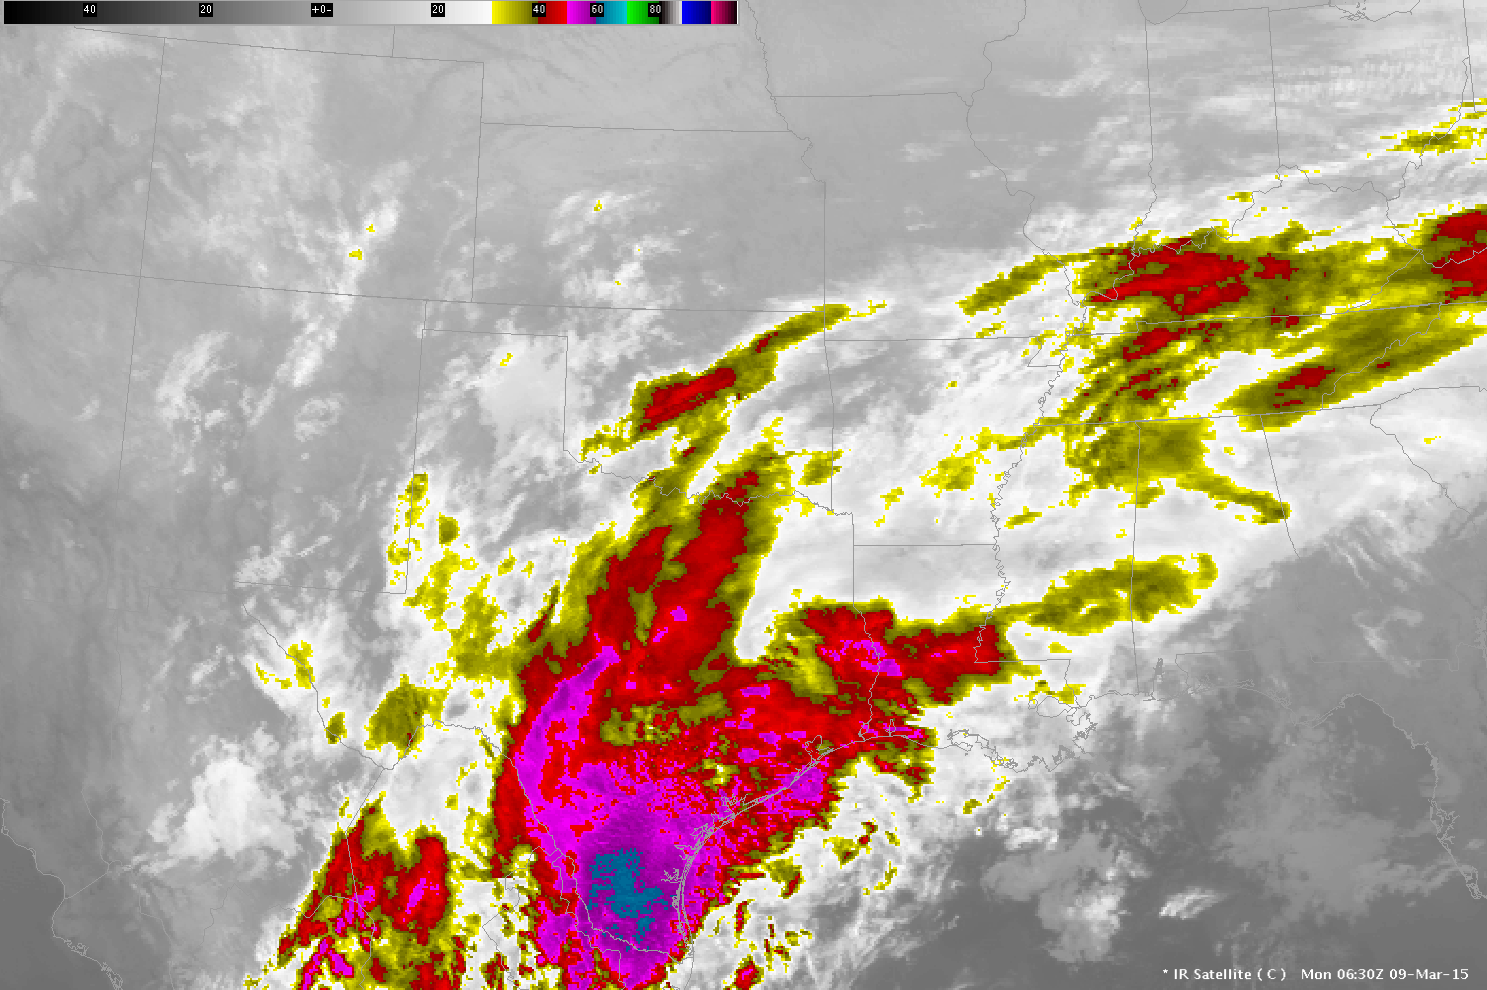
The 10.7 µm imagery from GOES-East (Band 4) shows a cloud signature that is typical of a developing low-pressure system that one might find to the east of an open wave at 300 mb. Using satellite data alone to deduce (or perceive) the presence of IFR conditions in this case will be difficult. GOES Sounder Estimates of Total Precipitable Water in the region (from here) give little information.
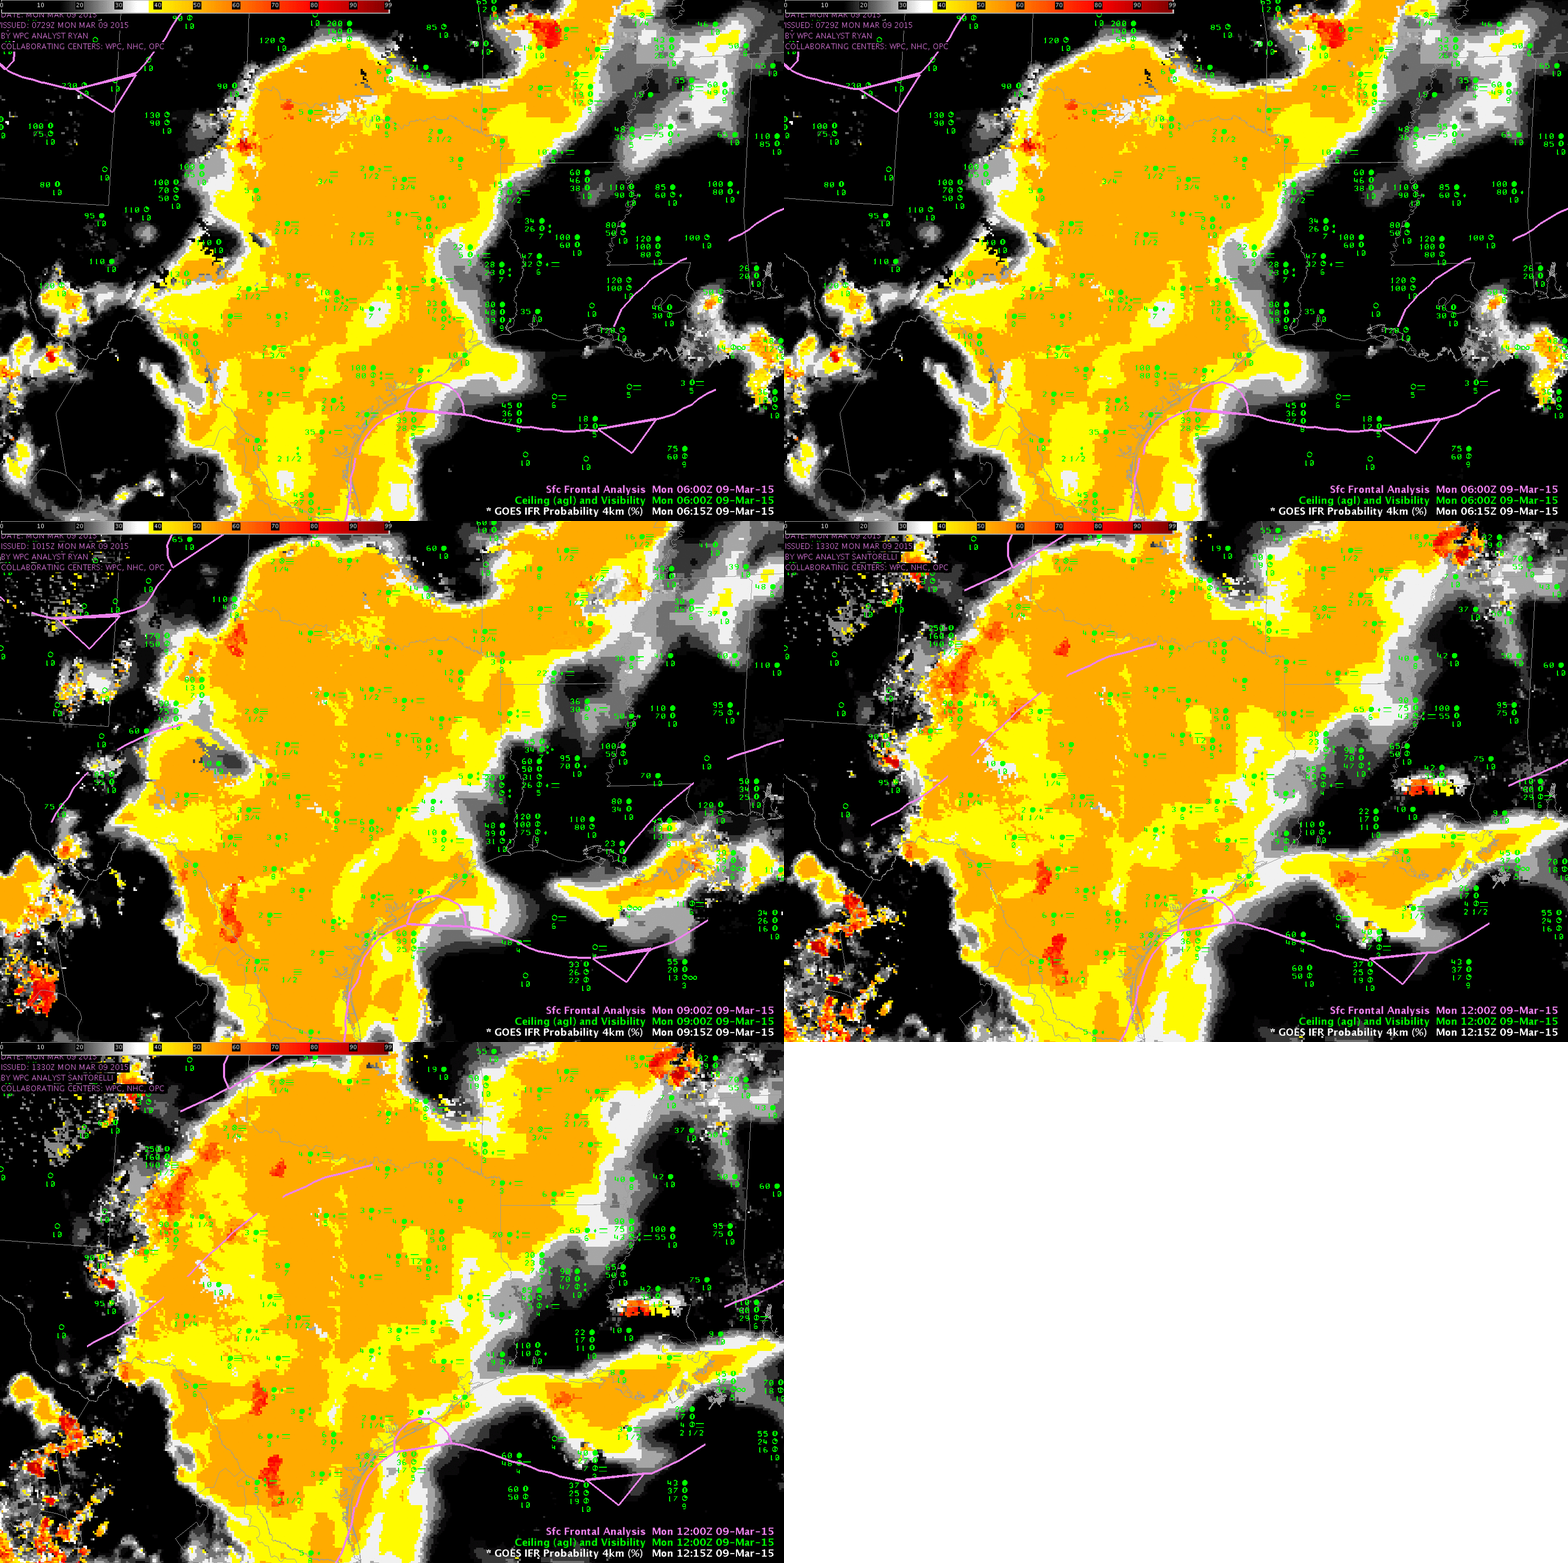
GOES-R IFR Probability fields blend together satellite information with moisture information from the Rapid Refresh (also included: slowly varying fields such as Sea Surface Temperature and surface emissivity). The animation below, showing the field at 0615, 0915 and 1215 UTC, demonstrates the product’s ability to distinguish between regions with cloud (Louisiana) and regions with fog/low stratus (Much of east Texas, stretching up into central Arkansas; observations show IFR or near-IFR conditions widespread in this area). Because satellite data are unavailable for the product (only water-based cloud information is used, typically, and multiple cloud layers associated with deep clouds include mixed phase and ice clouds) the fields are fairly uniform. Where holes in the clouds appear — over the Rio Grande at 0915 UTC and over parts of south Texas at 1215 UTC — IFR Probabilities look more pixelated and Probabilities are higher. The larger IFR Probabilities occur because satellite predictors are incorporated into the algorithm where low clouds are detected.
Fog over South Dakota
The NWS Office in Sioux Falls tweeted a picture of fog near Kimball, SD, in Brule County (below).
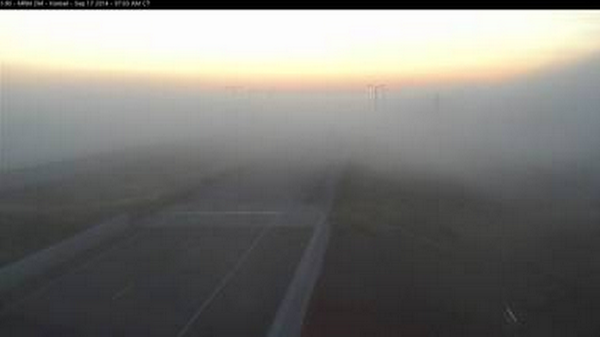
Webcam image of Fog along I-90 in central South Dakota near Kimball, after sunrise on 17 September 2014
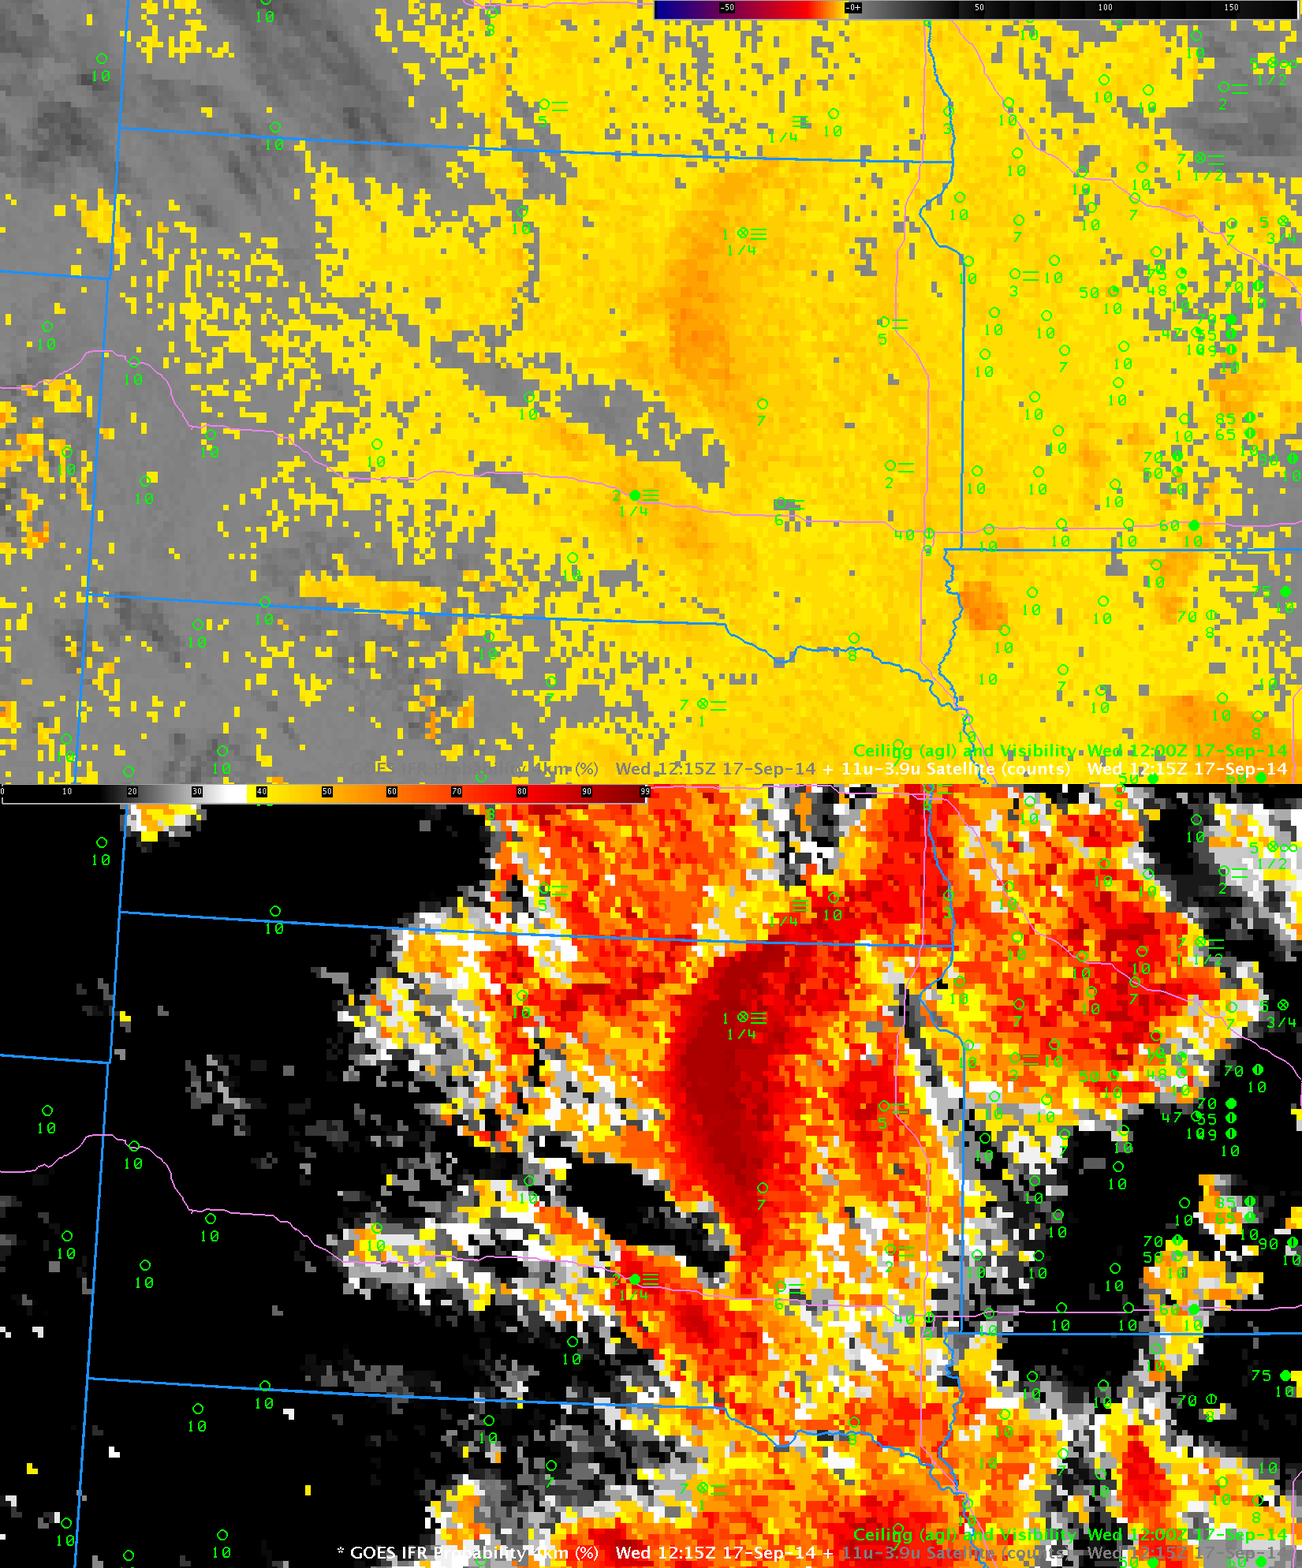
The toggle below shows the Brightness Temperature Difference Field from GOES-13 (10.7 µm – 3.9 µm) and the GOES-R IFR Probability fields computed using data from GOES-13 and the Rapid Refresh Model. The Brightness Temperature Difference field detects the presence of water-based clouds (yellow and orange in the enhancement used) and works because such clouds have difference emissivity properties at 3.9 µm and 10.7 µm. Temperatures inferred from the 3.9 µm radiation detected are cooler than those temperatures inferred from the 10.7 µm radiation because water-based clouds do not emit 3.9 µm radiation as blackbodies. The Brightness Temperature Difference field gives information about the top of the cloud only, however, and it typically overestimates regions of fog/low stratus. That is the case on the morning of 17 September 2014. For example, IFR Conditions are not reported over much of southeastern South Dakota or western Minnesota along Interstate 90. The IFR Probability algorithm is correctly minimizing the influence of the strong brightness temperature difference signal there because Rapid Refresh Data is not showing boundary-layer saturation. The highest IFR Probabilities in South Dakota are associated with reported IFR Conditions, for example at Chamberlain, SD (west of Kimball SD and also in Brule County) and at Aberdeen in northeastern South Dakota.
Colorbars
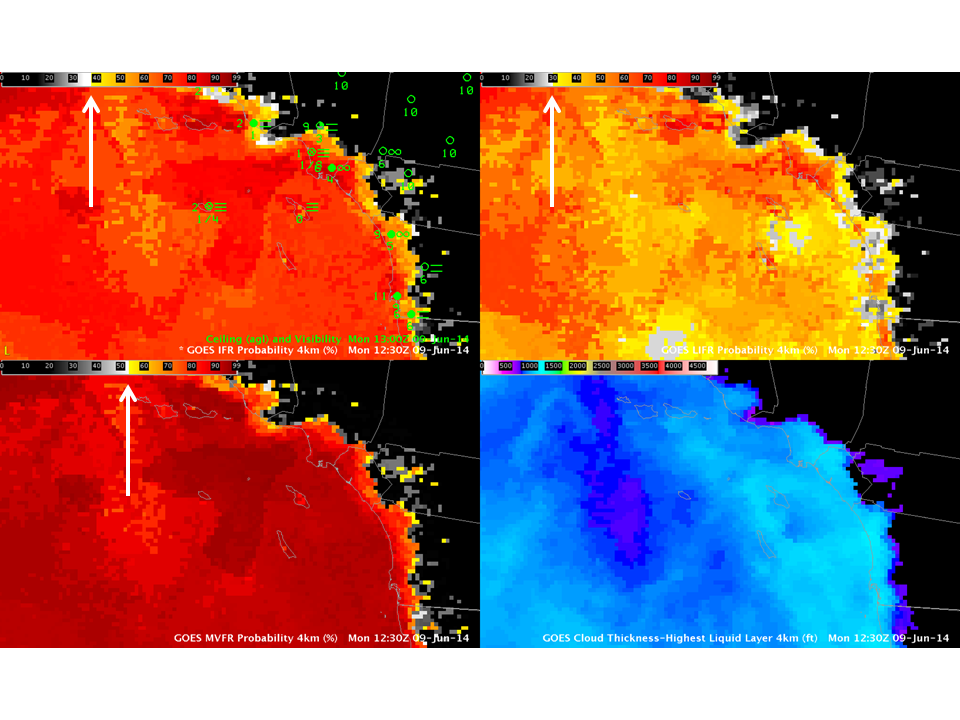
GOES-R IFR Probabilities (Upper Left), GOES-R Low IFR Probabilities (Upper Right), GOES-R MVFR Probabilities (Lower Left) and GOES-R Cloud Thickness (Lower Right), time as indicated (Click to enlarge)
The default colorbars for GOES-R IFR (Instrument Flight Rules) Probabilities, Low IFR Probabilities and MVFR (Mostly Visible Flight Rules) Probabilities change colors at different break points, as shown above (by where the arrows are, for example). IFR Probabilities switch from white to orange/yellow at around 40%, vs. 30% for LIFR and 55% for MVFR. A statistical analysis of the surface observations was used in the development of the colorbars. Highest skill at detecting the category was assigned the reddest colors. One could therefore infer from this that there is in general less skill in detecting MVFR conditions than LIFR conditions. For a given event, however, as shown above, MVFR probabilities will in general be larger than IFR or LIFR probabilities.
Let the color of the colorbar guide the interpretation. Black and white values mean the category (IFR conditions, for example) is unlikely, yellow means it’s possible, and red means it is highly likely. MVFR probabilities have higher thresholds than LIFR probabilities because of skill differences in predicting the different visibilities associated with the sky conditions.
Fog and Stratus in one scene: What should be highlighted?
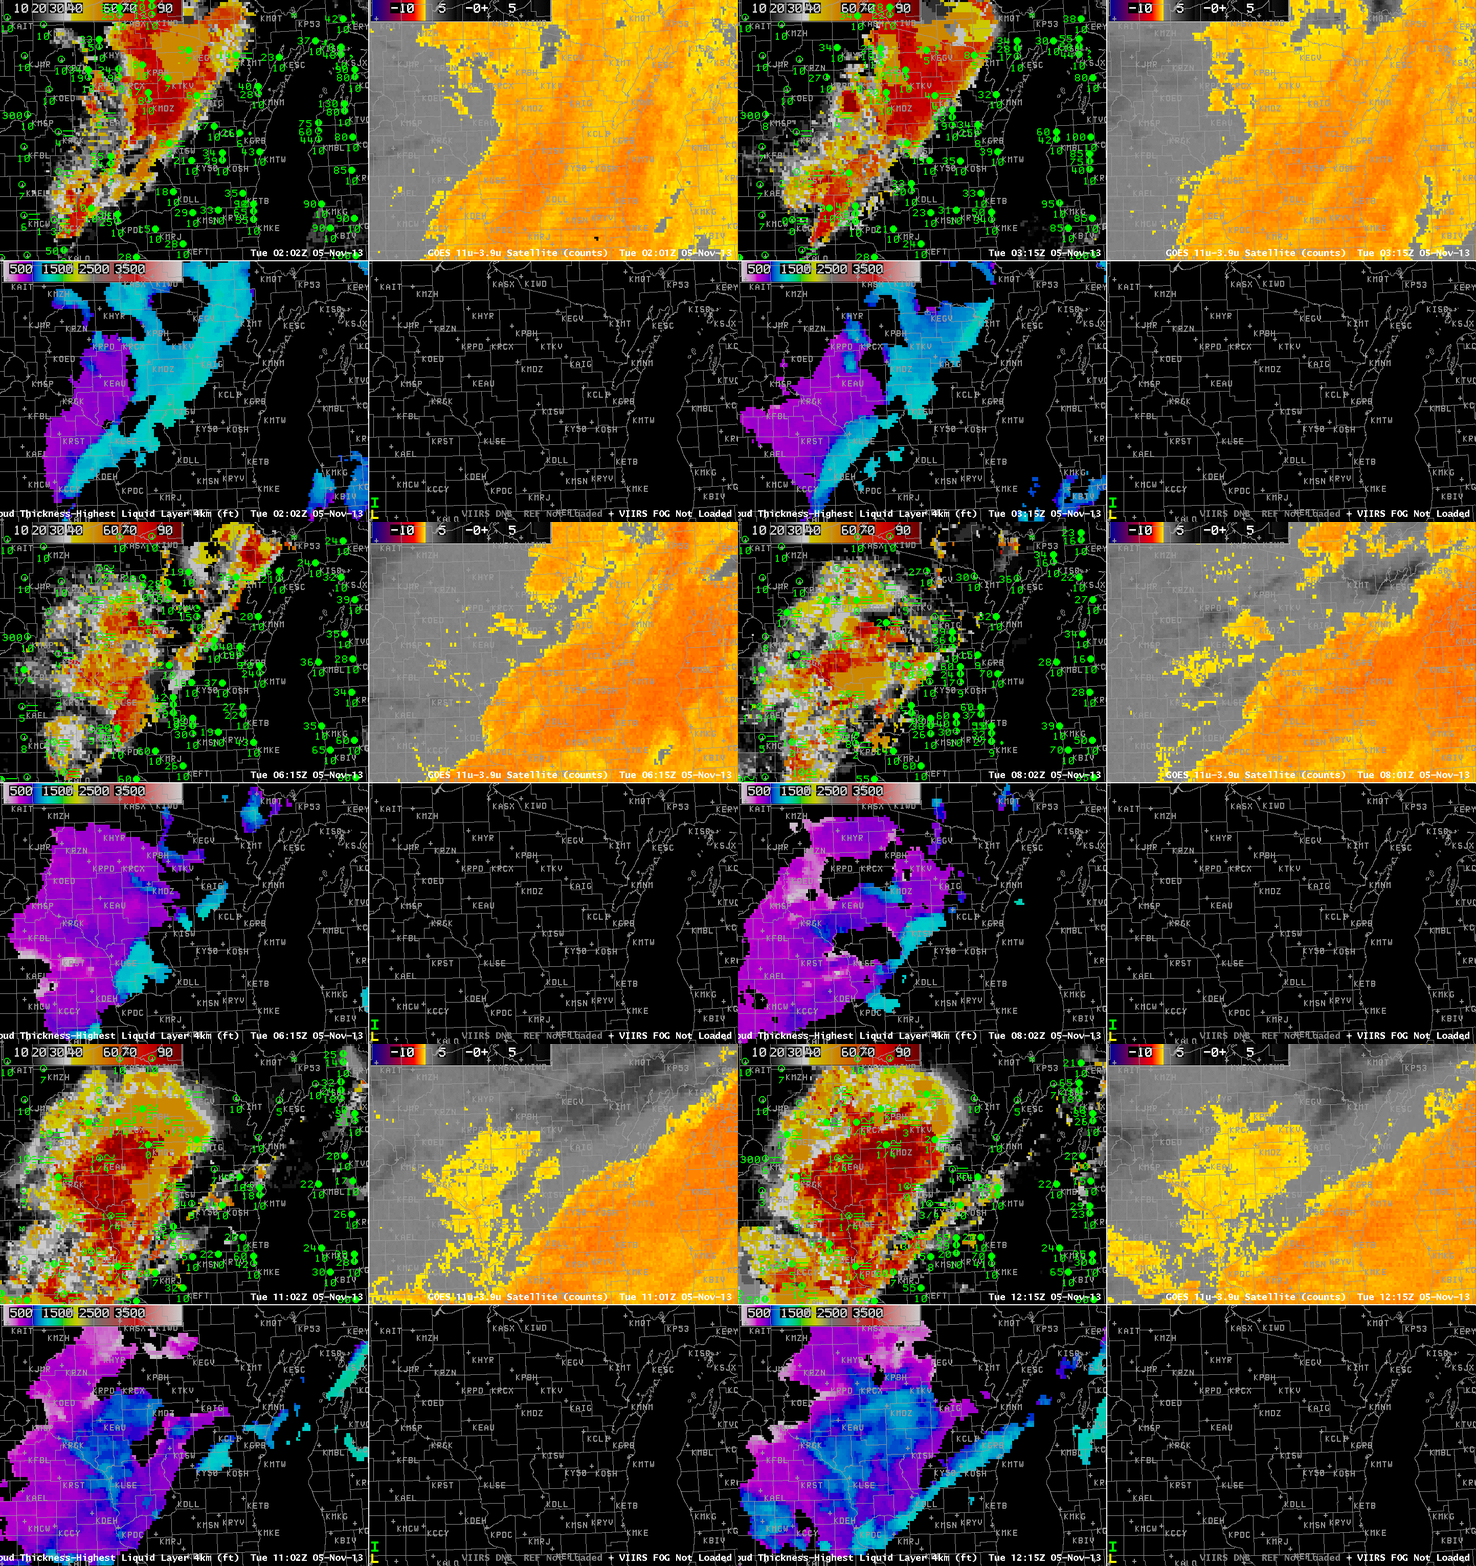
GOES-13-based GOES-R IFR Probabilities (Upper Left), GOES-13 Brightness Temperature Difference Product (10.7 µm – 3.9 µm) (Upper Right), GOES-R Cloud Thickness (Lower Left), Suomi-NPP Day/Night band (Lower Right), all times as indicated (click image to enlarge)
Dense fog developed over Western Wisconsin before sunrise on 5 November 2013. The animation above shows the development of high IFR probabilities in that region as a mid-level stratus deck shifts off to the east. Cloud thicknesses just before sunrise reach 1100 feet over portions of Wisconsin; according to this plot, fog should persist for at least 4 hours after sunrise. This was the case. Fog dissipated shortly after 1700 UTC.
This case shows a benefit of the GOES-R IFR Probability field: it accurately discerns the difference between low stratus/fog (that develops over western Wisconsin) and mid-level stratus (retreating to the east over central and eastern Wisconsin during the animation). Mid-level stratus is normally not a transportation concern whereas low clouds/fog most definitely are; in this case, dense fog advisories were issued by the Lacrosse, WI, WFO (ARX). At the beginning of the animation, widespread mid-level stratus is indicated (IFR conditions are not reported). As the night progresses, IFR Probabilities increase in regions where IFR conditions start to be reported. (A brightness temperature signal in GOES also develops in this region).
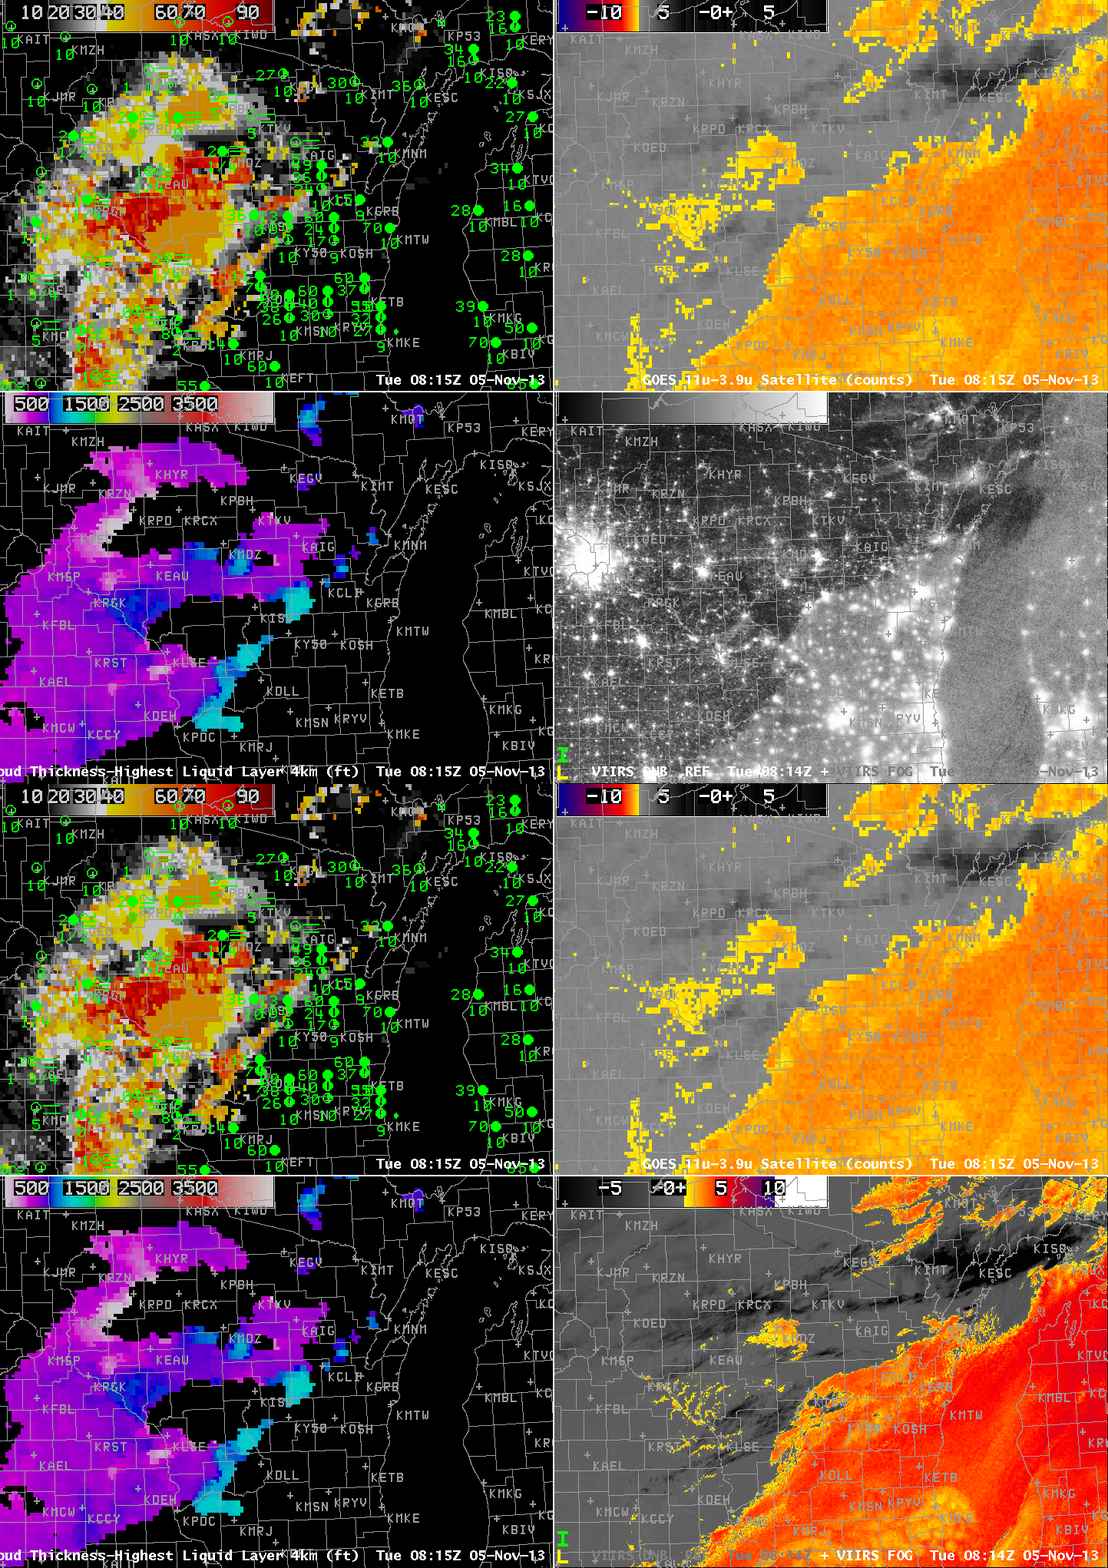
As above, but at 0815 UTC. The lower right image toggles between the Day/Night Band and the Brightness Temperature Difference (11.45 µm – 3.74 µm) from Suomi/NPP (click image to enlarge)
Suomi/NPP VIIRS viewed this scene shortly after 0815 UTC, and that imagery is above. Both the Day/Night band and the Brightness Temperature Difference fields (11.45 µm – 3.74 µm) are shown as a toggle. The mid-level stratus at 0815 is readily apparent. The developing fog over river valleys in western Wisconsin shows plainly in the brightness temperature difference field, but less so in the day/night band with scant lunar illumination.
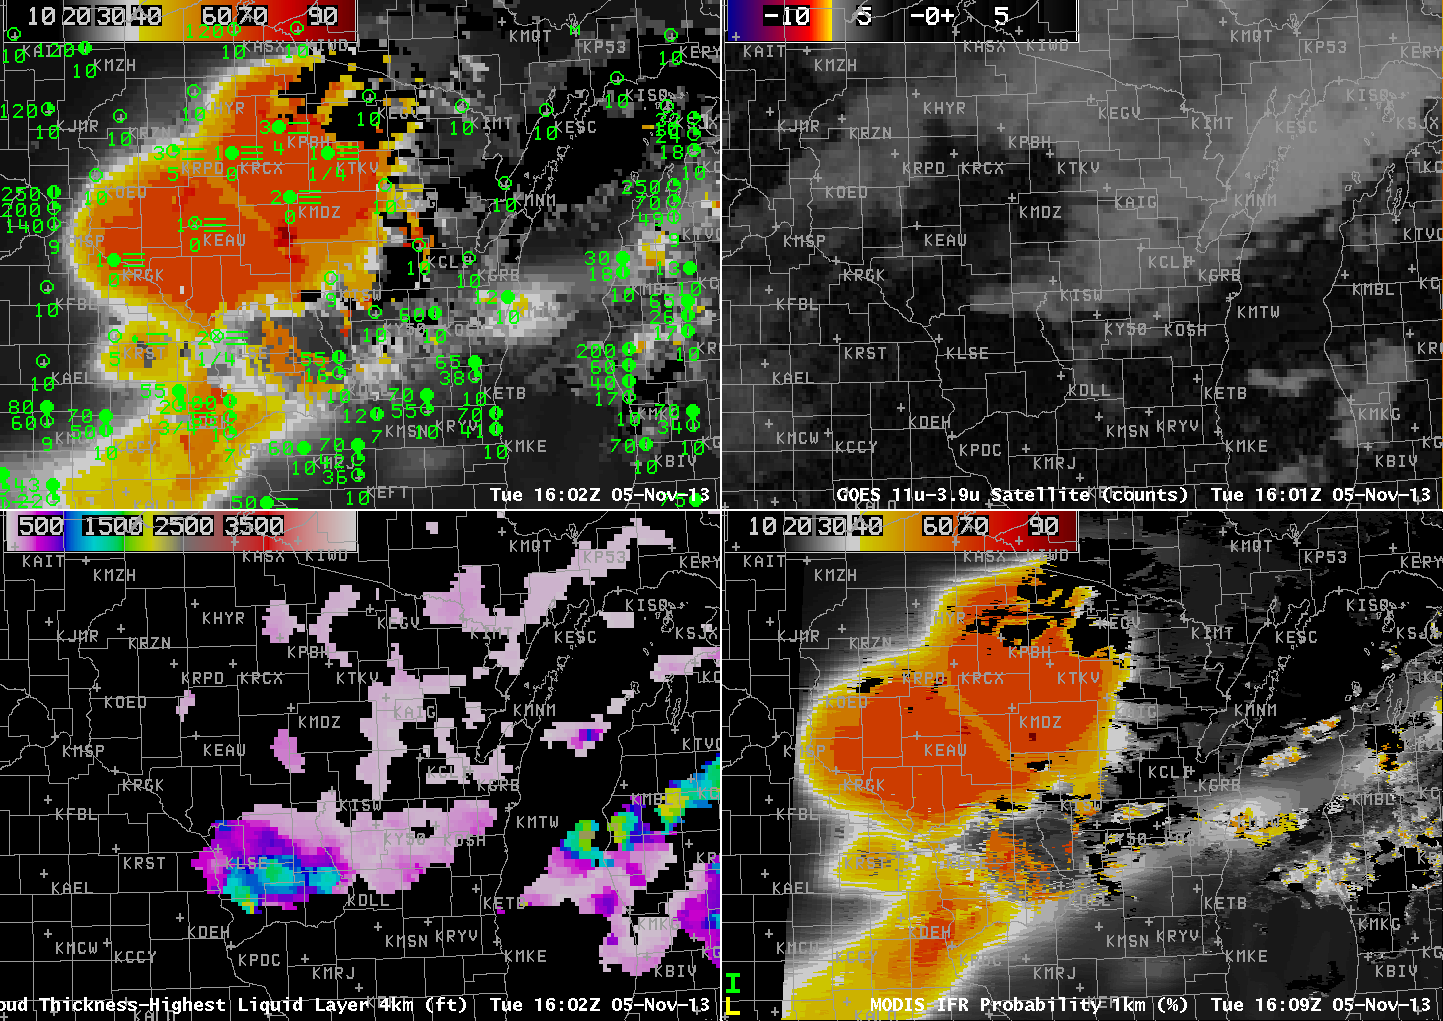
GOES-13-based GOES-R IFR Probabilities (Upper Left), GOES-13 Brightness Temperature Difference Product (10.7 µm – 3.9 µm) (Upper Right), GOES-R Cloud Thickness (Lower Left), MODIS-based IFR Probabilities (Lower Right), all times as indicated (click image to animate)
MODIS data from Terra and Aqua is also used to produce IFR Probabilities, and those data are shown above, for three times: 0413 UTC, 0823 UTC and 1609 UTC. Patterns in the MODIS IFR Probability are similar to those in GOES, but small-scale features such as river valleys are much more apparent. Note that by 1609 UTC, higher clouds have overspread western Wisconsin in advance of an approaching mid-latitude cyclone; thus, the GOES and MODIS IFR Probabilities both are flat fields that are mostly based on Rapid Refresh data. Nevertheless, they both depict the region of IFR conditions over western Wisconsin that is surrounded by better visibilities and higher ceilings. Recall that GOES-R cloud thickness is not computed where high clouds are present.
Fog and Stratus under high clouds in the Southern Plains
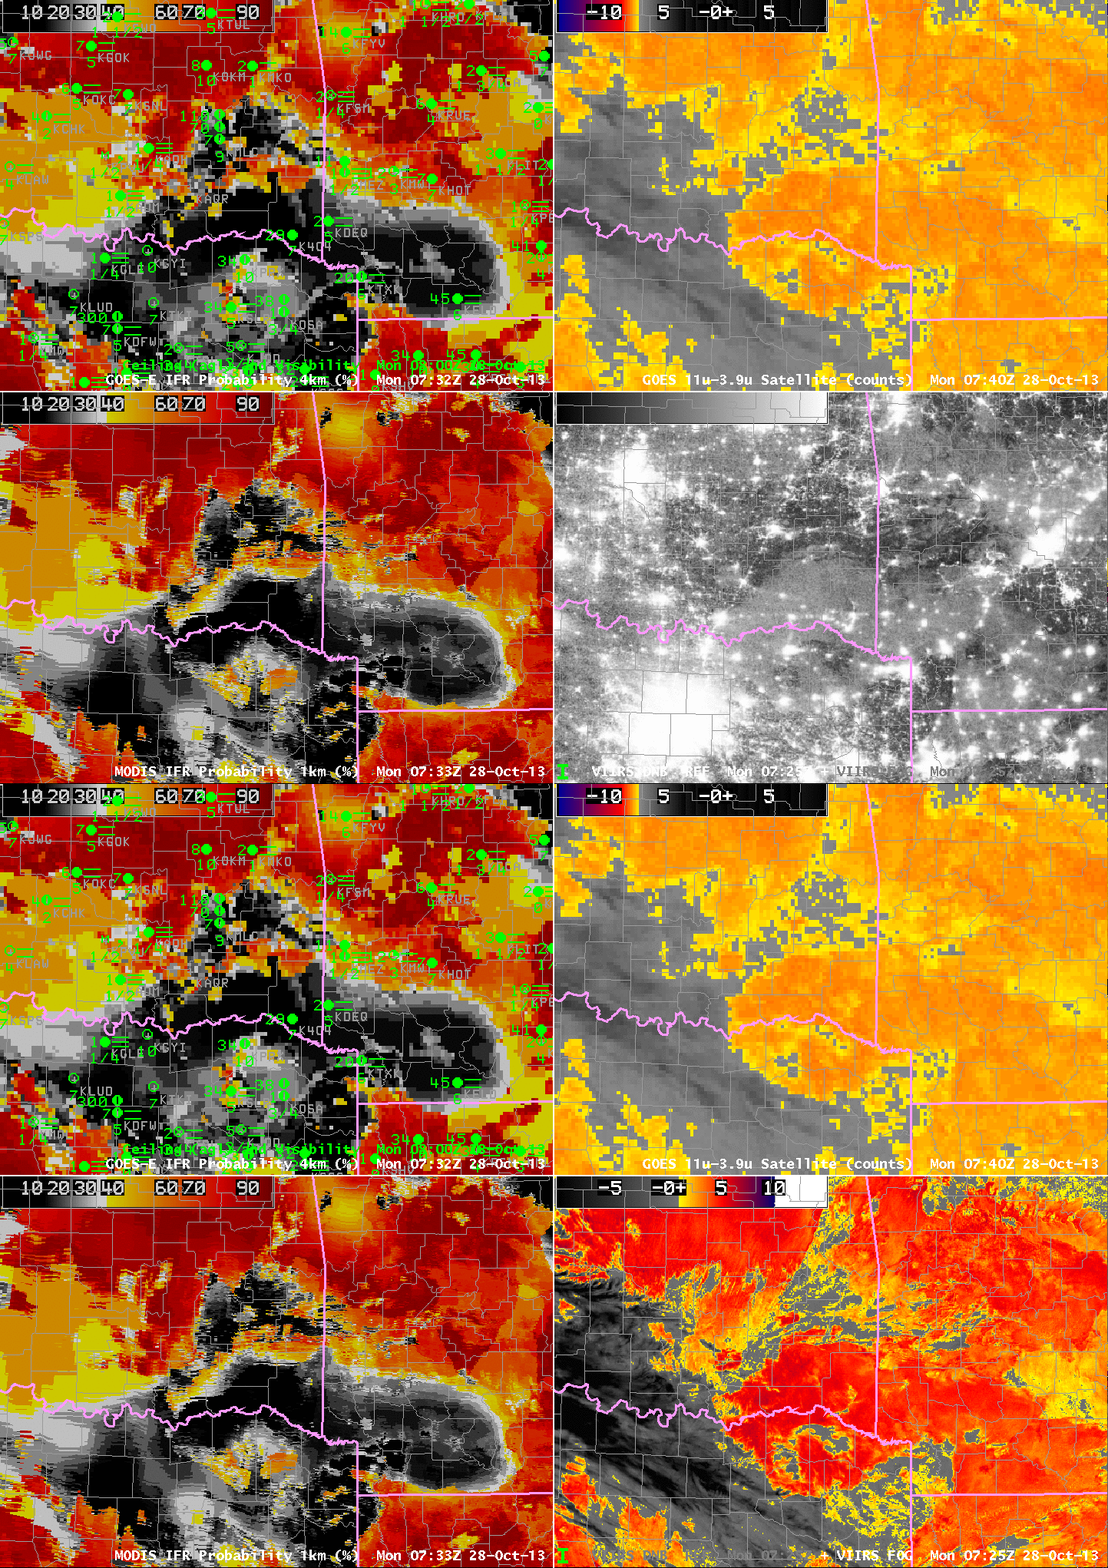
GOES-13-based GOES-R IFR Probabilities (Upper Left), GOES-13 Brightness Temperature Difference Product (10.7 µm – 3.9 µm) (Upper Right), MODIS-based GOES-R IFR Probabilities (Lower Left), Suomi-NPP Brightness Temperature Difference (11.35 µm – 3.74 µm) and Day/Night band (Lower Right), all times as indicated (click image to enlarge)
Fog and low stratus developed over the Southern Plains during the morning hours of 28 October 2013. The imagery above, from near 0730 UTC, demonstrates strengths of the IFR Probability fields and inherent limitations to the traditional methods of detecting fog and low stratus: the brightness temperature difference between 10.7 µm and 3.9 µm data. For example, note the elevated stratus over the Red River Valley in southeastern OK. Both GOES and VIIRS Brightness Temperature Difference fields there show a strong signal (and the day/night band also suggest clouds are present); IFR Probabilities are low, however, and are in good agreement with the observed ceilings and visibilities that show MVFR conditions.
The brightness temperature difference fields from both Suomi/NPP and from GOES show high clouds over south-central OK, in a region where IFR Conditions are observed. Rapid Refresh model data are being used in this region to diagnose — accurately — the presence of visibility-restricting fog and low stratus. As is typical when Rapid Refresh data are the primary means of diagnosing IFR Probabilities (because high clouds prevent the satellite from seeing water-based clouds near the surface), the IFR probability field is smooth.
IFR Conditions in the Southeast
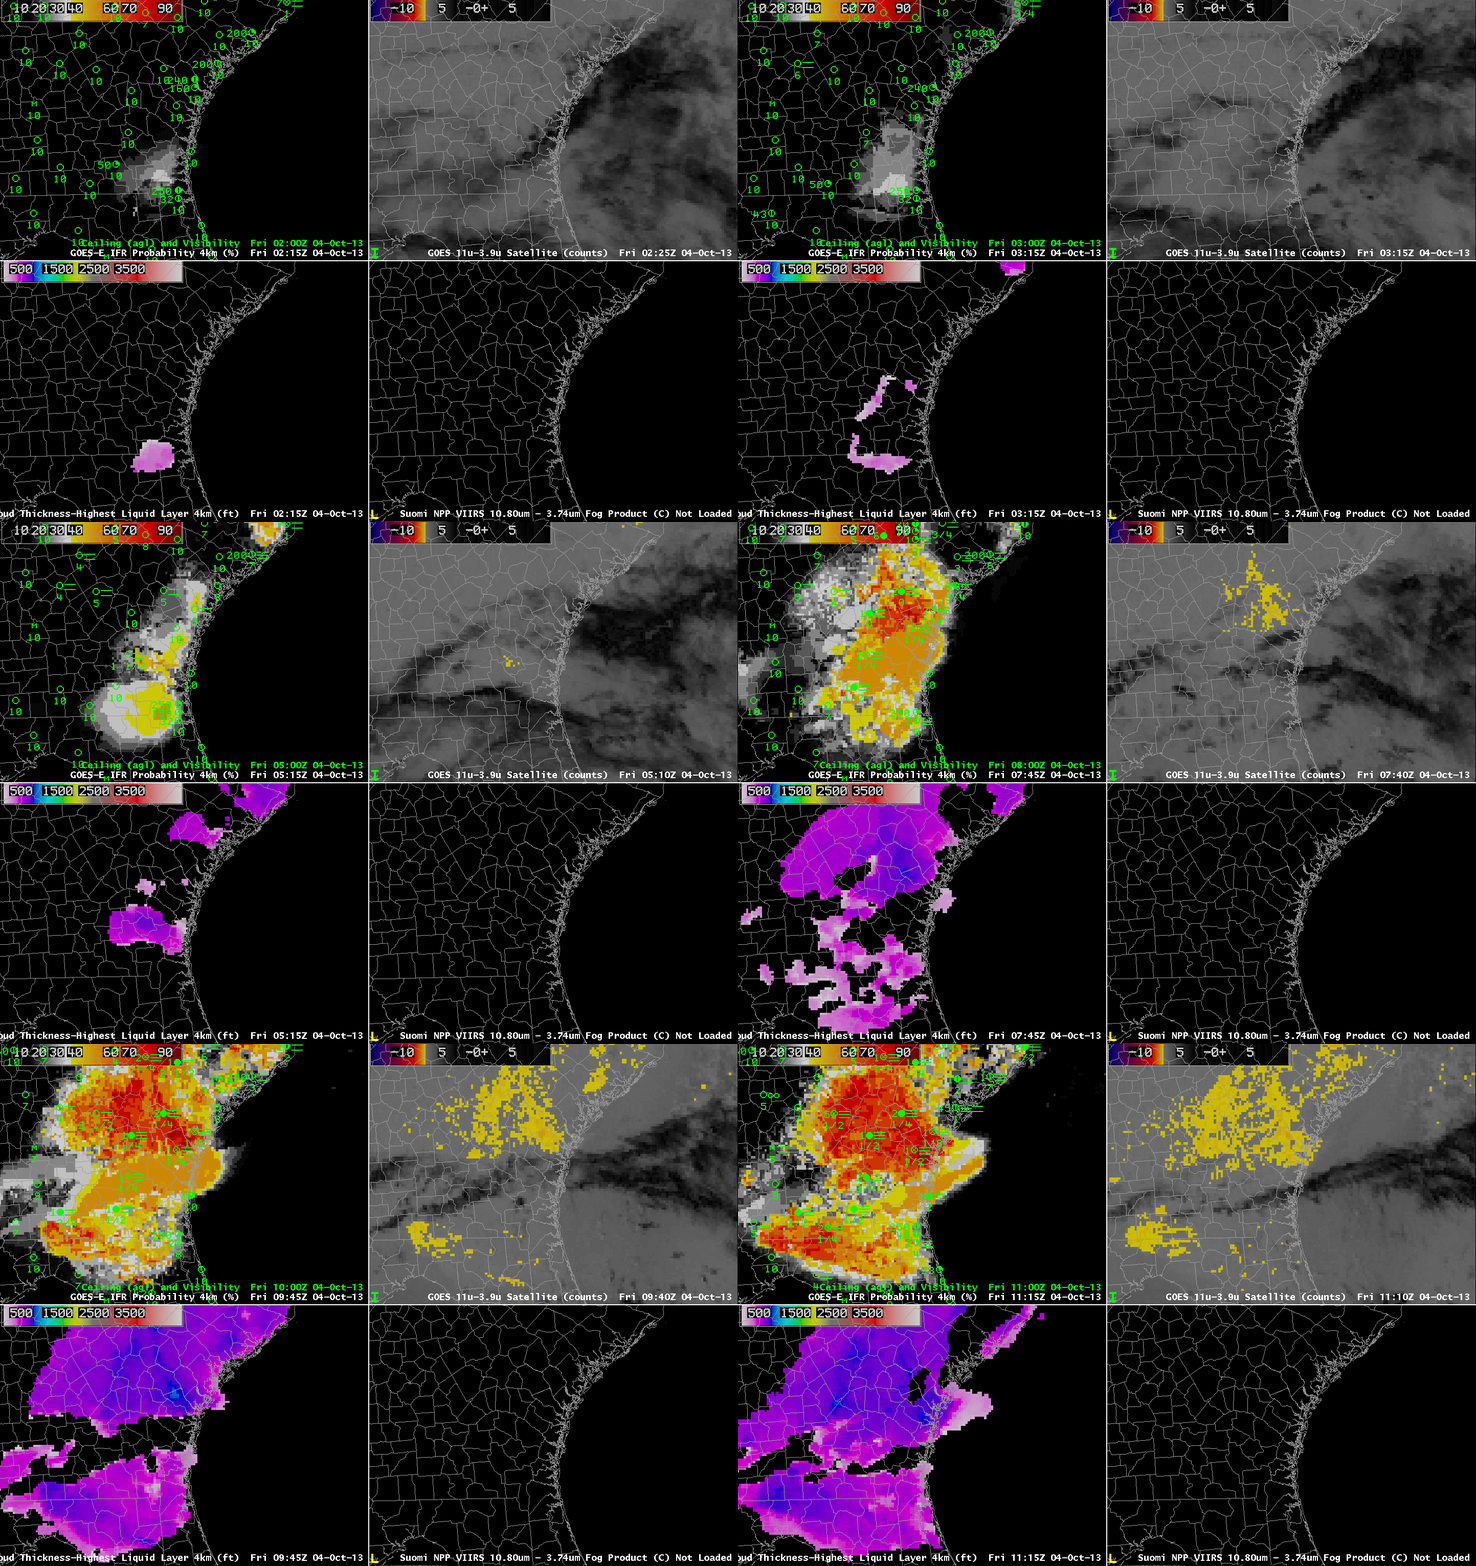
GOES-13-based GOES-R IFR Probabilities (Upper Left), GOES-13 Brightness Temperature Difference Product (10.7 µm – 3.9 µm) (Upper Right), GOES-13-based GOES-R Cloud Thickness (Lower Left), Suomi/NPP Brightness Temperature Difference (Lower Right), all times as indicated (click image to enlarge)
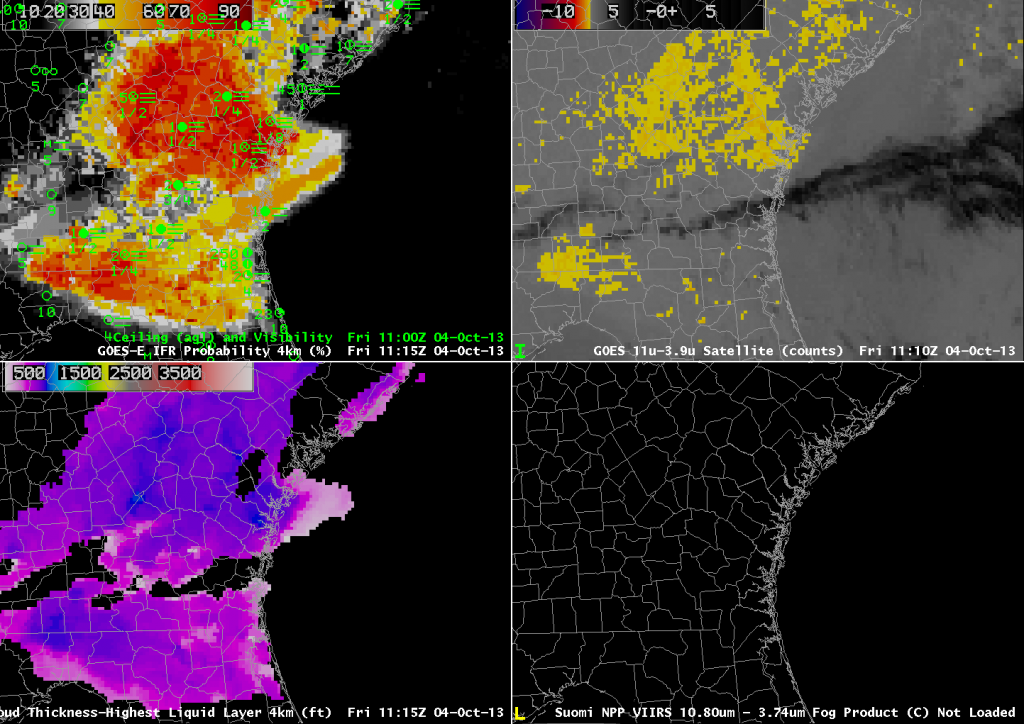
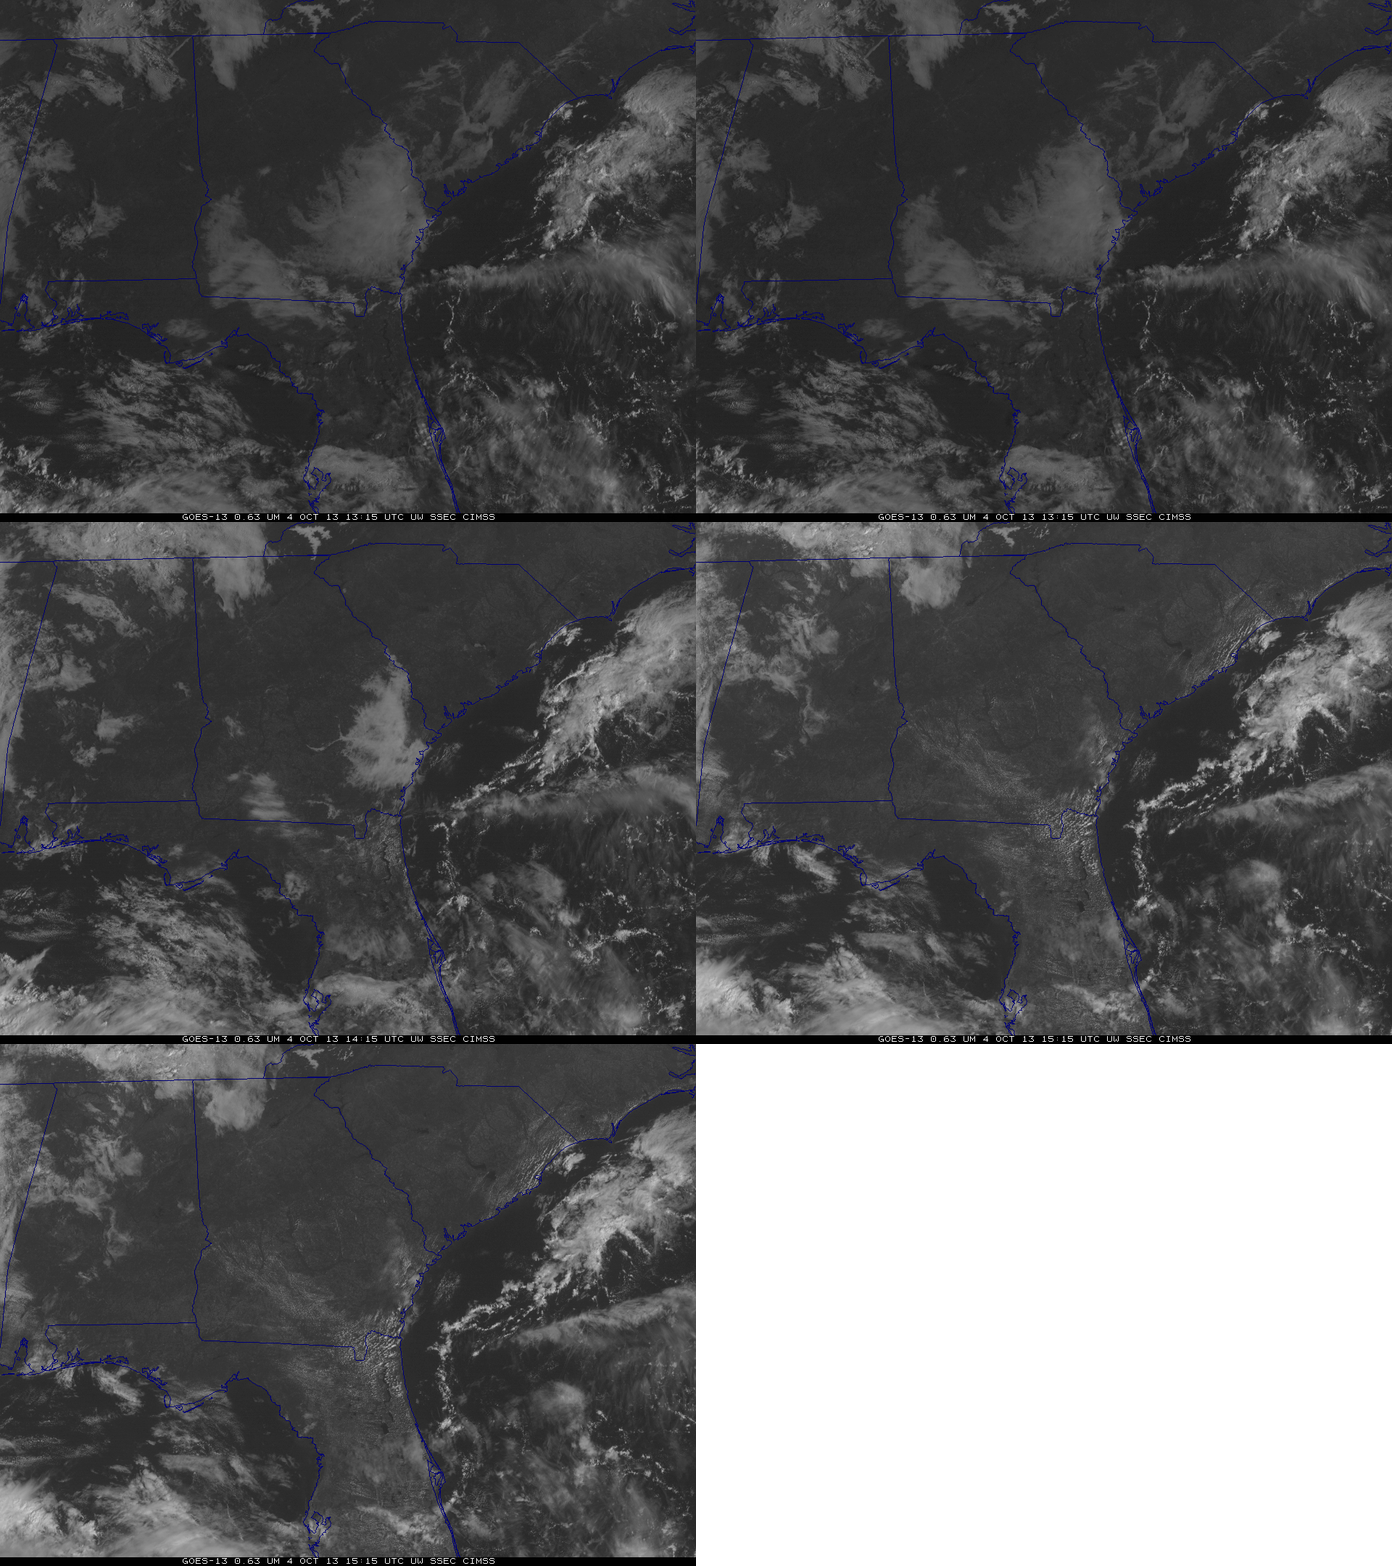
High Pressure of the southeast US allowed for clear skies and light winds overnight, and radiation fog developed over coastal portions of eastern Georgia. Because high clouds were present, the traditional method for detecting fog and low stratus, the brightness temperature difference between 10.7 µm and 3.9 µm on GOES could not capture the entire areal extent of the cloud. Fog is initially reported in eastern Georgia where IFR Probabilities are increasing underneath an ice-phase cloud deck that prevents the GOES satellite from seeing the development of low clouds and fog. Accordingly, the IFR probabilities are lower than they would be if satellite data were included. The uniform nature of the field is testament to the use of Rapid Refresh Data to drive the IFR Probability field. Shortly after 0600 UTC, a satellite signal develops over South Carolina as the high clouds shift to the south. When this happens, IFR probabilities increase (and acquire a more pixelated look). Regions under high clouds with IFR conditions persist through the end of the loop, however. It’s important to have a fused data product that allows two different complementary fields to diagnose where IFR conditions are likely. Where the brightness temperature difference cannot be used, Rapid Refresh Data gives vital information. Where brightness temperature difference data can be used, the Rapid Refresh Data can fine-tune things.
The 1115 UTC image, above, shows the GOES-R cloud thickness just before twilight conditions that accompany sunrise prohibit its computation. The cloud thickness in a radiation fog is related to dissipation time, and the cloud thickness is shown to be quite thin: Thickest values, in blue, are around 800 to 900 feet. This scatterplot relates cloud thickness to dissipation time, and it suggests a dissipation time of 1-2 hours. However, the visible imagery animation, below, shows actual dissipation occurred shortly after 1500 UTC. Note that there is considerable spread in that predictive scatterplot.
GOES-R IFR Probabilities with the new GOES-East (GOES-14)
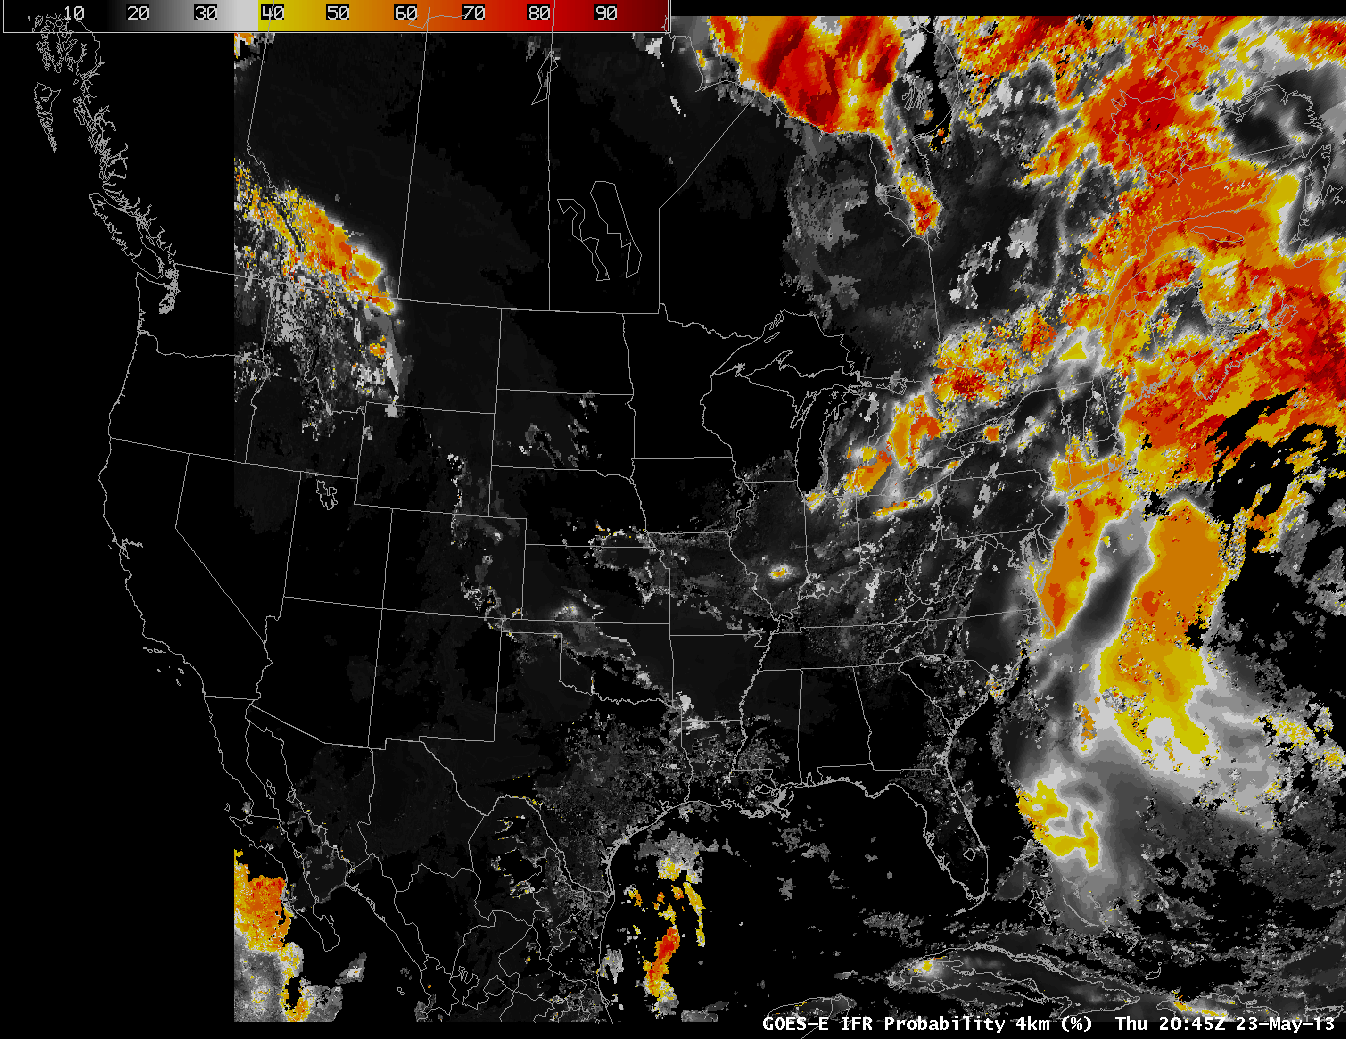 |
| GOES-R IFR Probabilities computed using GOES-14, 2045 UTC 23 May 2013 |
GOES-R IFR Probabilities computed using the ‘new’ GOES-East, GOES-14, are now available in AWIPS. Note that GOES-14 is positioned over 105.5 W, versus 75 W for GOES-13. The most likely region for fog, over the shelf waters of the Atlantic Ocean off the mid-Atlantic Coast and in the Gulf of Maine, corresponds to regions where air with dewpoints in the 60s is moving over still-cold ocean waters. Advection fog results.
 |
| As above, but with visibilities/ceilings over New York and surroundings. |
Introduction
This is a parking place for GOES-R Fog Product examples. GOES-R Fog/Low Stratus products fuse data from the Rapid Refresh and Satellite data to produce a quantitative estimate of fog probabilities.

