Fog was anticipated to develop over the coastal sections of Texas and Louisiana starting late on Oct 31 2012. From the 0149 UTC 1 November Houston Forecast Discussion: The 0921 UTC Forecast Discussion from Lake Charles (above) describes increasing fog possibilities — and the 0453 UTC AFD (below) mentions patchy fog.
For both WFOs, the GOES-R IFR Probability field shows a good picture of the evolving fog/low stratus as it develops.
000
FXUS64 KHGX 010149
AFDHGX

AREA FORECAST DISCUSSION
NATIONAL WEATHER SERVICE HOUSTON/GALVESTON TX
849 PM CDT WED OCT 31 2012

.DISCUSSION...
CURRENT FCST IS ON TRACK. ONLY TWEAKS TO GRIDS WERE TO MOVE UP
TIMING OF FOG FORMATION. WOULDN`T DOUBT IF A DENSE FOG ADVSY
MIGHT BE REQUIRED FOR SOME LOCATIONS...ESP SW. WILL KEEP AN EYE ON
TRENDS. DIFFUSE WIND SHIFT AND SLIGHTLY LOWER DEWPOINTS WILL
PROBABLY MOVE INTO NE ZONES LATER TONIGHT THEN STALL/WASHOUT.
000
FXUS64 KLCH 010921
AFDLCH

AREA FORECAST DISCUSSION
NATIONAL WEATHER SERVICE LAKE CHARLES LA
421 AM CDT THU NOV 1 2012

.DISCUSSION...TRAPPED LOW LEVEL MOISTURE AND CLEAR SKIES HAVE
ALLOWED AREAS OF FOG TO DEVELOP THIS MORNING ACROSS THE CWA. AT THIS
TIME PATCHY DENSE FOG HAS ALSO DEVELOPED IN CALCASIEU PARISH AND
JEFFERSON COUNTY. VISIBILITIES ARE SLOWLY DROPPING ELSEWHERE AND
IF CONDITIONS CONTINUE TO DETERIORATE A DENSE FOG ADV MAY BE NEEDED
THIS MORNING.
The 0921 UTC Forecast Discussion from Lake Charles (above) describes increasing fog possibilities — and the 0453 UTC AFD (below) mentions patchy fog.
000
FXUS64 KLCH 010453
AFDLCH

AREA FORECAST DISCUSSION
NATIONAL WEATHER SERVICE LAKE CHARLES LA
1153 PM CDT WED OCT 31 2012

.DISCUSSION...
01/06Z TAF ISSUANCE.

&&

.AVIATION...
FEW CHANGES TO THE TAFS THIS EVENING WITH WINDS NEARLY CALM ACRS
THE AREA. T/TD SPREAD NARROWING AT BPT AND LCH AND COULD SEE SOME
PATCHY FOG DEVELOP AT THESE SITES WITHIN THE NEXT HOUR OR TWO.
CANNOT RULE OUT FOG AT OTHER TAF SITES...BUT EXPECT ONSET A LITTLE
LATER AS DEWPOINT DEPRESSIONS ARE SLIGHTLY LARGER. VFR CONDITIONS
EXPECTED TO PREVAIL WITH THE EXCEPTION OF PERIODIC MVFR OR BRIEF
IFR VISBYS BETWEEN NOW AND 14Z. LT WINDS WILL GRADUALLY BECOME
SWLY THURS AFTN. 24
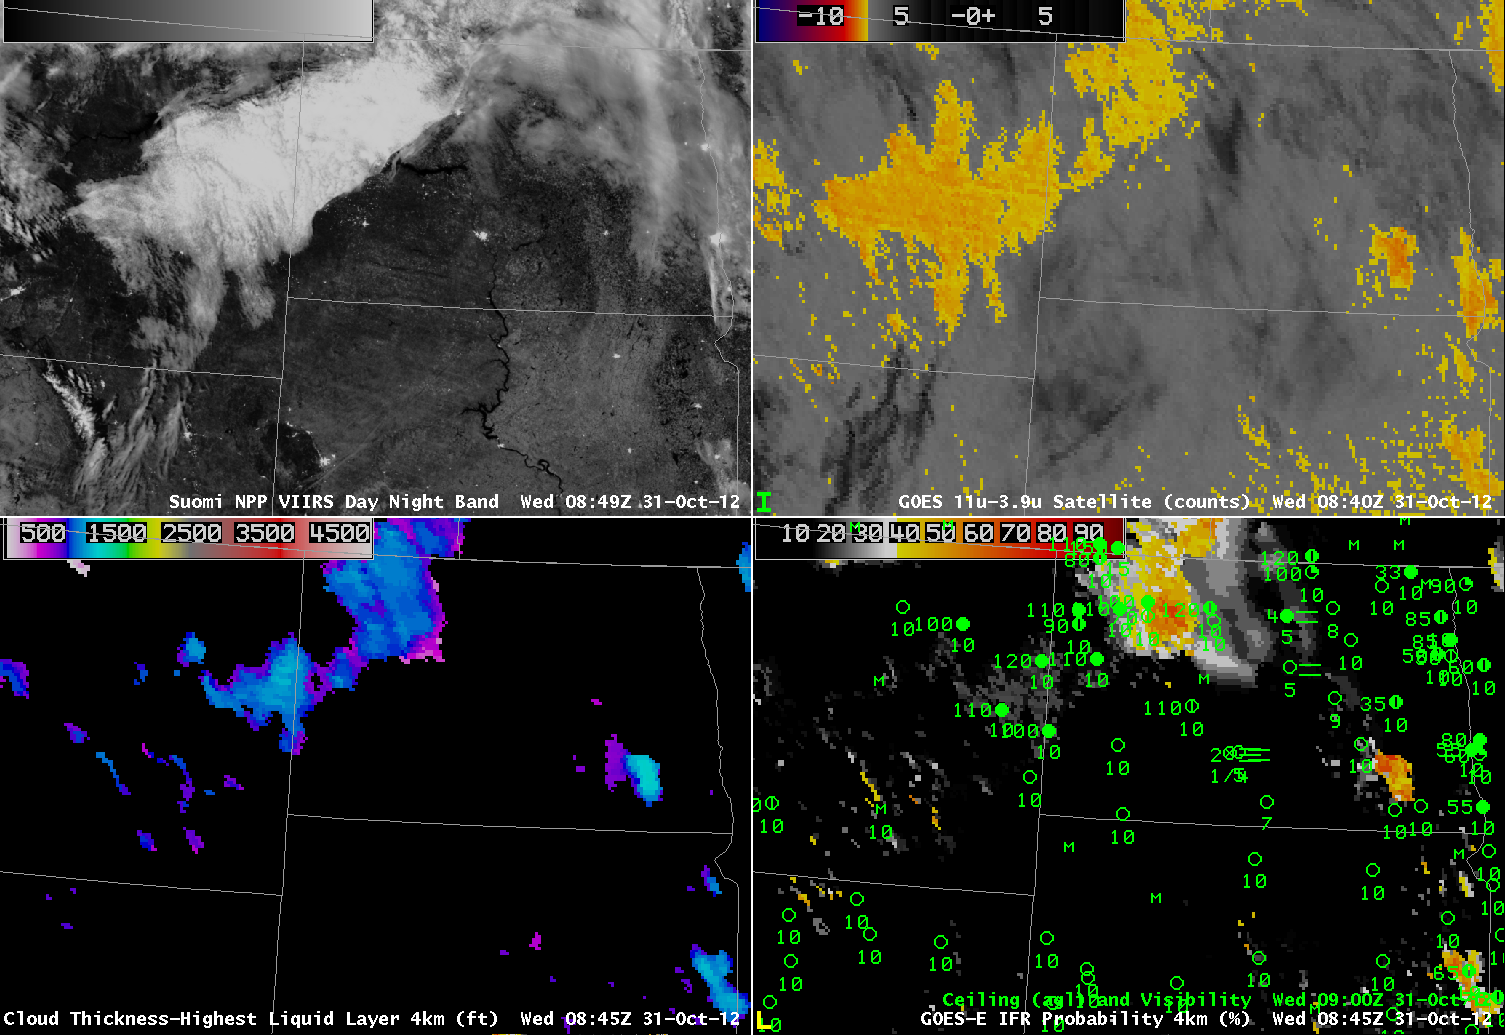
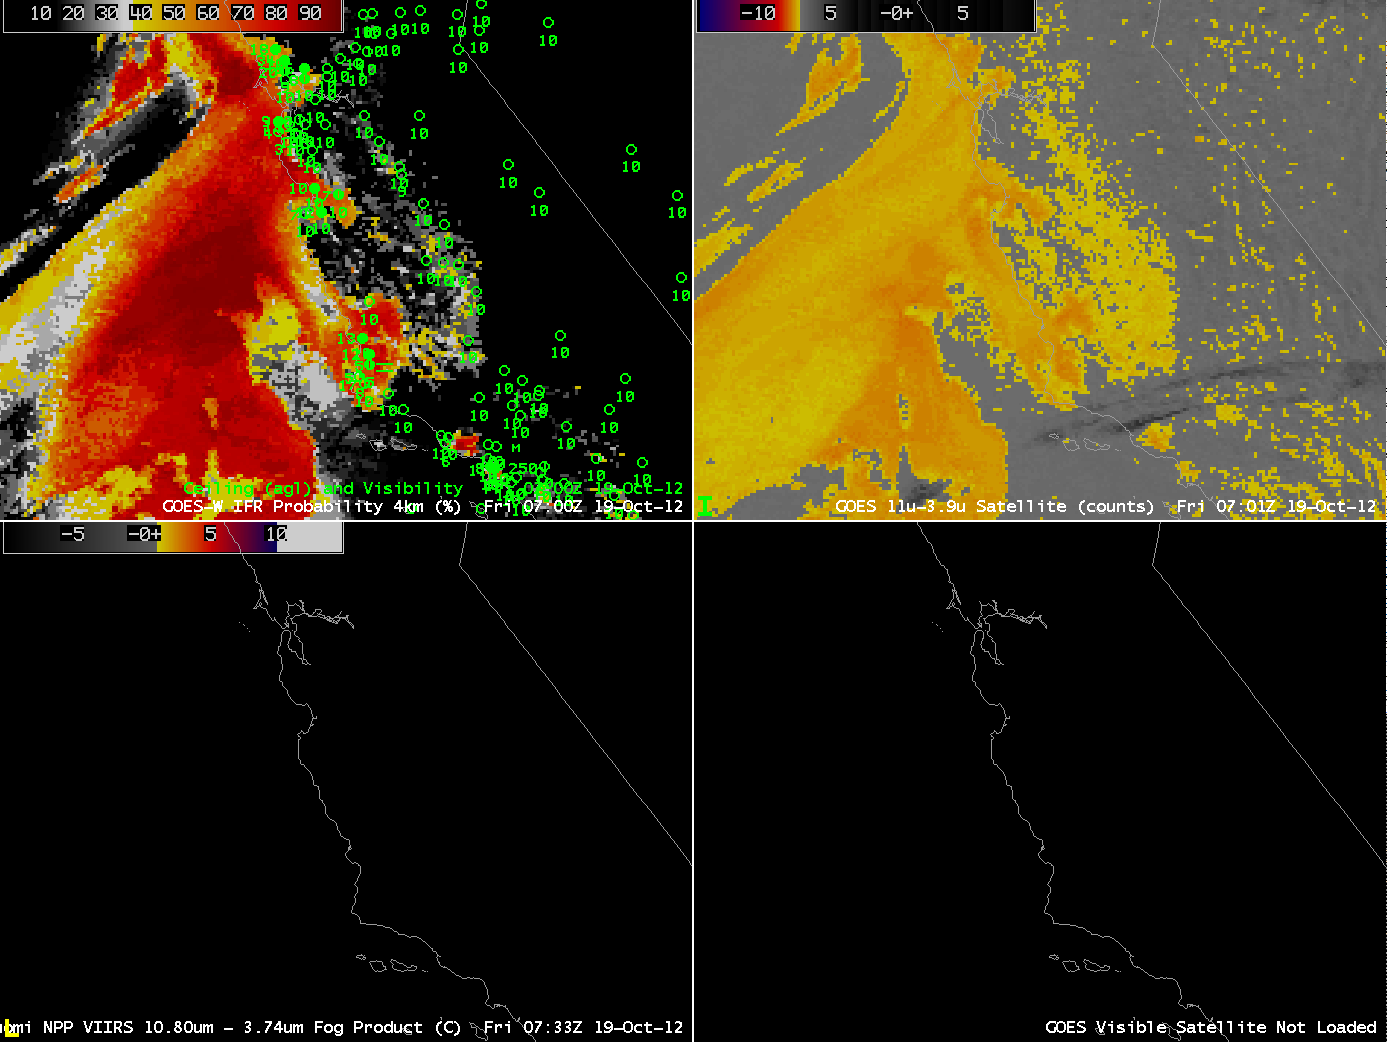
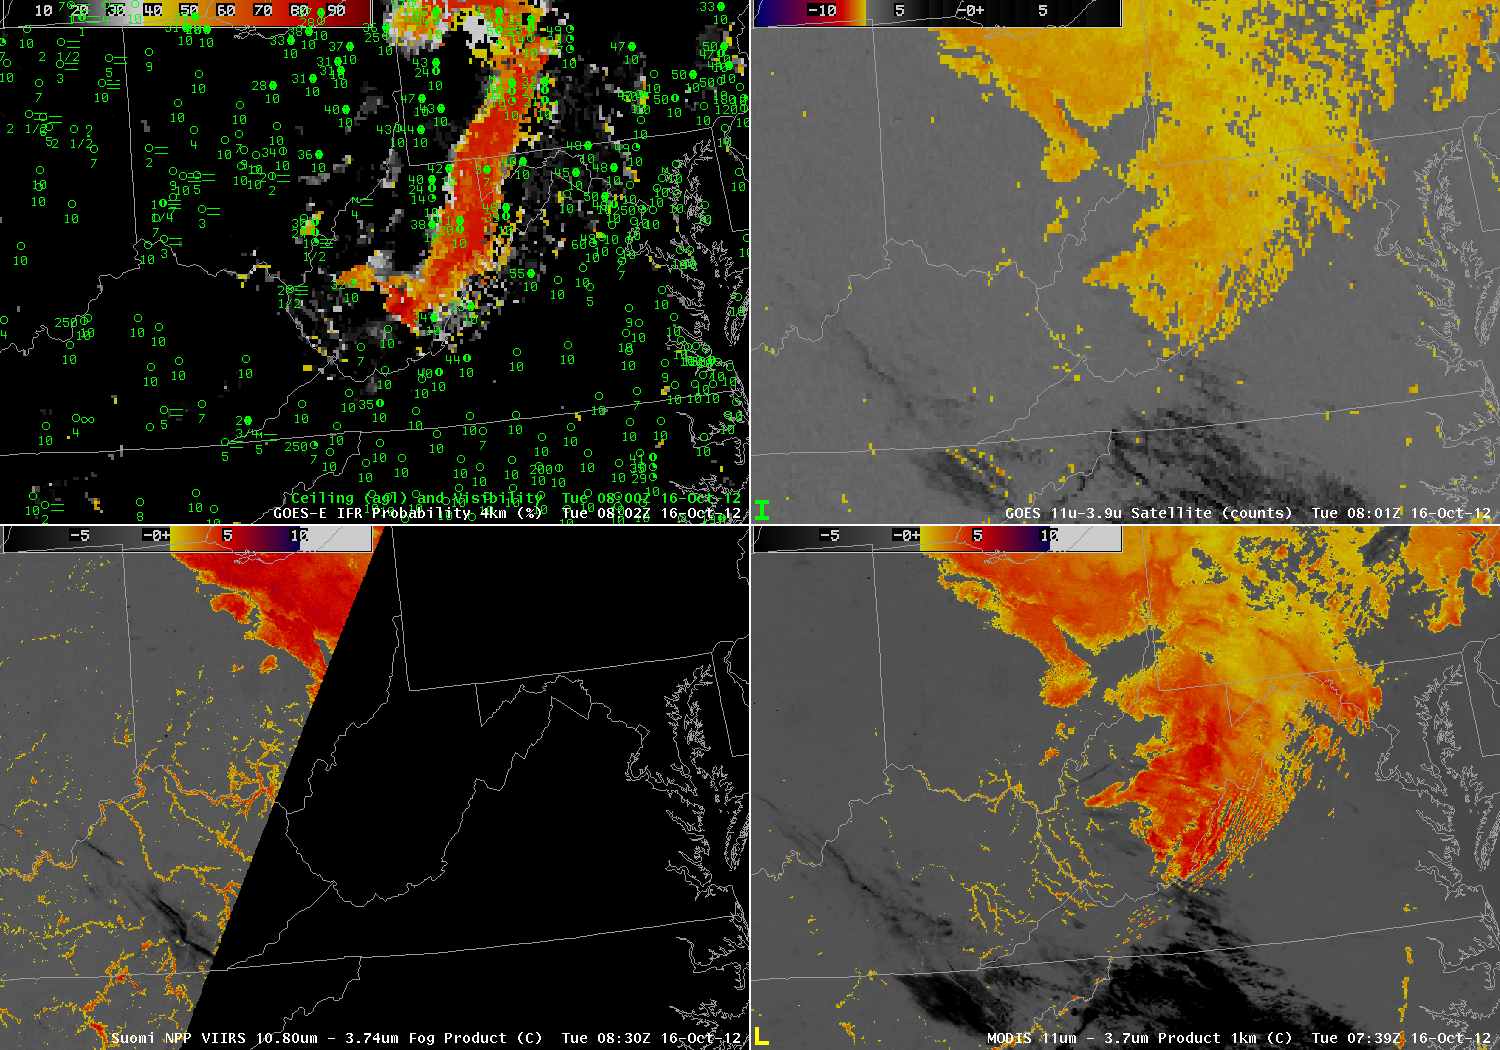
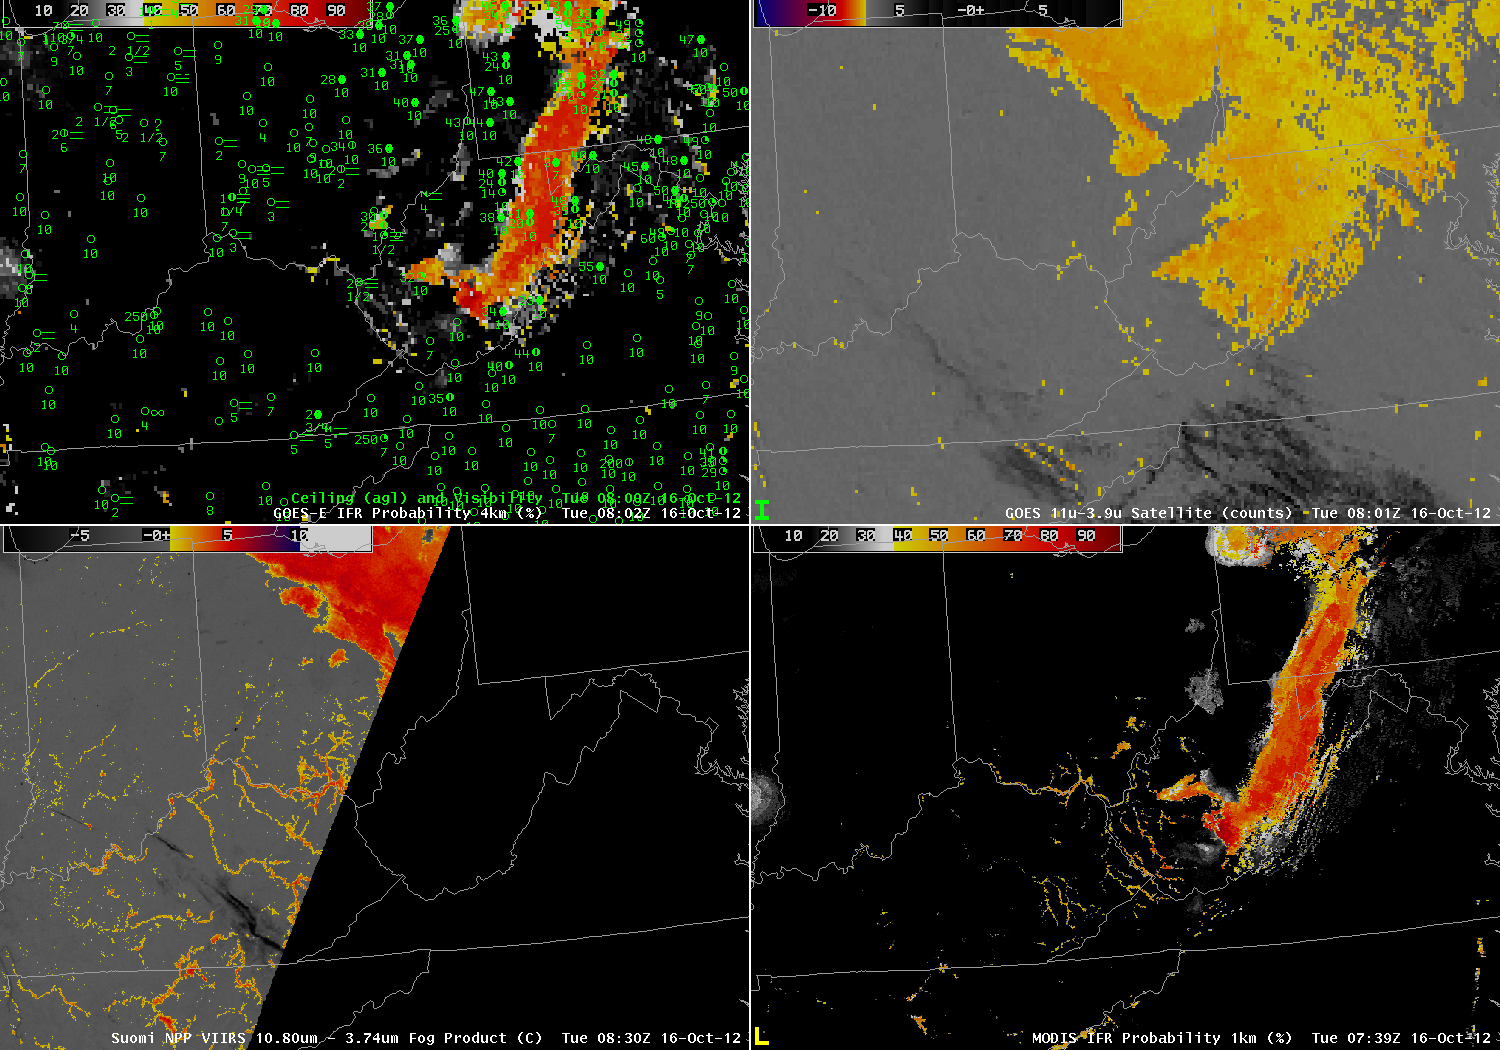
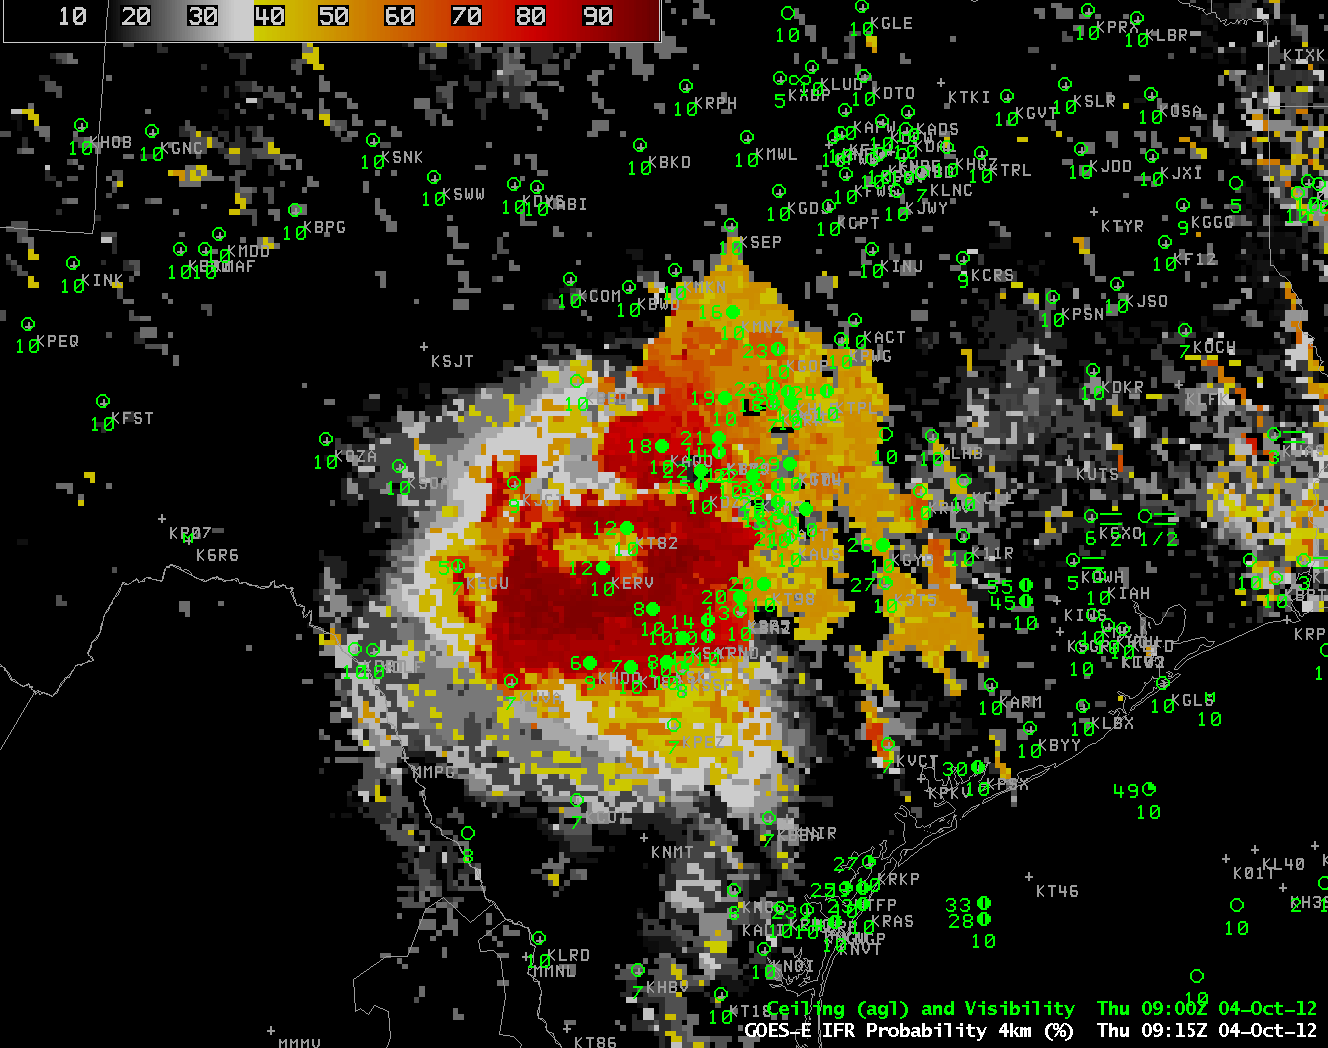
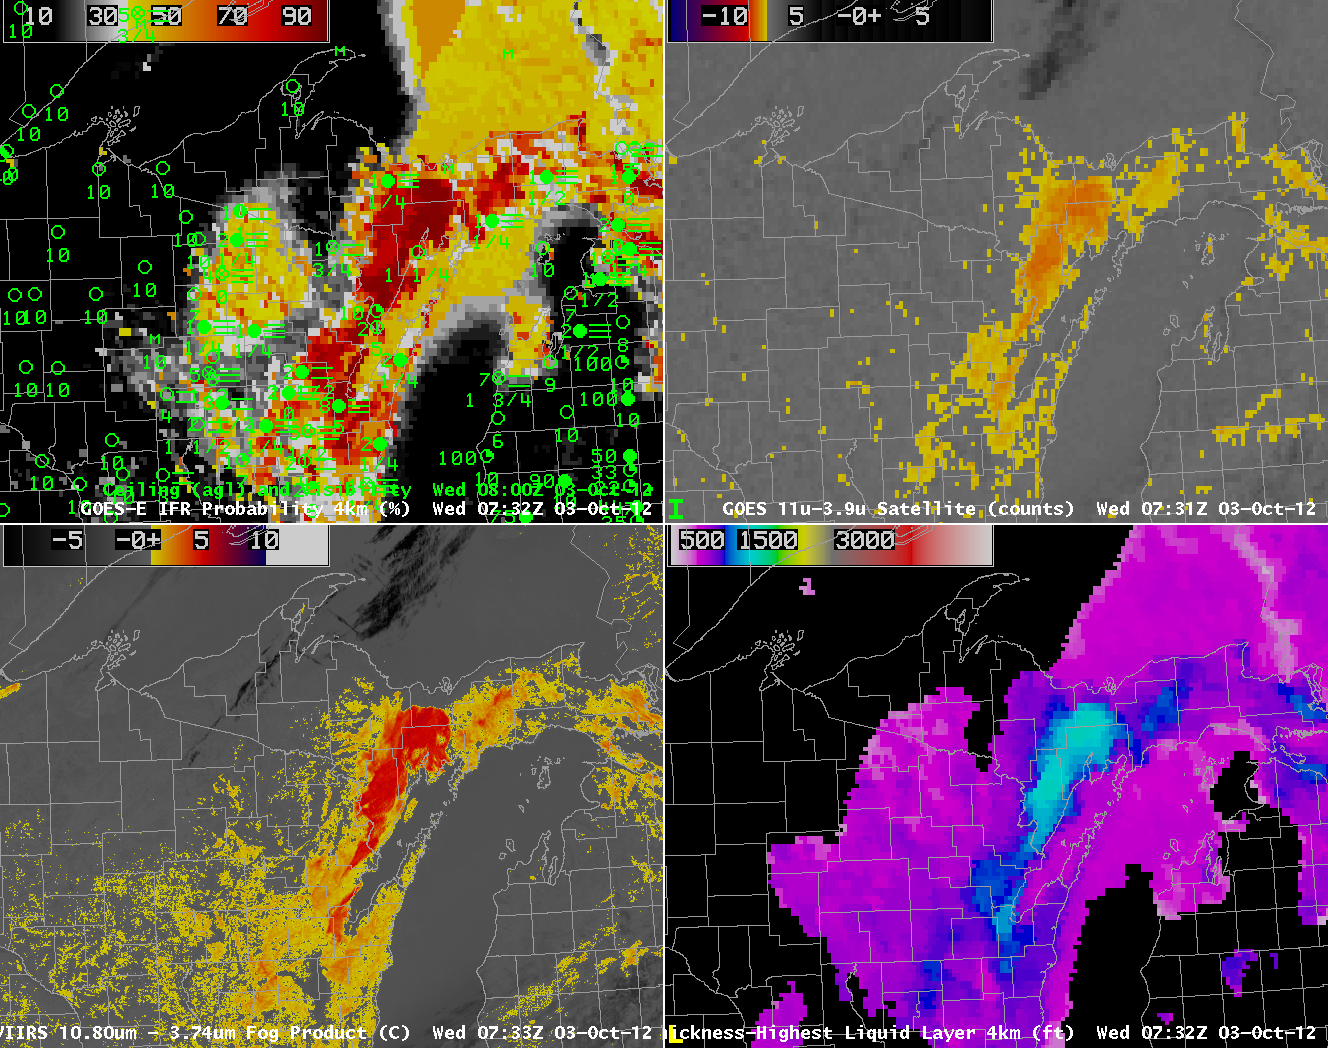
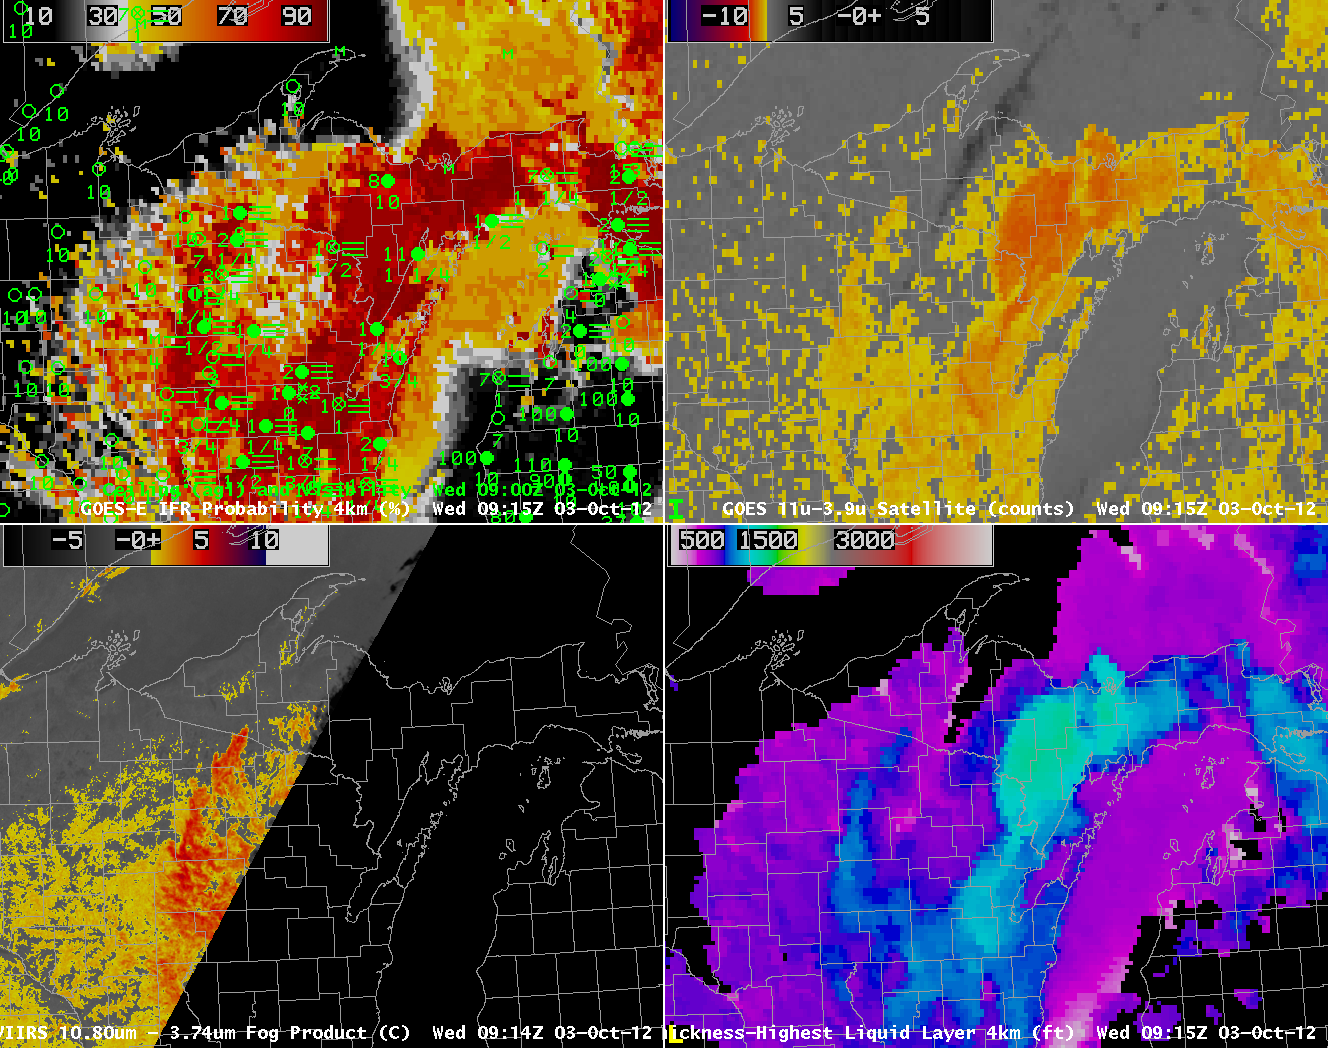
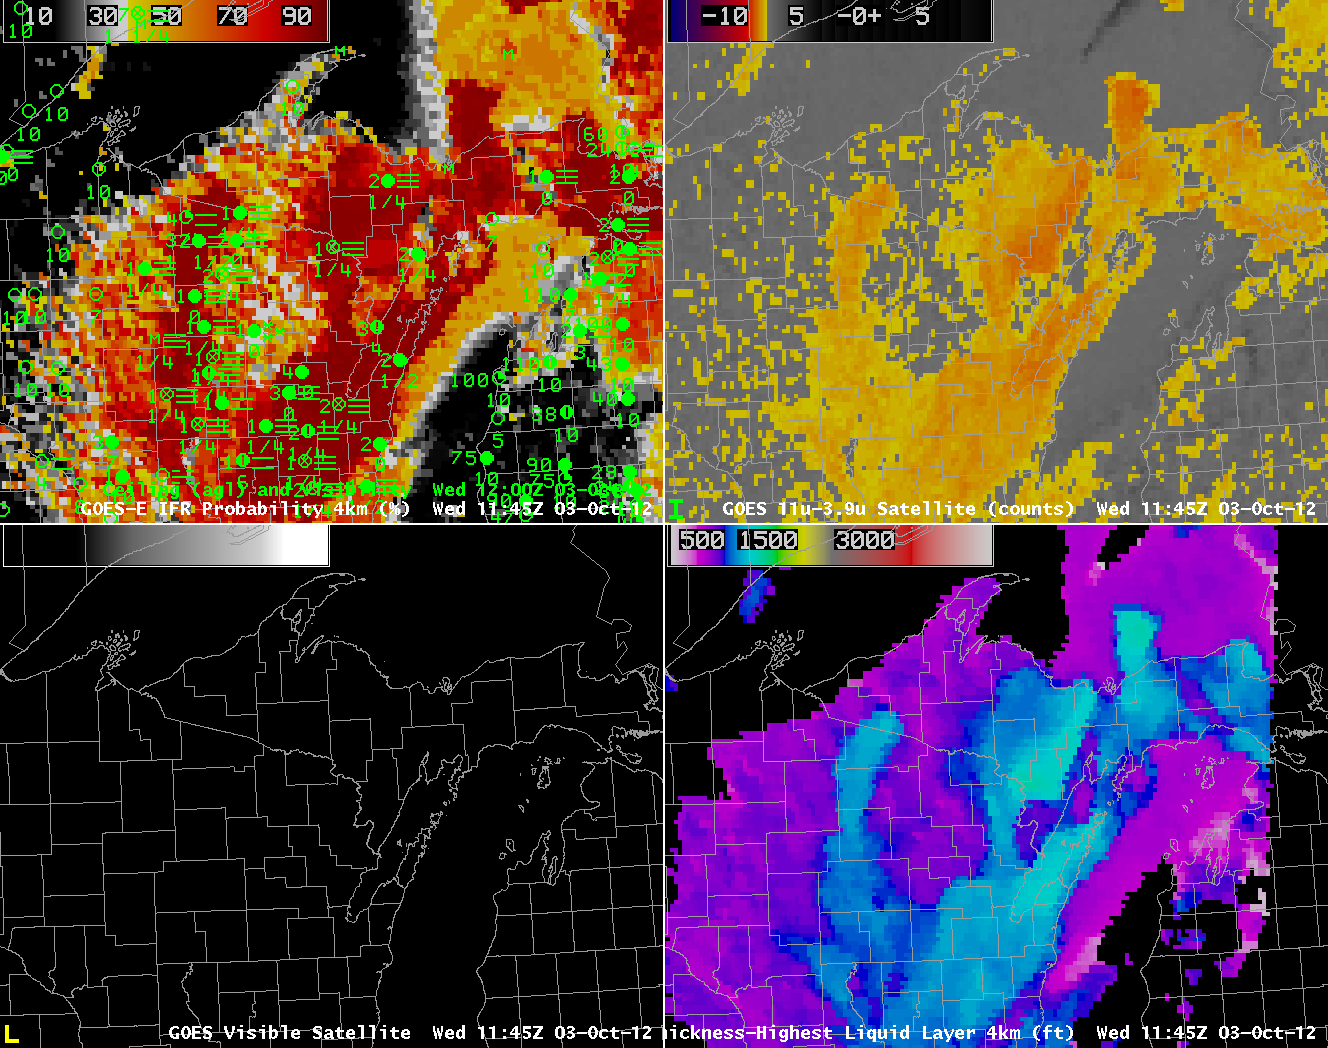
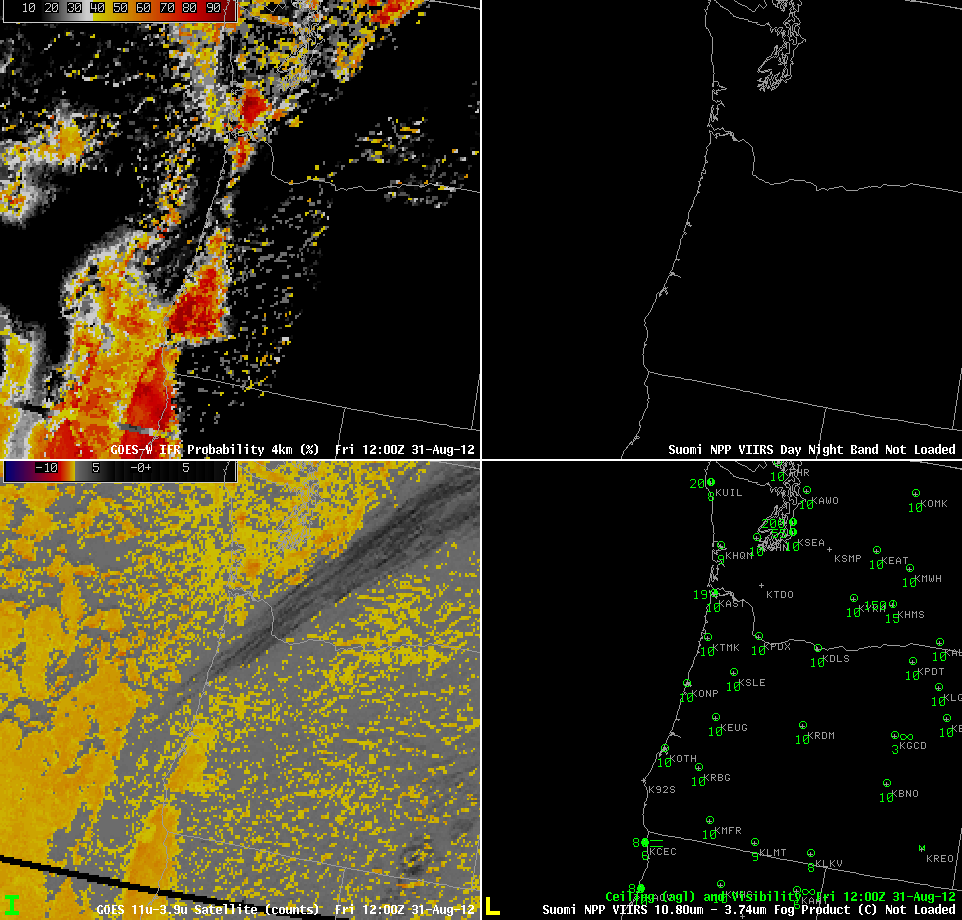
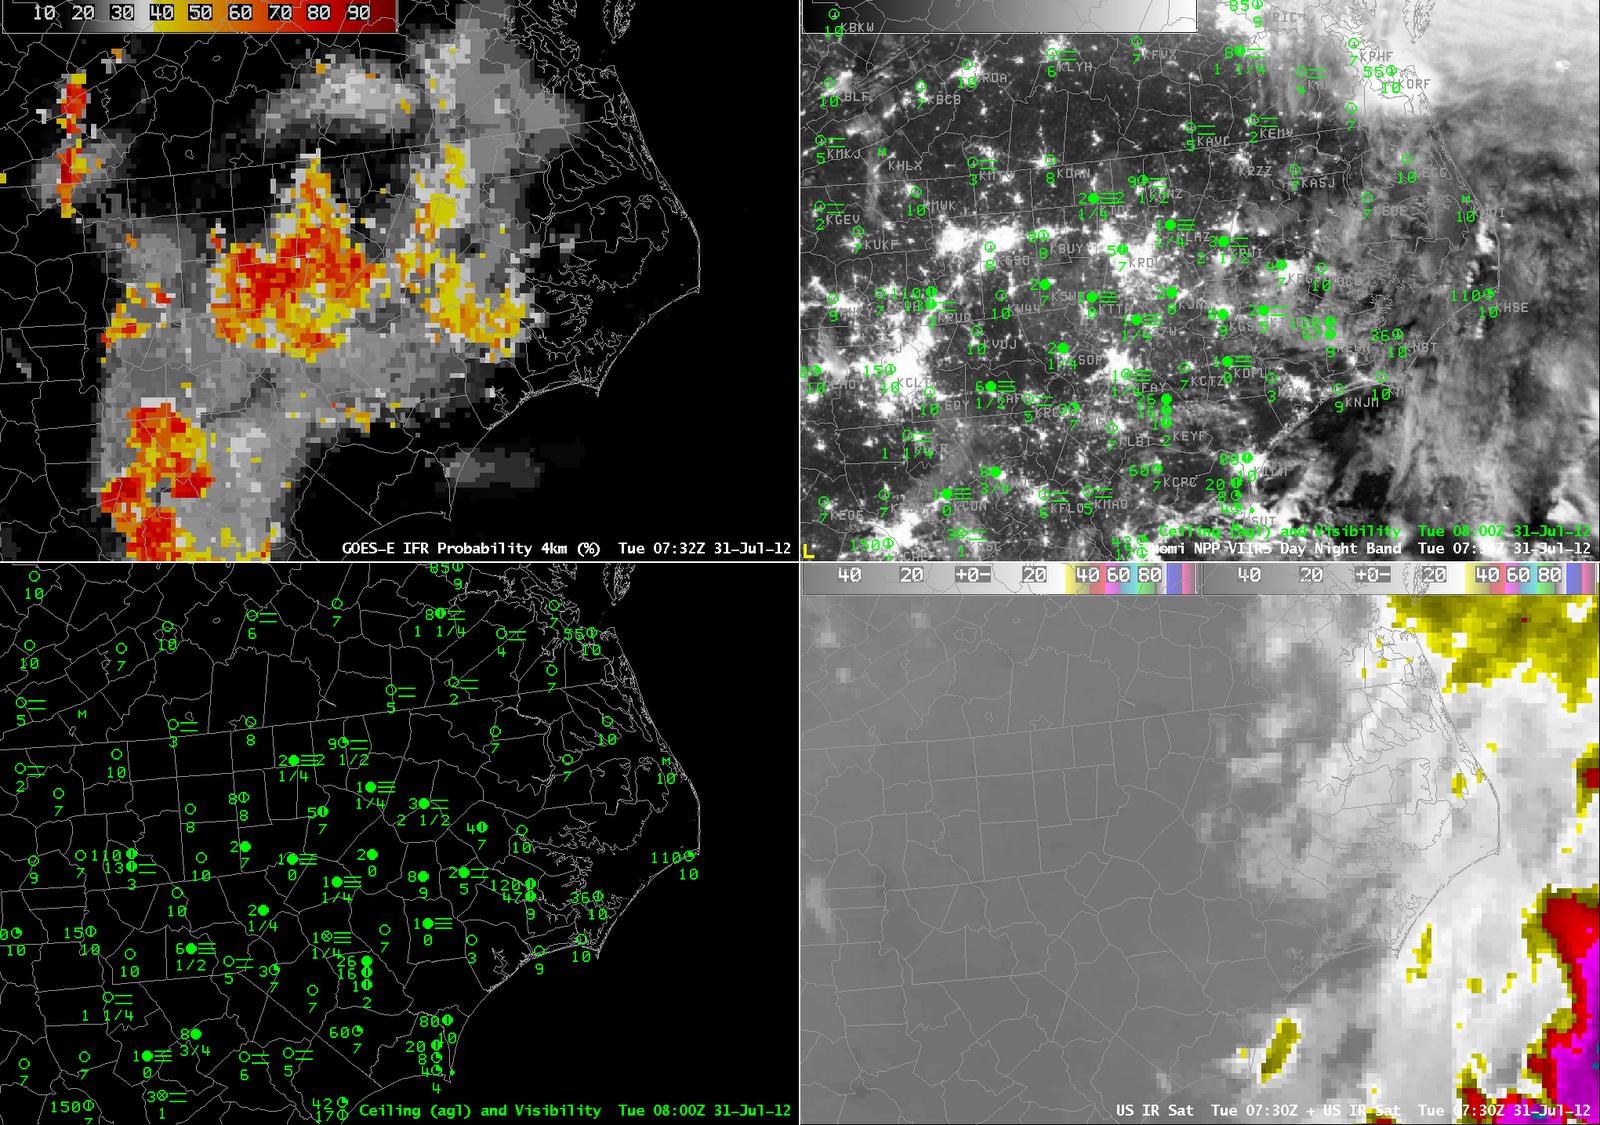
For both WFOs, the GOES-R IFR Probability field shows a good picture of the evolving fog/low stratus as it develops. The every-hour loop below, starting at 0315 UTC, shows the steady increase in probabilities along the Louisiana and Texas Gulf Coasts. Note the relatively low probabilities in and around Houston — an apparent break between IFR conditions to the north and east and those to the south. The Houston airport observations did not fall to IFR criteria although those criteria were common to the north and south. Also, the IFR probabilities downplay the brightness temperature difference signal over central Texas where IFR conditions do not occur.
 |
| GOES-R IFR Probabilities computed from GOES-East (upper left), Traditional Brightness temperature Difference product (10.7 µm – 3.9 µm) (upper right), GOES-R IFR Probabilities computed from MODIS (lower left), Suomi/NPP Day/Night Band (lower left) |
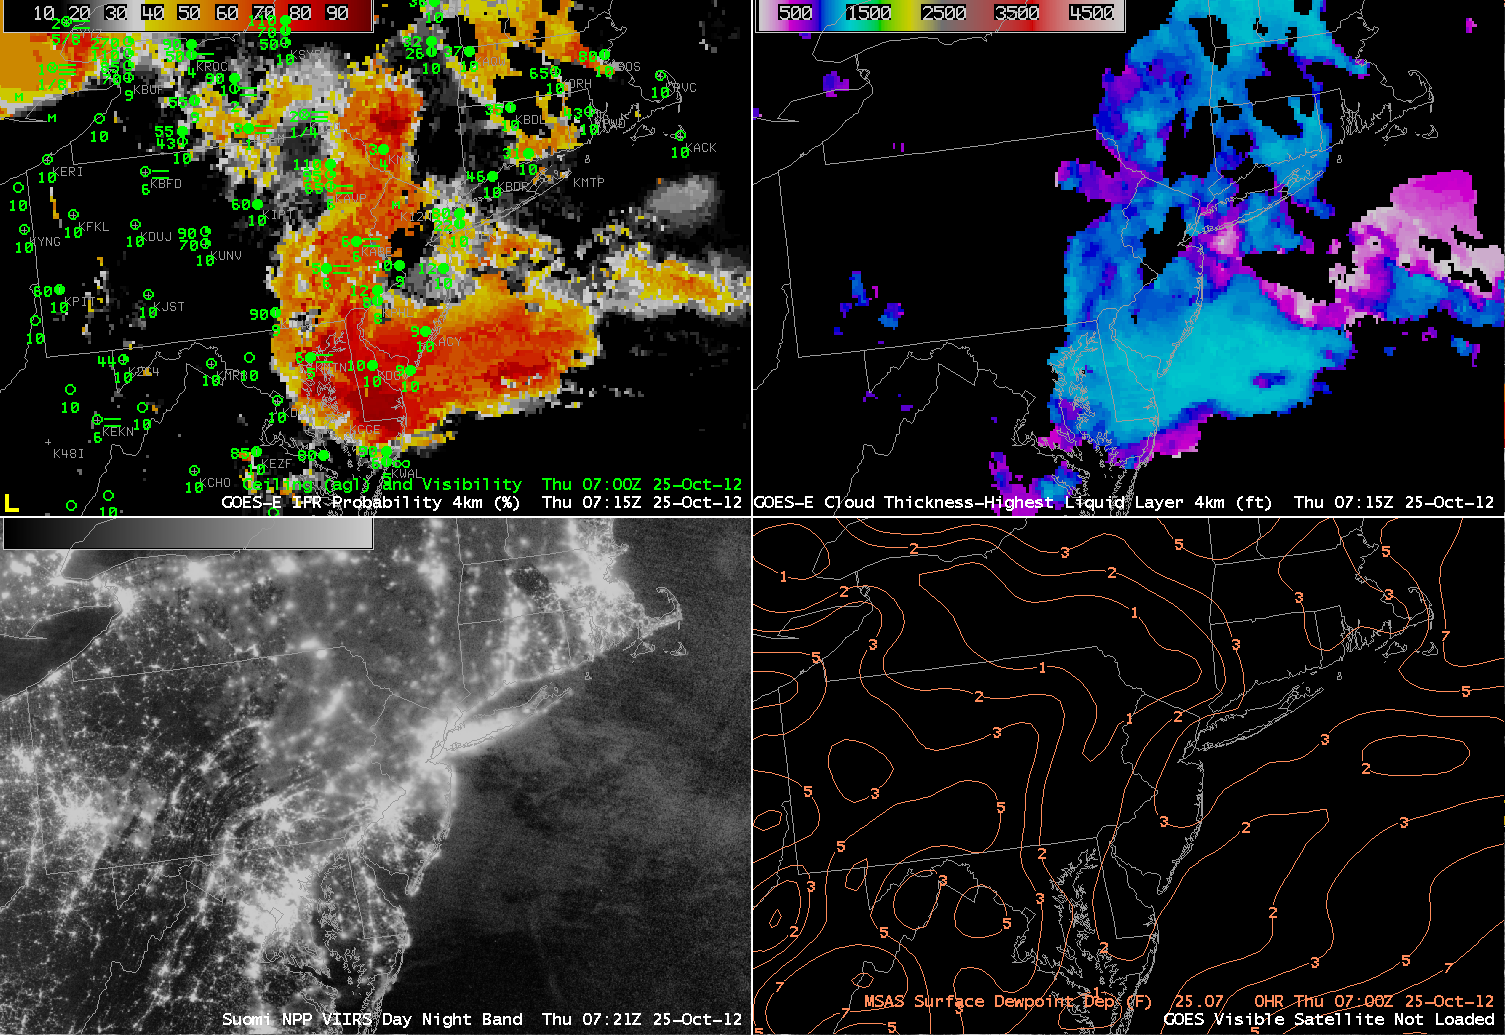
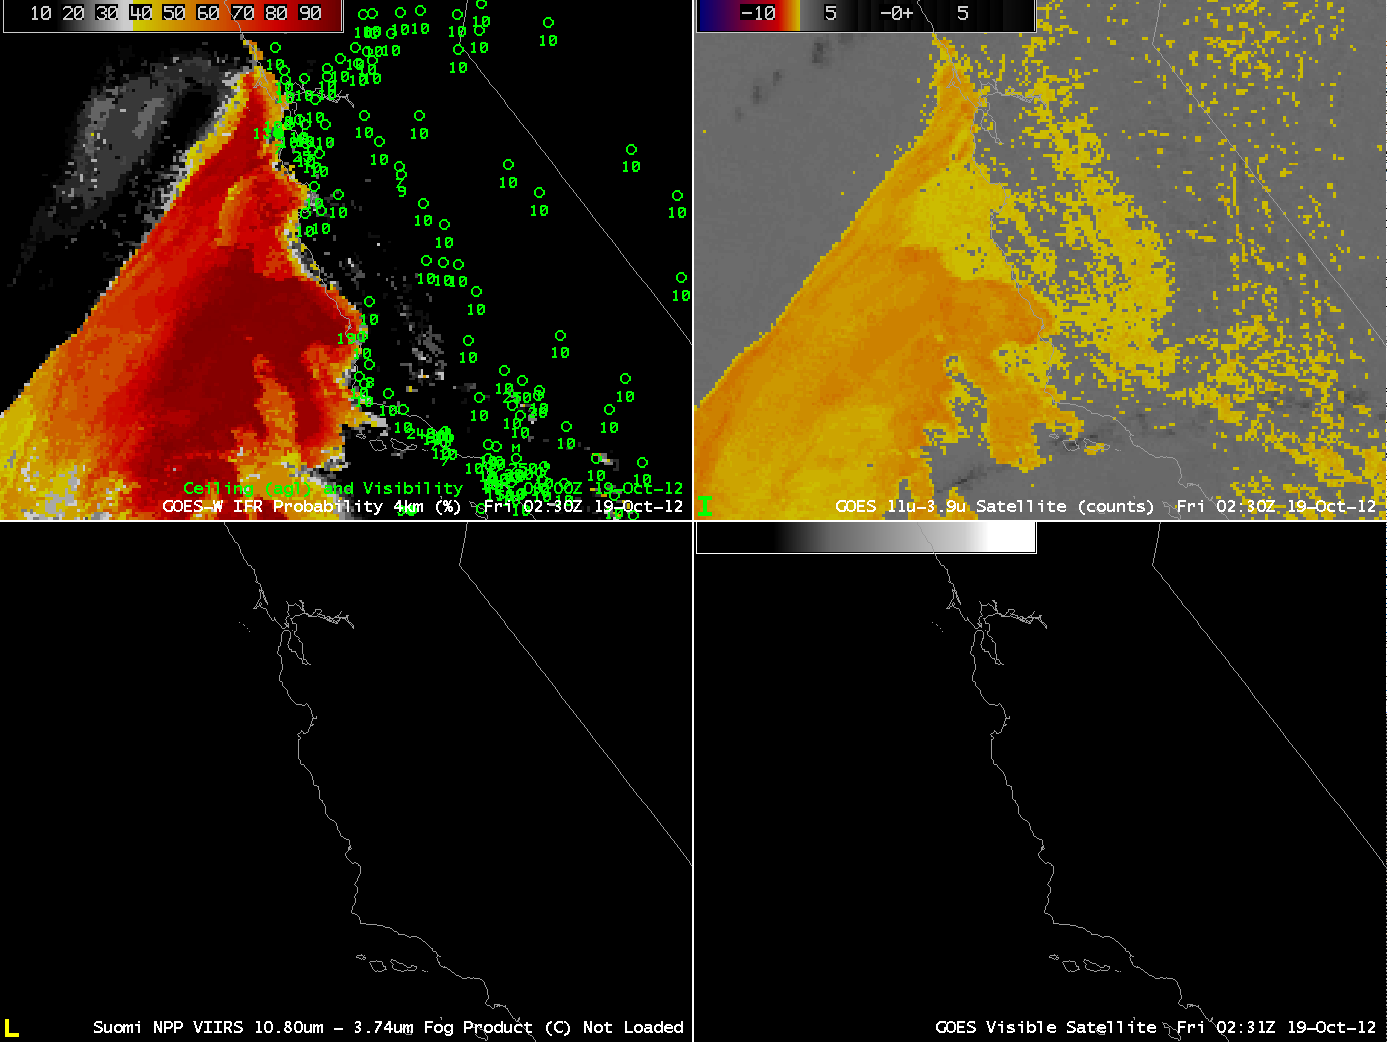
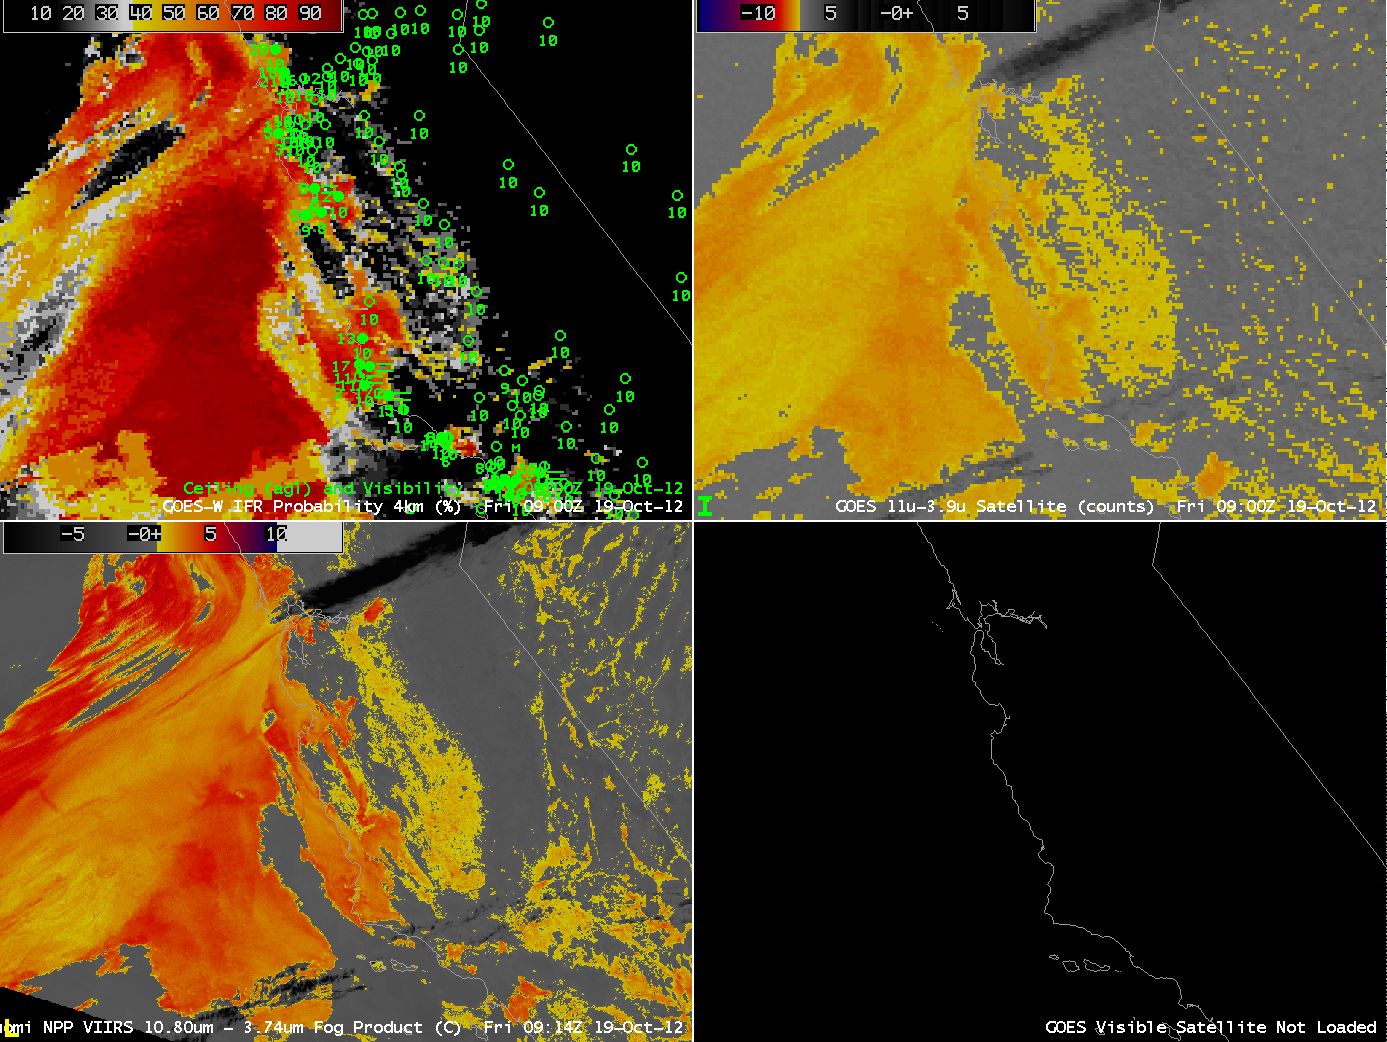
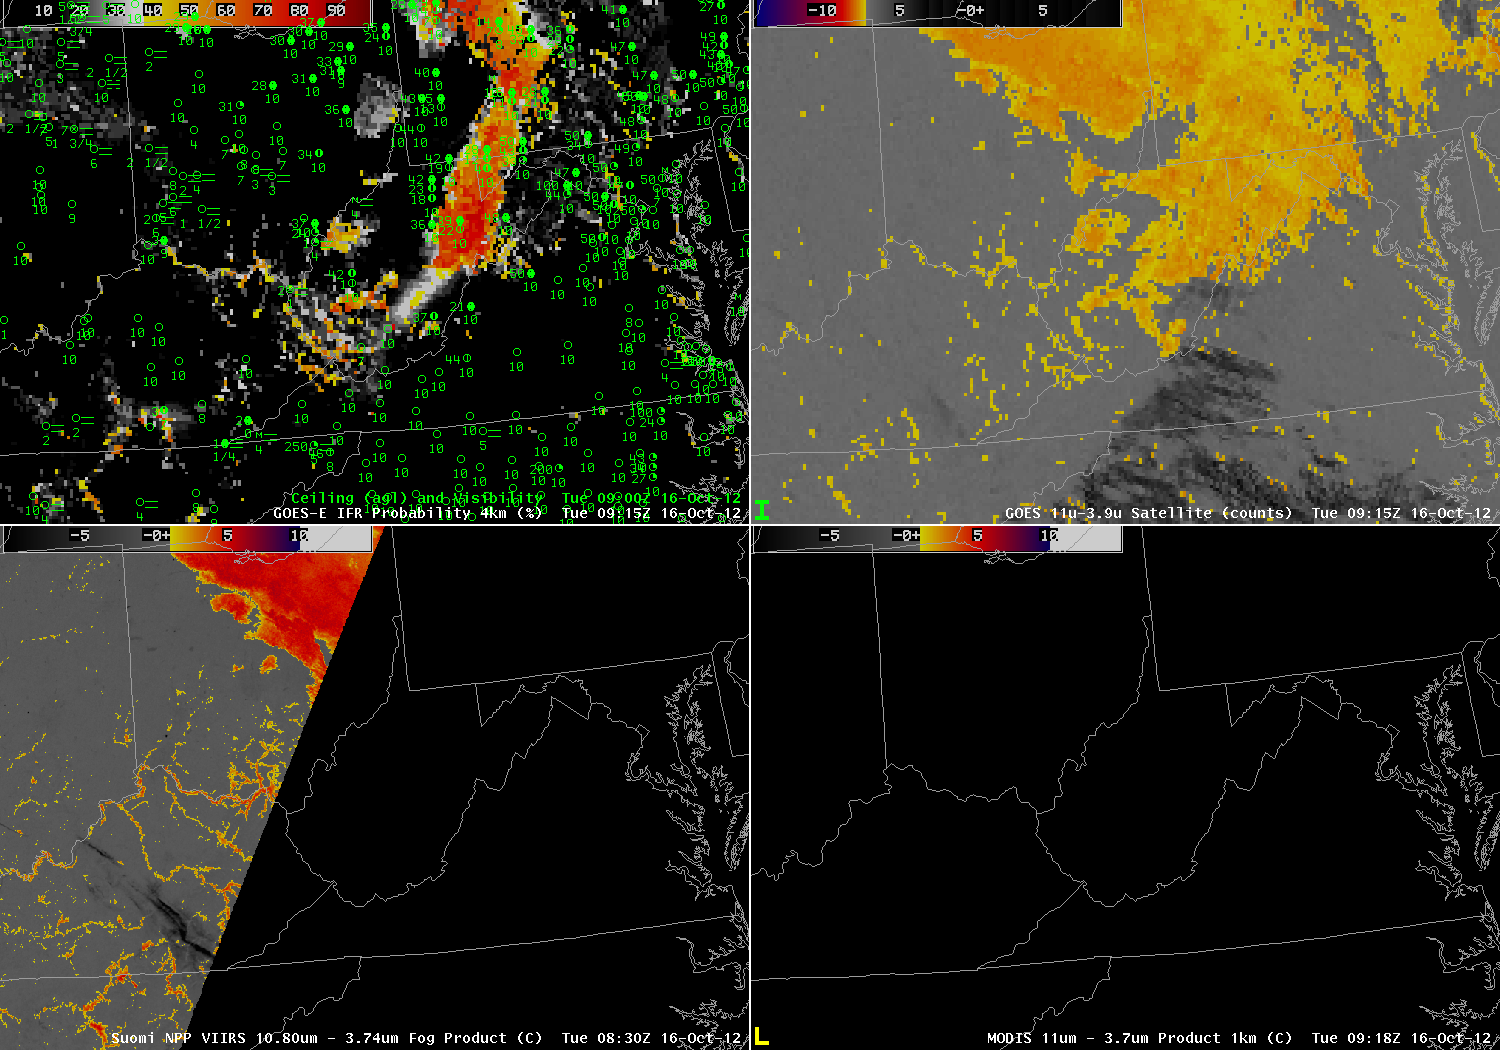
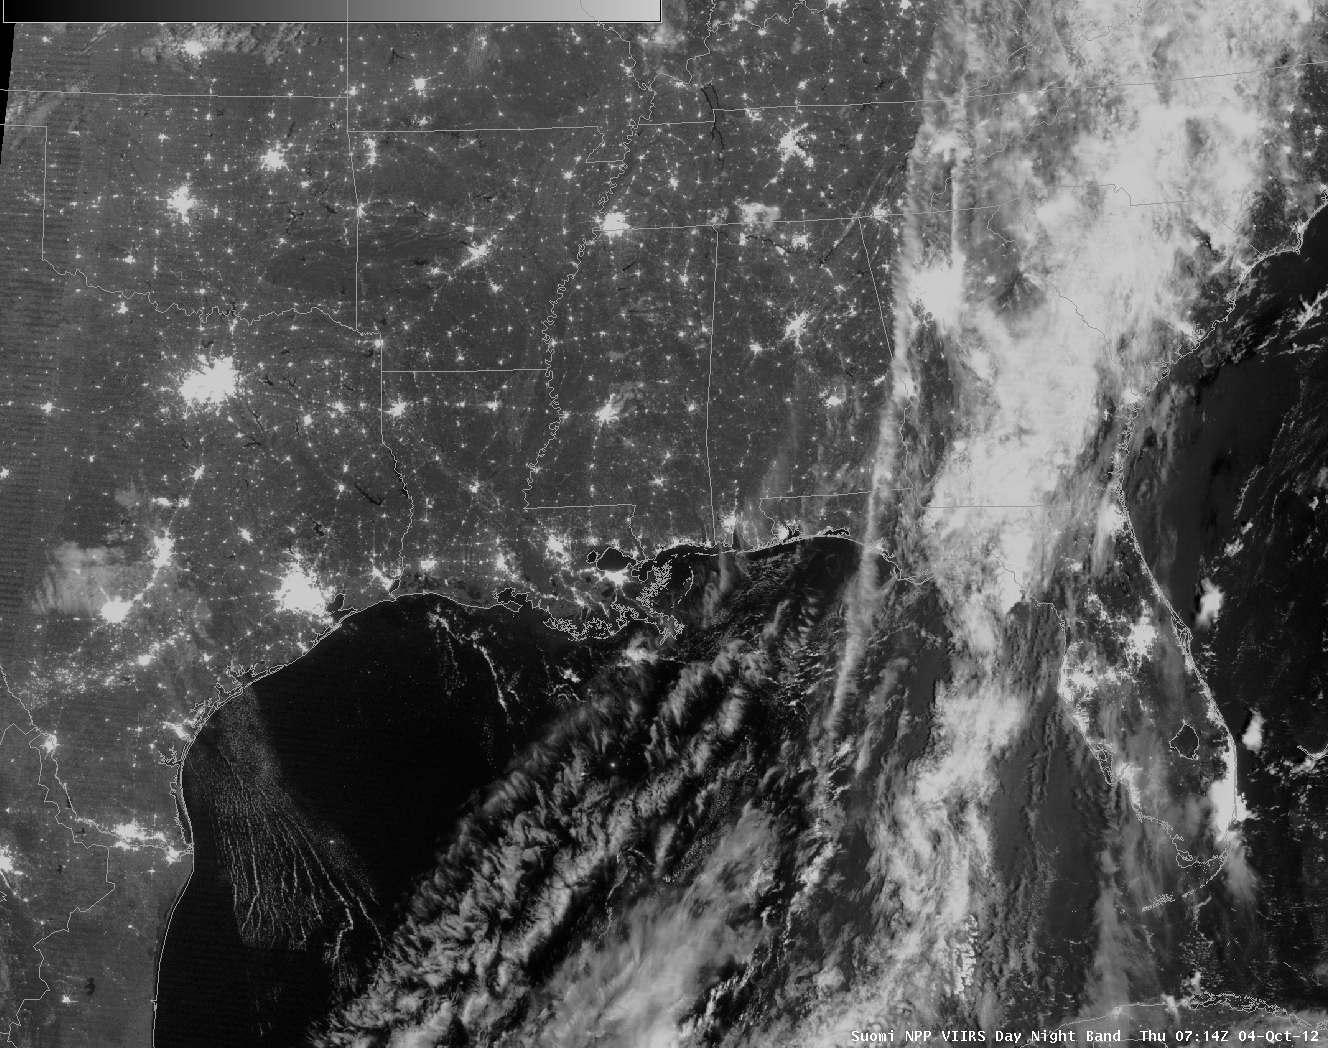
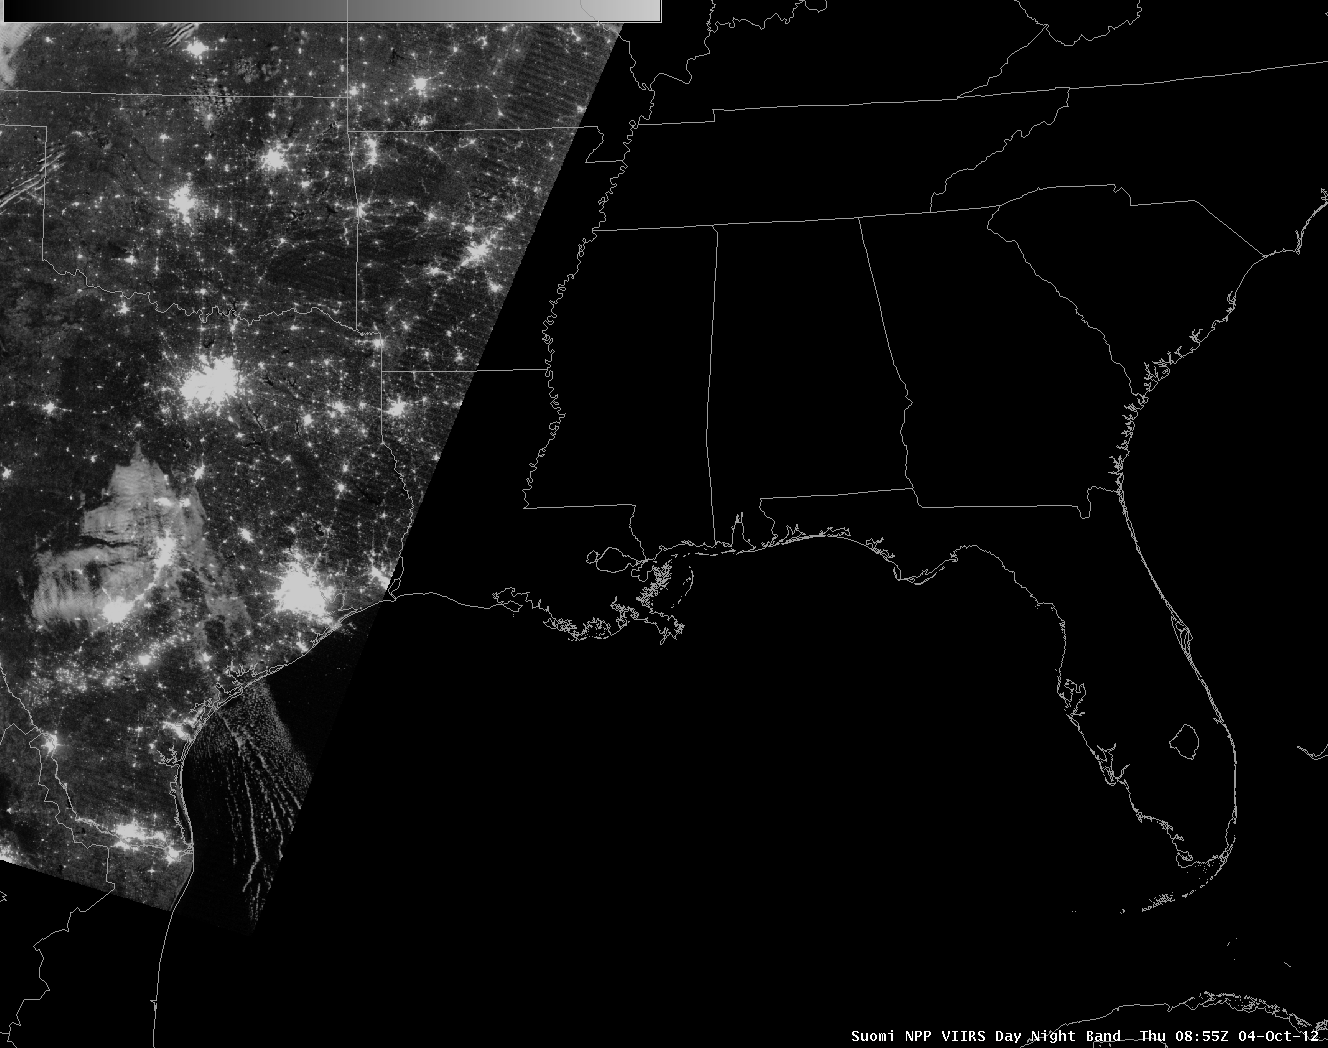
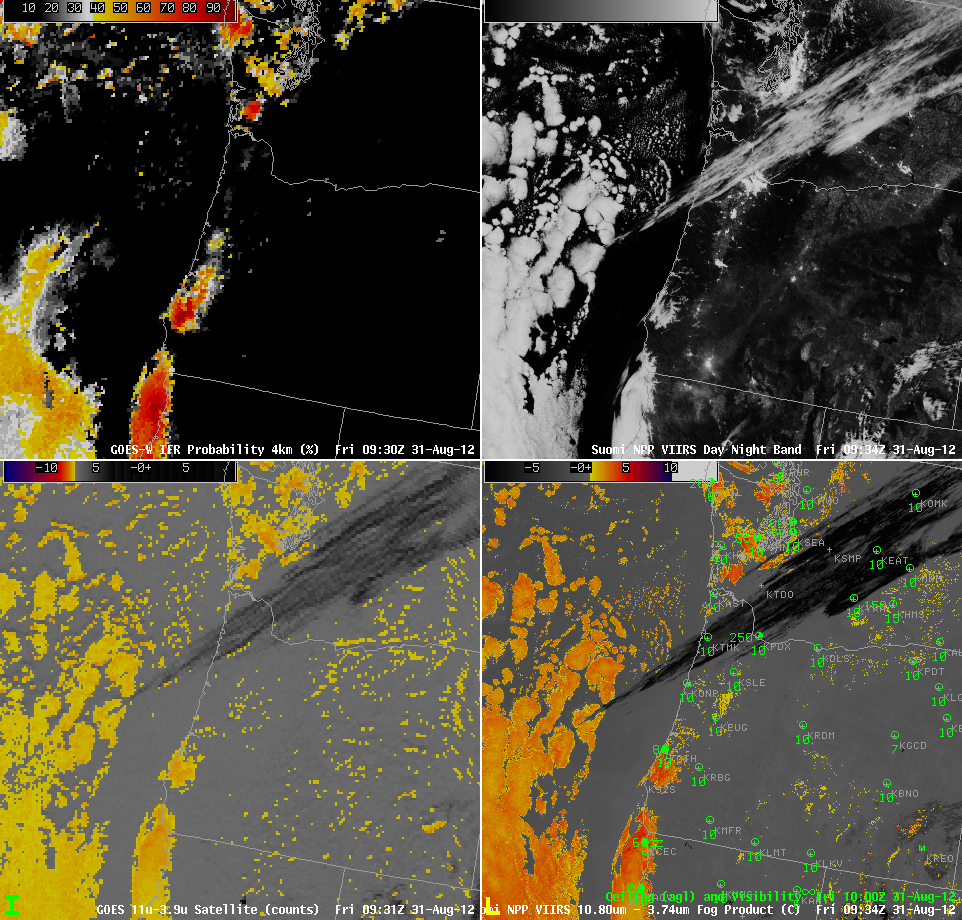
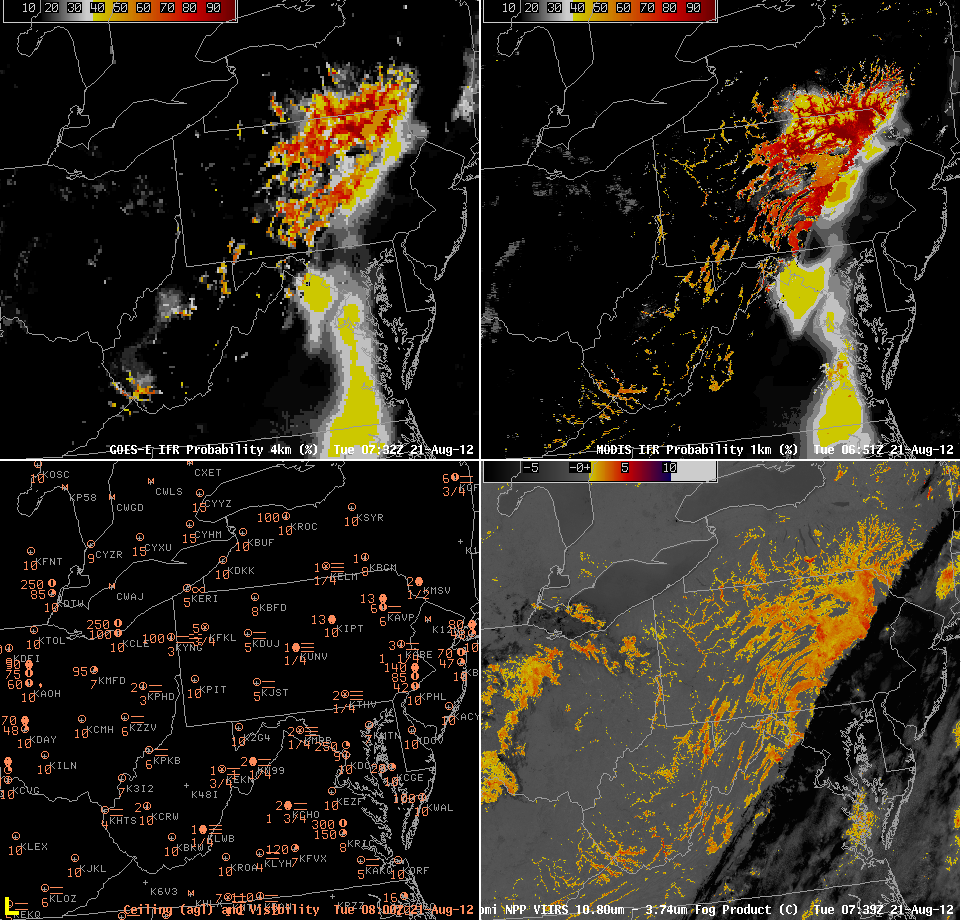
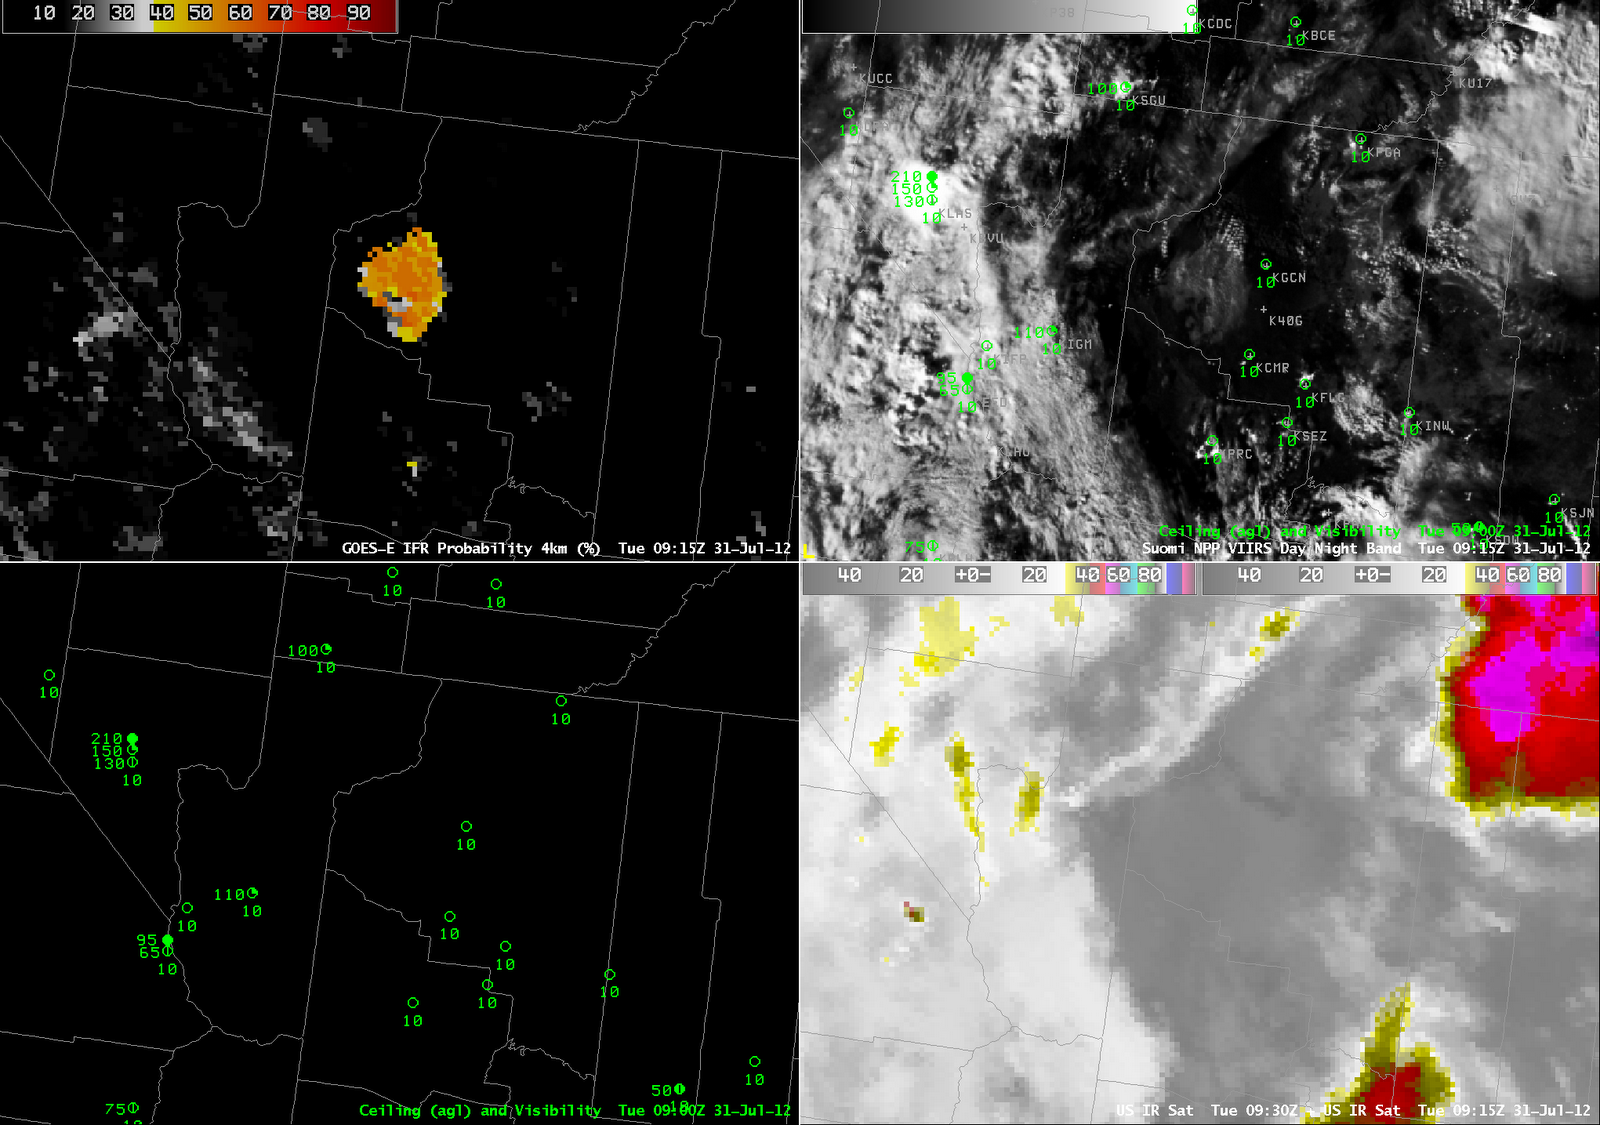
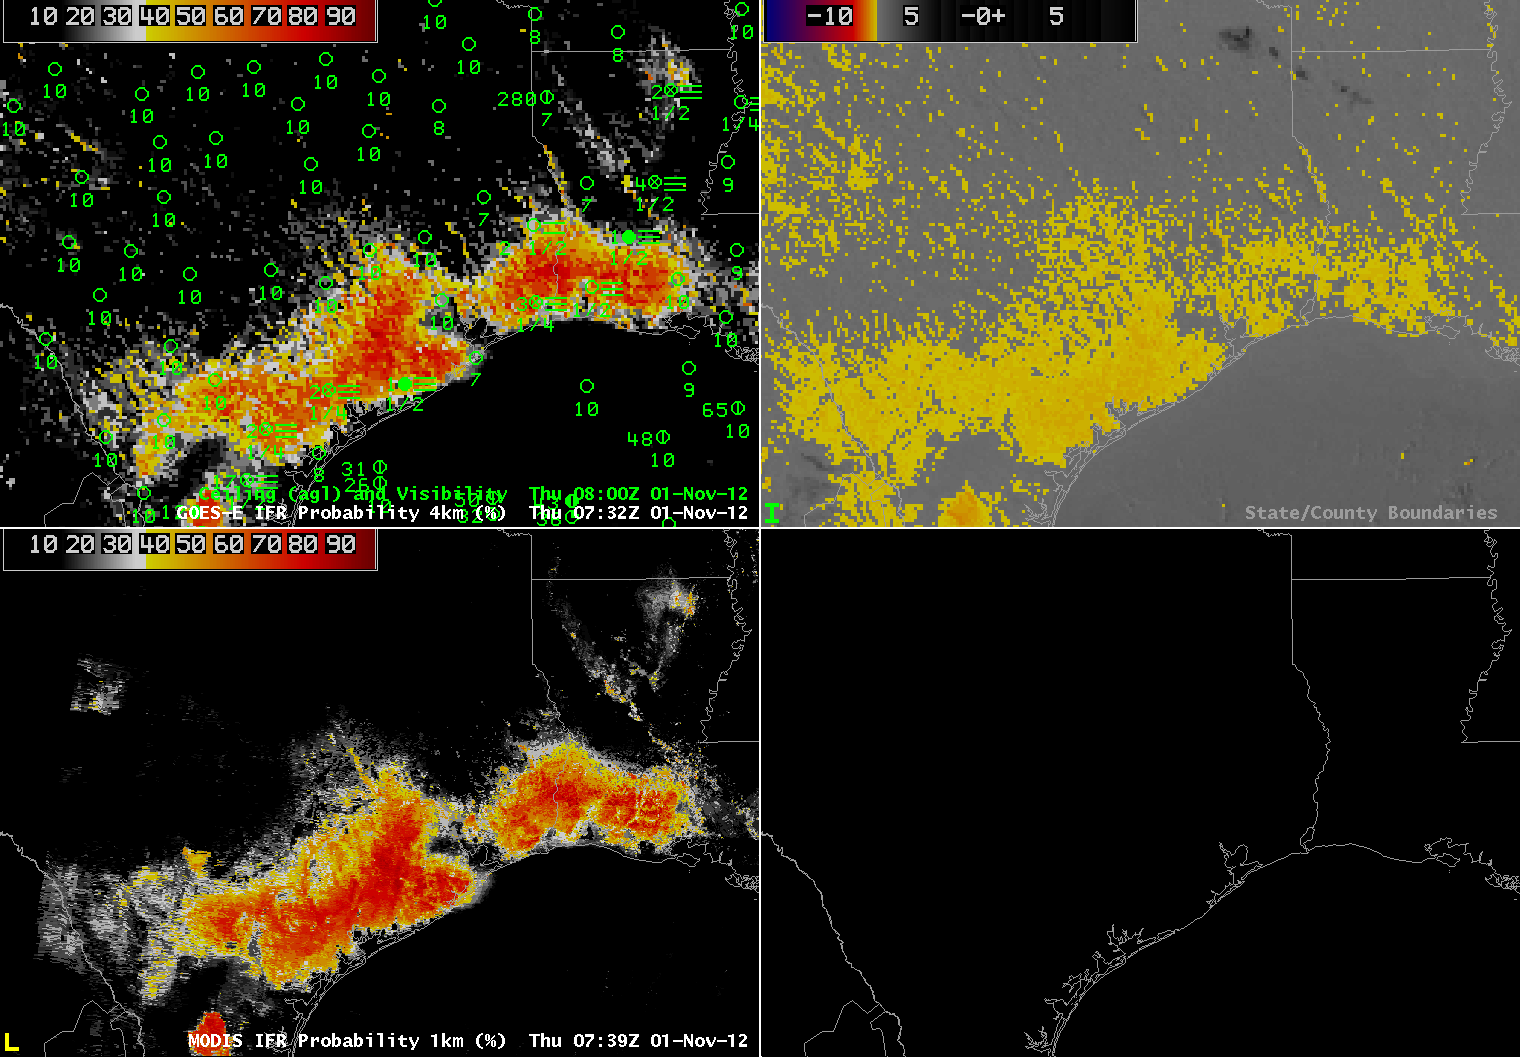
The imagery below shows GOES-R and MODIS imagery at the same time (immediately below) and GOES-R and Suomi/NPP imagery at the same time (bottom). Note that the fog that develops is not of sufficient thickness to block views of the city lights.
 |
|
| GOES-R IFR Probabilities computed from GOES-East (upper left), Traditional Brightness temperature Difference product (10.7 µm – 3.9 µm) (upper right), GOES-R IFR Probabilities computed from MODIS (lower left), Suomi/NPP Day/Night Band (lower left) |
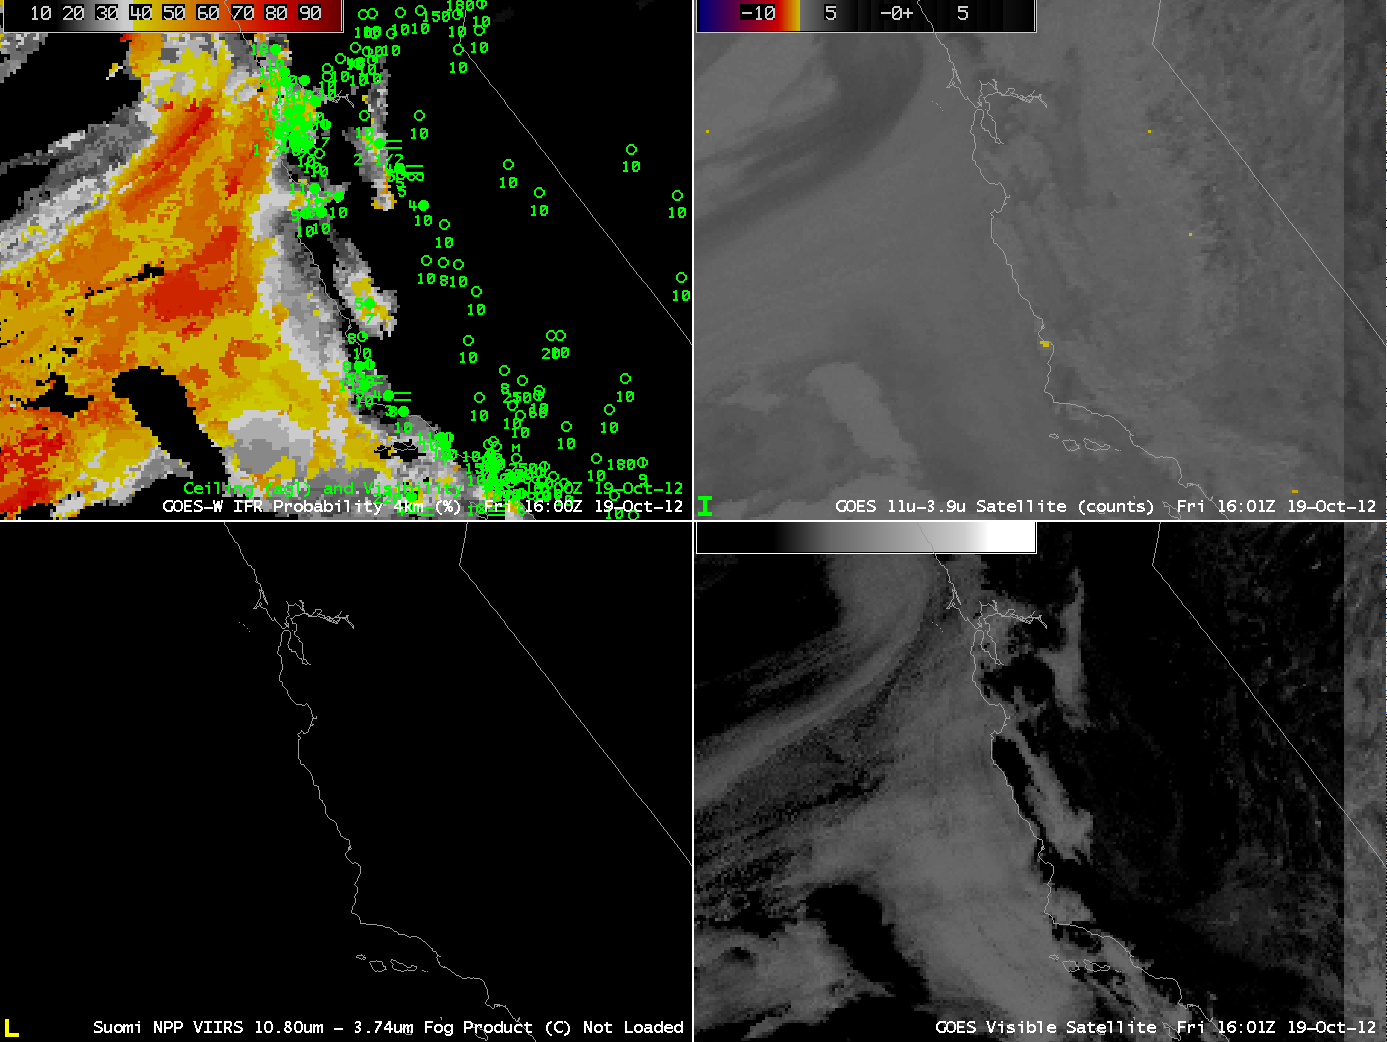
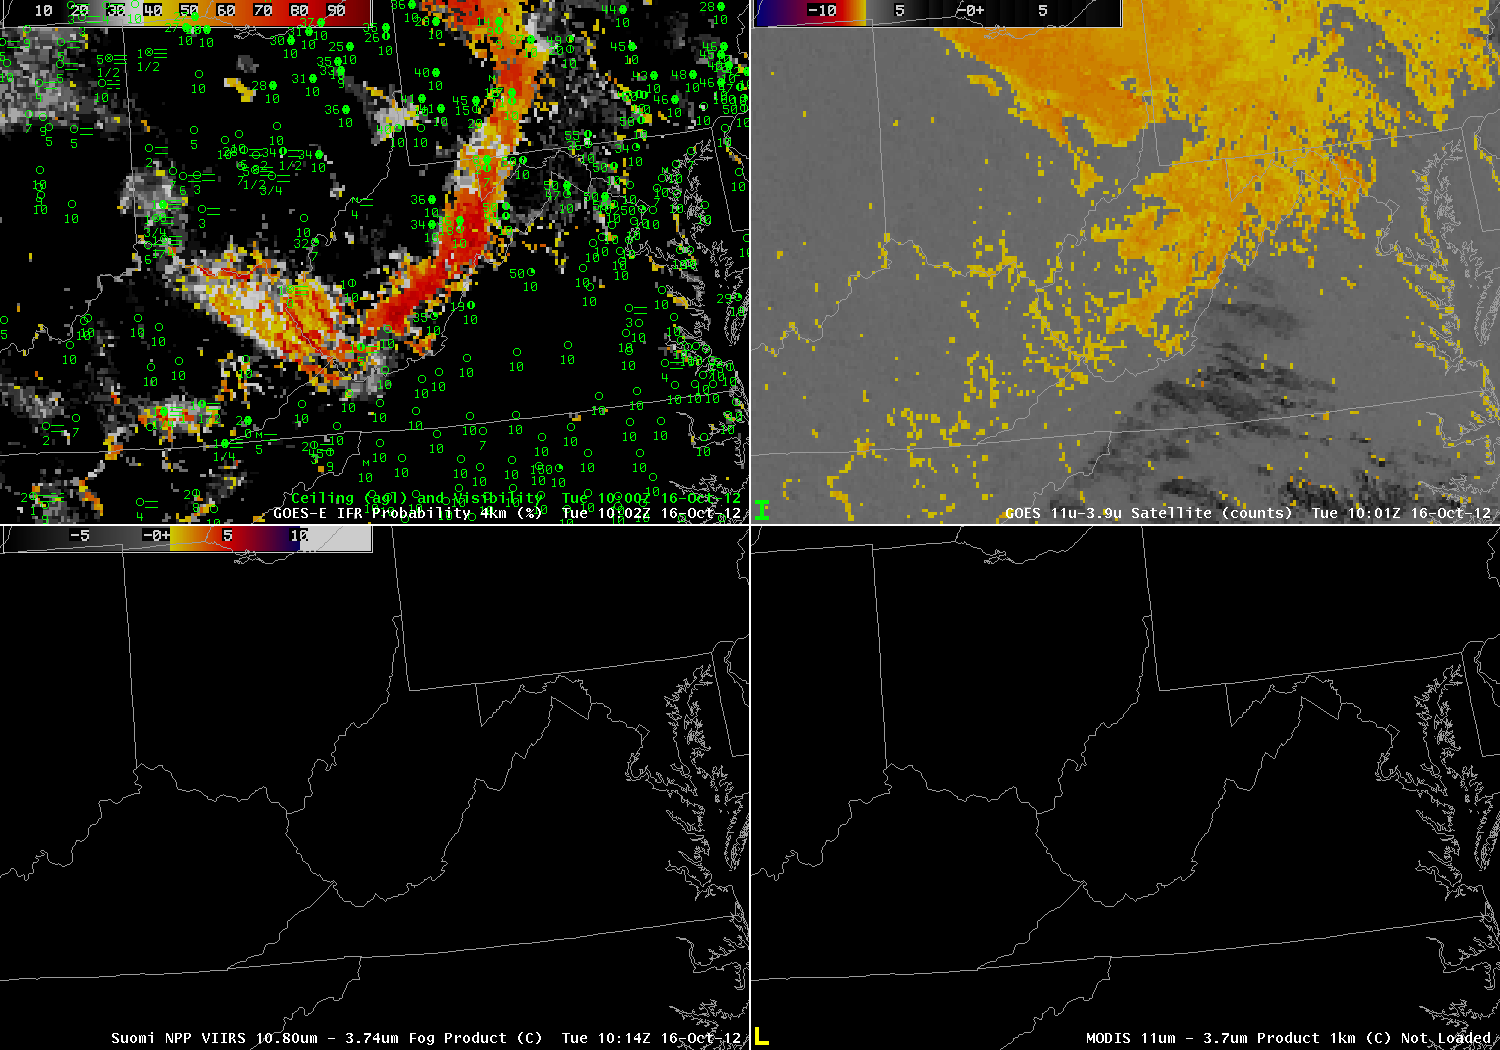
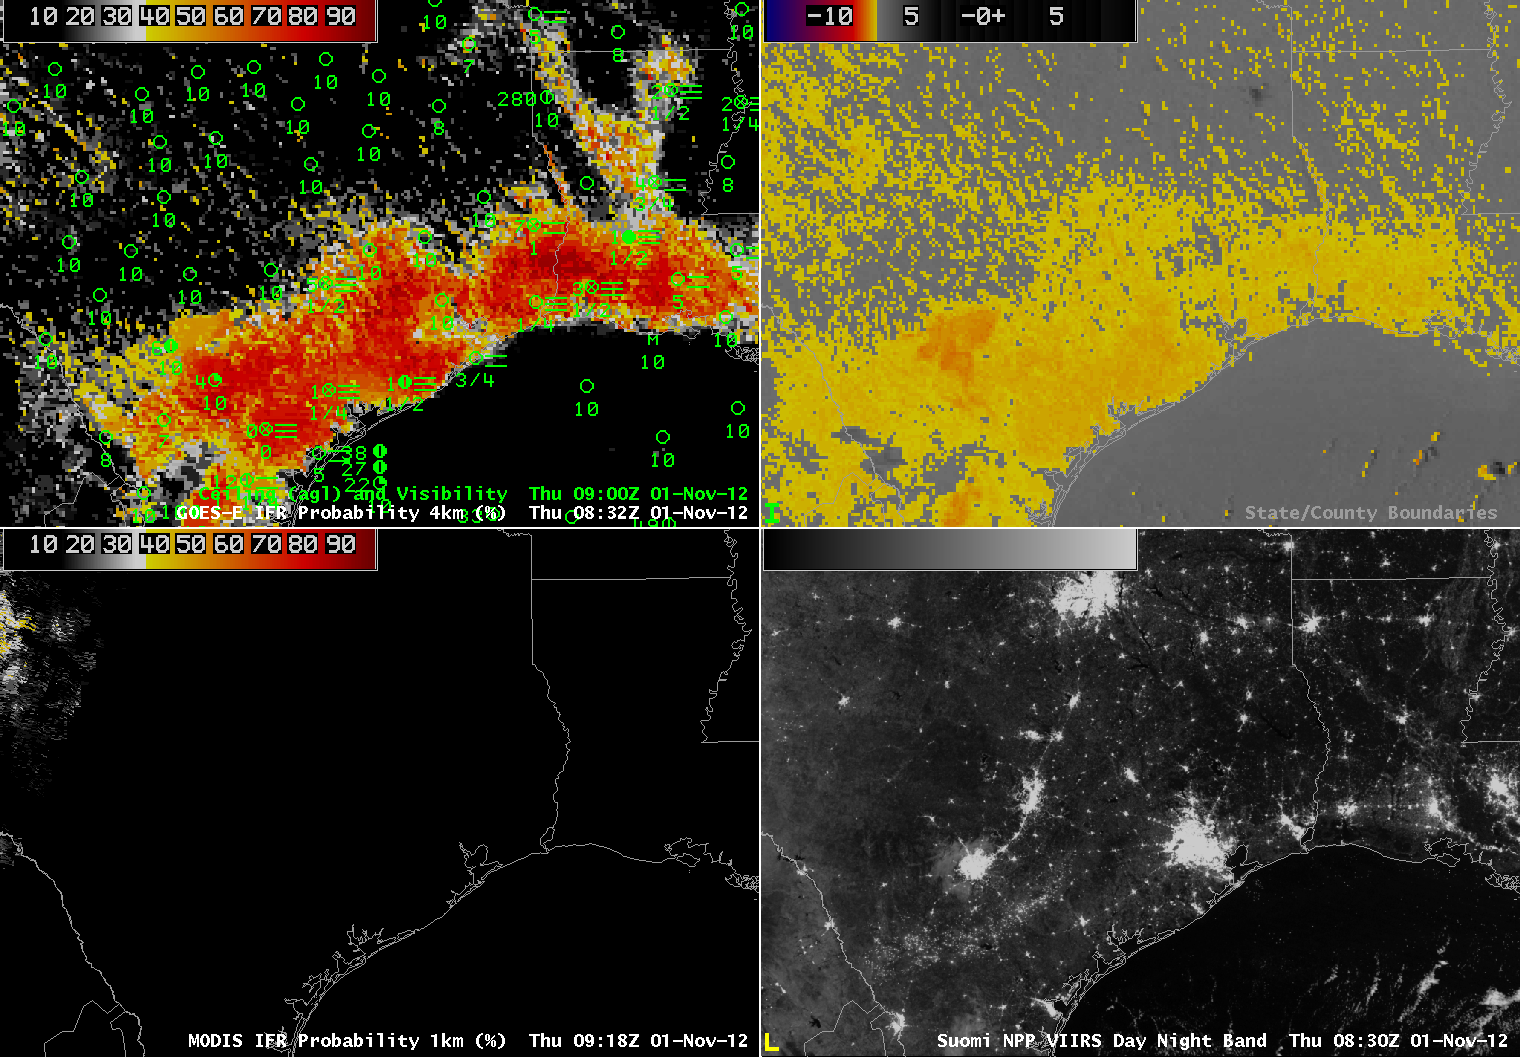 |
| GOES-R IFR Probabilities computed from GOES-East (upper left), Traditional Brightness temperature Difference product (10.7 µm- 3.9 µm) (upper right), GOES-R IFR Probabilities computed from MODIS (lower left), Suomi/NPP Day/Night Band (lower left) |