Category Archives: Northern Plains

Dense Fog Event Over the Upper Midwest U.S.

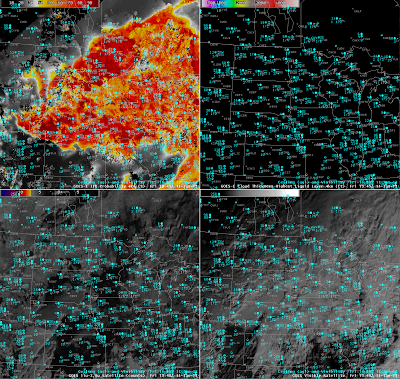
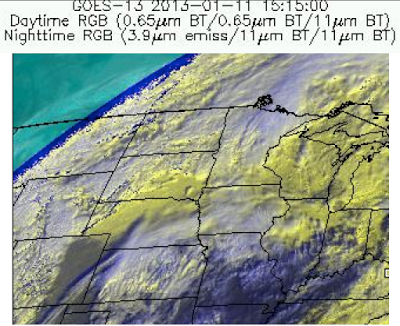
False color image of  a winter storm system moving across the upper Midwest U.S. on 11 January 2013.

A strong winter storm system moved over the upper Midwest on 11 January 2013 bringing heavy snow to the Dakotas. Rain and warm air moved in over the mostly snow covered areas of eastern Nebraska, Minnesota, Iowa, Wisconsin and northern Illinois resulting in a large area of locally dense fog. GOES-R IFR probabilities were used to monitor the large-scale event as it moved over the Upper Midwest U.S.

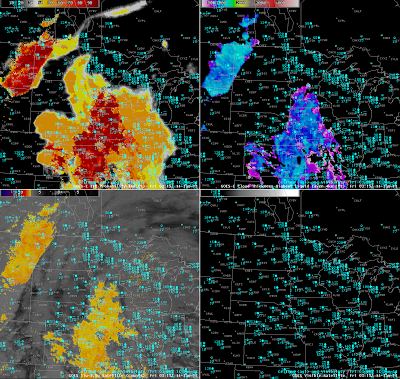
Due to a large amount of overlaying clouds a satellite only product such as the traditionally-used 11-3.9 micron Brightness Temperature Difference (BTD) only sees the top cloud layer and therefore can not detect fog/low stratus (FLS) beneath. The GOES-R IFR probabilities, however, combine both satellite and mesoscale NWP model data to create a blended product that can estimate the probability that IFR conditions are present even where overlaying clouds obscure all or part of the scene. This animation of the weather system shows that the traditional 11-3.9 micron BTD product only detects a small portion of the fog event, confirmed by the surface observations of ceiling and visibility. The GOES-R FLS product provides relatively high probabilities (>50%) that IFR conditions are present over the entire extent of the fog event with significantly high probabilities (>90%) when satellite data is useful.

GOES-R IFR probabilities (Upper Left), GOES-R Cloud Thickness (Upper Right), GOES-East Brightness Temperature Difference (10.7µm – 3.9µm) (Lower Left) and GOES-East Visible Satellite Imagery (Lower Right) on 11 January 2013. Surface observations of ceiling (100’s of ft) and visibility (miles) are shown in blue.

In the scene above the large change in probability seen in the GOES-R IFR product is a direct result of where the overlaying clouds obstruct the view of the lower clouds from the satellite. Where the satellite is able to see the low level clouds both satellite and model information are combined to determine the probability that IFR conditions are present. For this scene a strong satellite component and strong model component result in extremely high probabilities (>90%) that provide high confidence that IFR conditions are present over parts of the region. In areas where the overlaying clouds obstruct the satellite view only model data is used to determine the IFR probabilities. Without a strong satellite component the resulting probabilities are lower, however, they are still relatively high (>50%) and when used in conjunction with surface observations also provide high confidence that IFR conditions are present. The IFR probabilities show the extent of the fog over central Nebraska, southern Wisconsin and Illinois better than the traditional BTD product with very little false detection (high probabilities where surface obs do not indicate IFR conditions). Looking over the Dakotas and Nebraska the GOES-R IFR probabilities closely match the surface observations with relatively high probabilities over all of Nebraska and the eastern Dakotas where IFR conditions are present and very low probabilities in central N. Dakota and western S. Dakota where surface obs indicate VFR conditions.

GOES-R IFR probabilities (Upper Left), GOES-R Cloud Thickness (Upper Right), GOES-East Brightness Temperature Difference (10.7µm – 3.9µm) (Lower Left) and GOES-East Visible Satellite Imagery (Lower Right) on 11 January 2013. Surface observations of ceiling (100’s of ft) and visibility (miles) are shown in blue.

The traditional BTD product is mostly a nighttime only product as solar contamination in the 3.9 micron channel during the day makes it much more difficult to use. As daylight approaches the scene from 11 January 2013 the traditional BTD product appears to drop out. The GOES-R IFR product has no such issues and works smoothly through the night-to-day transition with consistently high probabilities accurately showing the full extent of the area of fog that continued through the rest of the afternoon.

Reduced Visibilities over Minneapolis

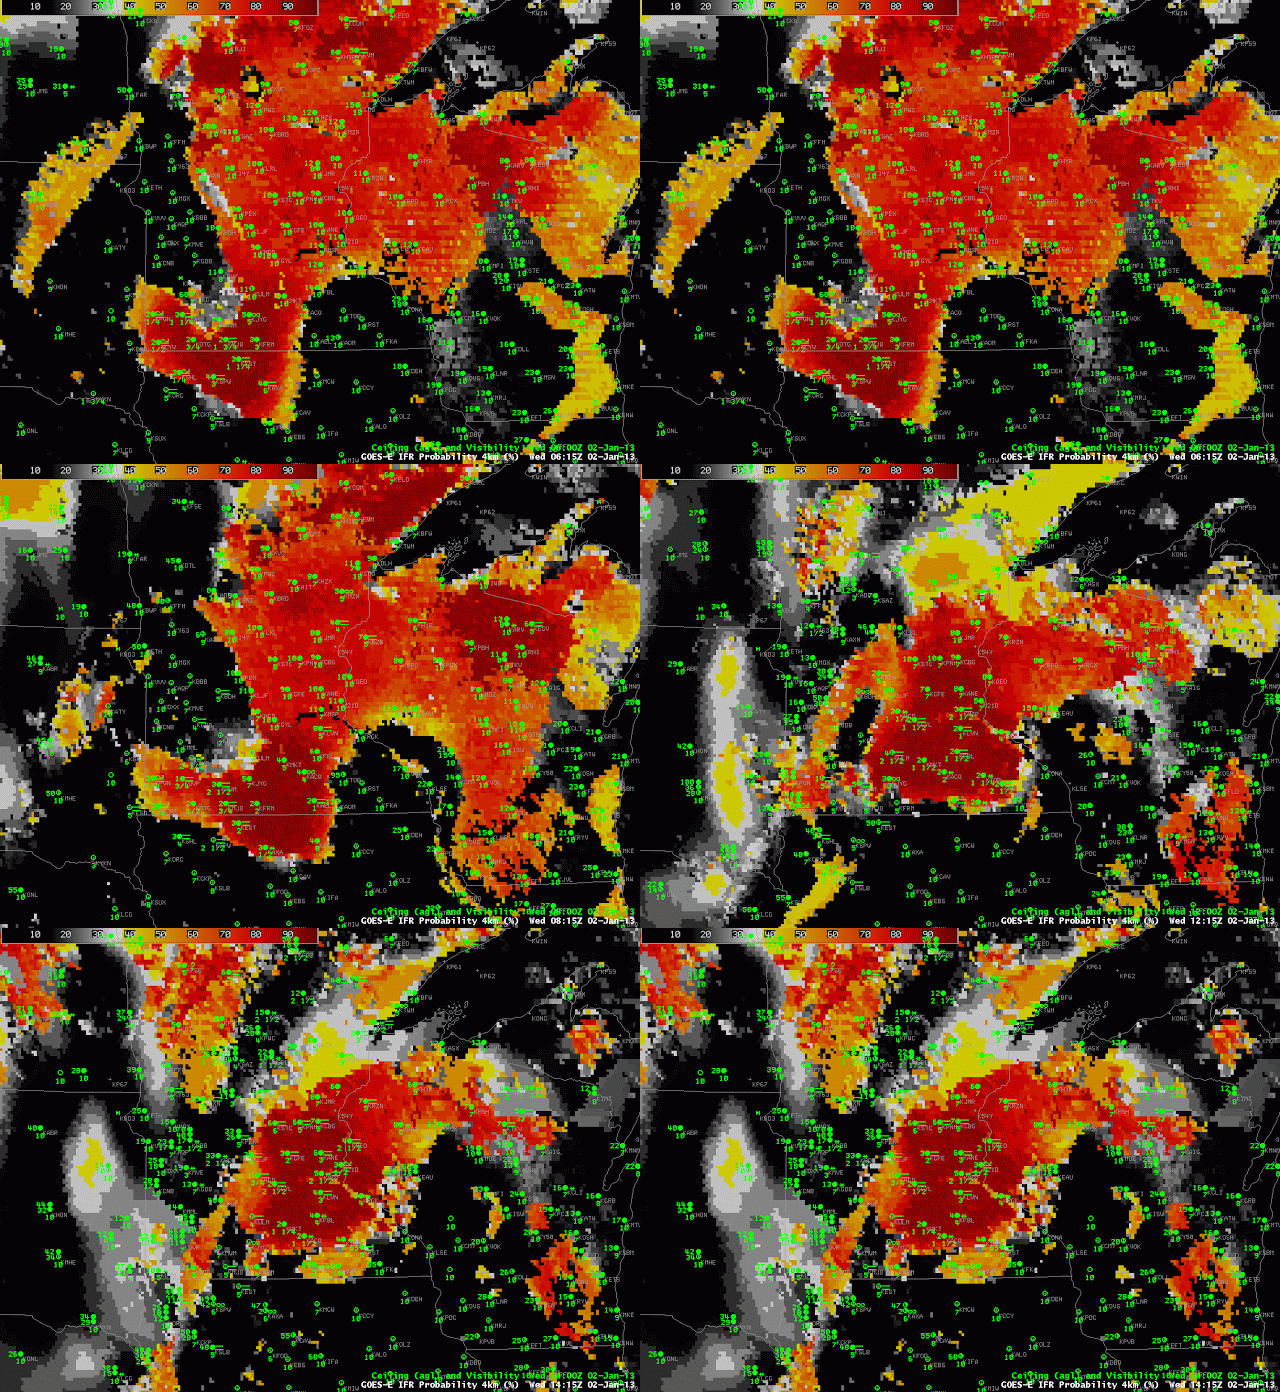
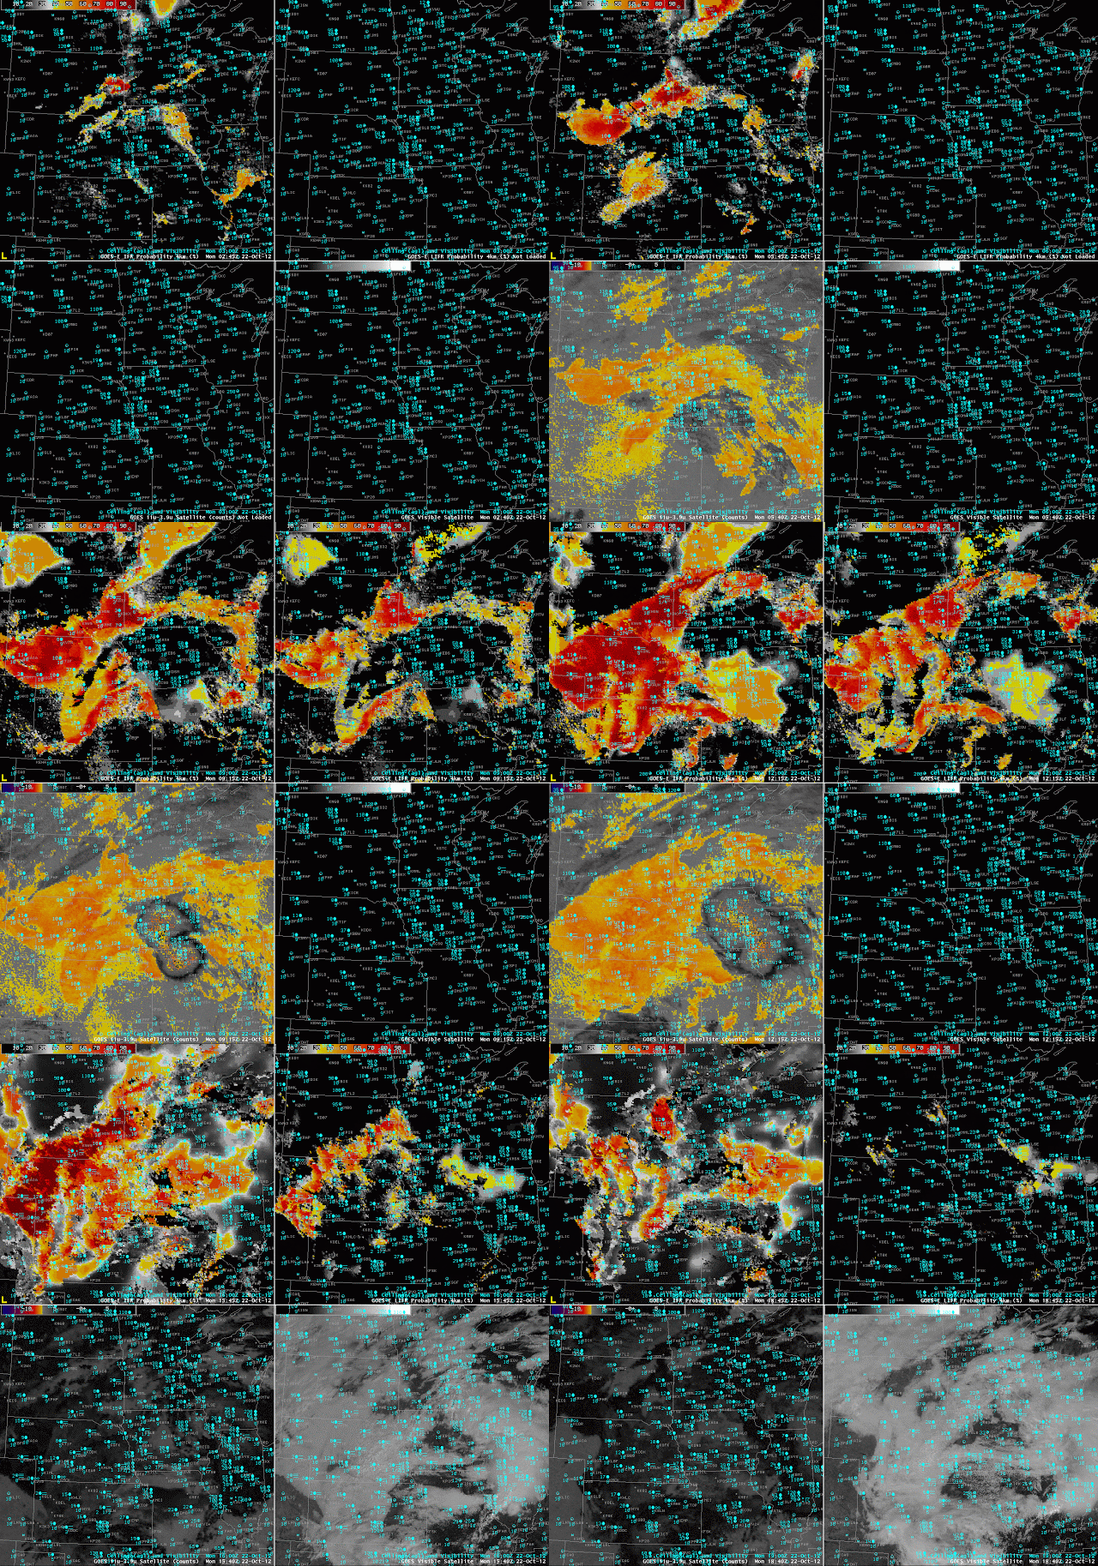
GOES-R IFR Probabilities, and ceiling/visibility observations, at 2-hourly intervals from 0615 UTC through 1415 UTC on 2 January 2013.

GOES-R IFR Probabilities show the movement of a region with IFR and near-IFR conditions, initially over southwest Minnesota and extreme northwest Iowa, northeastward towards the Minneapolis/St. Paul metropolitan area on 2 January 2013.  The deepest red colors in that region correspond to IFR probabilities around 94%, in contrast to the values over central Minnesota that are closer to 80%.  As the region of higher probabilities approaches the Twin Cities, ceilings and visibilities lower.  Tracking the motion of the highest probabilities can be an excellent method to make a short-term forecast of flight conditions.

Stratus vs. Fog in Montana/North Dakota

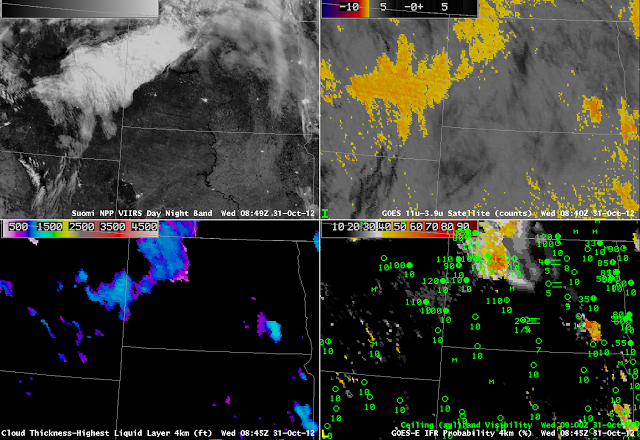
Suomi/NPP VIIRS Day/Night Band Visible imager (upper left), Traditional Brightness Temperature Difference (10.7 µm – 3.9 µm) image (upper right), GOES-R Cloud thickness algorithm (lower left), GOES-R IFR Probability (lower right)

Both the nighttime visible image from the Suomi/NPP VIIRS instrument (which uses moonlight as an illumination source) and the traditional brightness temperature difference product suggest the presence of water-based clouds over eastern Montana and northwest North Dakota on the morning of 31 October 2012.  However, there are no reports in Montana of IFR conditions.  GOES-R IFR Probabilities overlapping the cloud deck are very low.  It is likely that this cloud feature is elevated stratus, and that saturation is not occuring in the lowest levels of the model.  Fusing both model and satellite data yields a product that can be greater than the sum of the two.  Note, however, the IFR conditions that do exist in Bismarck, where IFR probabilities are very low and satellite information shows no fog signal.  This is likely very small scale river fog in the Missouri River Valley that is both too small to be resolved in the model or detected by the satellite.  In addition, very thin cirrus is interfering with the detection of low-level water clouds in much of central North Dakota.

Day/Night Transition artifacts

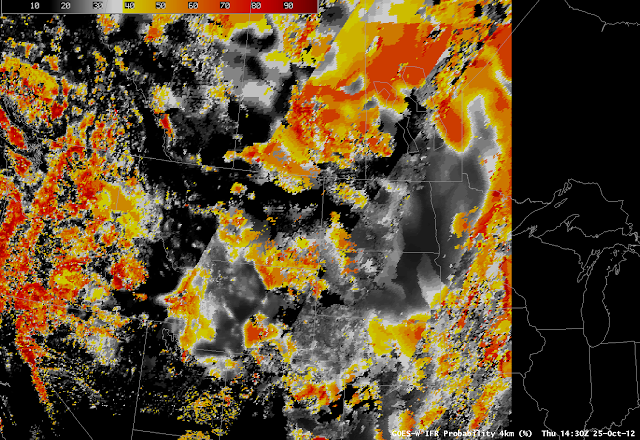
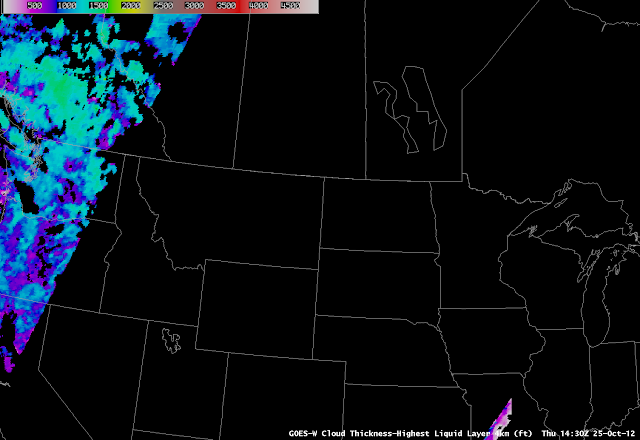
GOES-R IFR Probability, 1430 UTC on 25 October 2012

The predictors used by the GOES-R IFR Probability algorithms change as night turns to day and vice versa.  For example, the daytime predictors include the visible satellite imagery.  The change in predictors occurs when the solar zenith angle is less than 85 degrees (that is, when the sun is just rising). For solar angles between 85-90 degrees, temporal continuity has an increased importance and therefore the IFR probabilities look very similar to the previous temporal images.  When the solar zenith angle is between 80-85 degrees temporal metrics are used combined with current visible channel data (only if certain tests are passed that prove the data is of good quality). The cloud mask sometimes has difficulty detecting low clouds in this region so it still is not fully utilized until the solar zenith angle drops to below 80 degrees, where the cloud mask and the full array of daytime predictors are used. This leads to discernible changes in the probability fields, as shown above.  Two boundaries, extending southwest to northeast (roughly parallel to the terminator) are apparent, one from extreme northwest Utah through central Montana and into Canada (where the solar angle is around 85 degrees) and one from northwest Colorado through northwest South Dakota into Manitoba (where the solar angle increases above 80 degrees).   This transition zone is less noticeable in the Summer because of the Earth-Sun geometry.  It is very difficult to create the GOES-R Cloud Thickness product when the solar zenith angles are between 75-90 degrees so the product is currently not available in this region.  This is why the Cloud Thicknesses cut off over eastern Oregon and show back up over central Missouri.

GOES-R Cloud Thickness for 1430 UTC, 25 October 2012

Fog/Low Stratus over the Upper Midwest U.S.

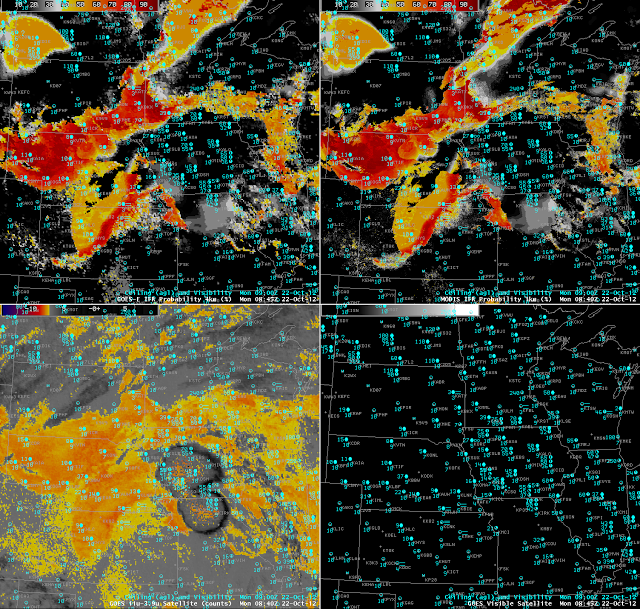
GOES-R IFR probabilities (upper left), GOES-R LIFR probabilities (upper right), GOES-13 brightness temperature difference (3.9-11 µm) (lower left) and visible satellite image (lower right). Surface observations of visibility and cloud ceiling (above ground level) are overlaid on all 4 panels in blue

The GOES-R IFR probabilities are useful when monitoring the formation of fog and/or low stratus (FLS) clouds. In this case over the Upper Midwest U.S. FLS started forming over eastern South Dakota and quickly spread to adjacent states eventually becoming widespread over most of the Upper Midwest. Surface observations of IFR conditions correlate very well to the areas of high IFR probabilities denoted by the dark orange to red colors. In the animation above the GOES-R IFR probabilities track the formation of the FLS with high confidence, evidenced by the relatively high IFR probabilities. The traditionally-used 3.9-11 micron BTD product also detects the FLS, but has difficulty detecting the spatial extent of the hazardous areas of the cloud deck. During the initial formation before 10Z Surface observations over Iowa and S. Minnesota indicate that elevated clouds are present, but they do not meet the IFR criteria for surface visibility (< 3 miles) and/or cloud ceiling (<1000 ft) until after a cluster of showers and thunderstorms passes through. This cluster of showers and storms can be seen in the 3.9-11 micron BTD as the gray and black circular area moving east over Iowa. In these types of situations the satellite only approach does not provide any information on what's going on near the surface because the satellite can only view the top most cloud layer. Using a blended approach merging satellite information with modeled forecast data from the Rapid Refresh model the IFR probabilities can still provide useful information on the presence of hazardous low cloud conditions even when multiple cloud layers are present.

The GOES-R LIFR probabilities can be useful for gaining confidence on whether the FLS is near the surface or if the cloud deck is elevated. Areas of relatively higher IFR and LIFR probabilities usually correlate well to lower surface visibility observations while areas of relatively high IFR probabilities and low LIFR probabilities usually correspond to higher surface visibilities but low cloud ceilings.
When the Sun rises, reflected solar radiation makes using the traditional BTD very difficult. The GOES-R IFR probabilities are available both night and day so users will be able to use the products through sunrise and sunset with confidence. During the day the visible satellite image shows the smooth FLS deck over western Nebraska and what appears to be some cumuliform clouds over eastern Nebraska. Surface observations show IFR conditions are present over most of Nebraska and again correlate very well with high IFR probabilities, even in the presence of the overlaying cumuliform cloud deck.
GOES-R IFR probabilities applied to MODIS (upper left), GOES-R LIFR probabilities applied to MODIS (upper right), MODIS brightness temperature difference (3.9-11 µm) (lower left) and visible satellite image (lower right). Surface observations of visibility and cloud ceiling (above ground level) are overlaid on all 4 panels in blue
The GOES data is available at a high temporal resolution, but only has a spatial resolution of 4km. Applying the GOES-R FLS products to MODIS allows the use of a much high spatial resolution (1km) dataset. The downfall is that since MODIS is on a polar orbiting satellite it is only available a few times per day. However, the higher spatial resolution allows the user to see much more detail than can be obtained using GOES data.

Fog over North Dakota

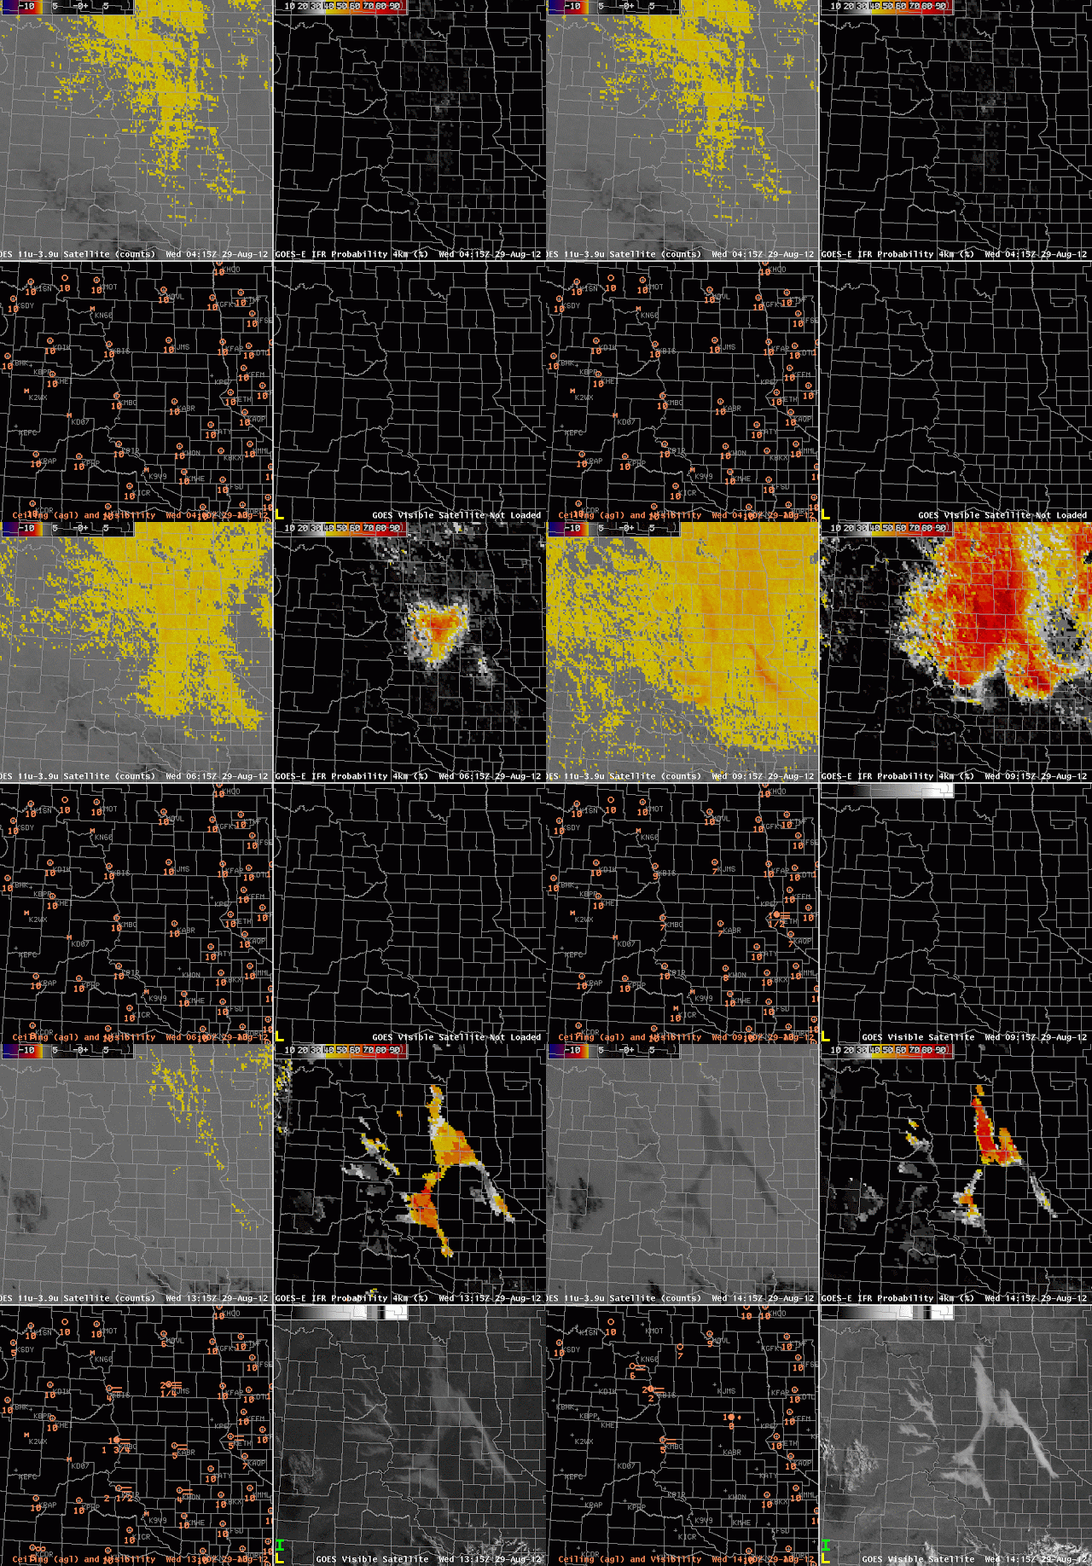
GOES-East brightness temperature difference (Upper left), GOES-R FLS Product (Upper Right), Ceiling and visibility observations (Lower left), Visible Imagery (Lower right)

Relatively light winds and high dewpoints promoted the development of isolated fog over the Dakotas on the morning of the 29th.  How did satellite-based and satellite-influenced fog detection algorithms perform?

The Brightness Temperature difference field shows returns suggestive of fog or low stratus in regions over western North Dakota — west of the Missouri River — where IFR conditions are not reported.  The GOES-R FLS product suggests a smaller region of fog and low stratus;  there are high probabilities in regions where IFR conditions occur.  However, there are several examples of IFR conditions that are reported at stations just at the edge of the region of high probabilities:  KMHE at 1115 and 1215 UTC, for example.  The isolated nature of the fog in the visible imagery also is suggetive of a more limited fog event than might have been expected given the Fog/Low stratus probabilities.  Note the abrupt change as daytime predictors replace nighttime predictors.  In this case, it seems as though the daytime predictors better handle the small horizontal scale of the fog event.

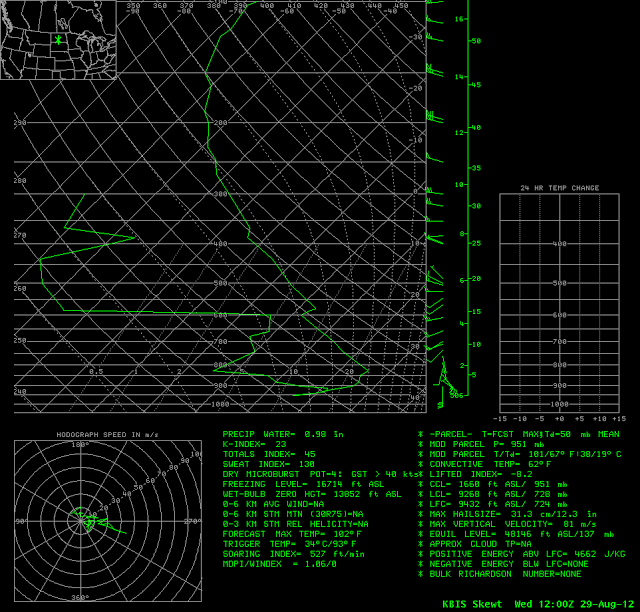
The morning sounding from KBIS is characteristic of a fog event in a river valley.

Thermodynamic diagram for KBIS at 1200 UTC on 29 August 2012. Note the saturated layer at the surface.

IFR Probabilities under a Thick Cloud Deck

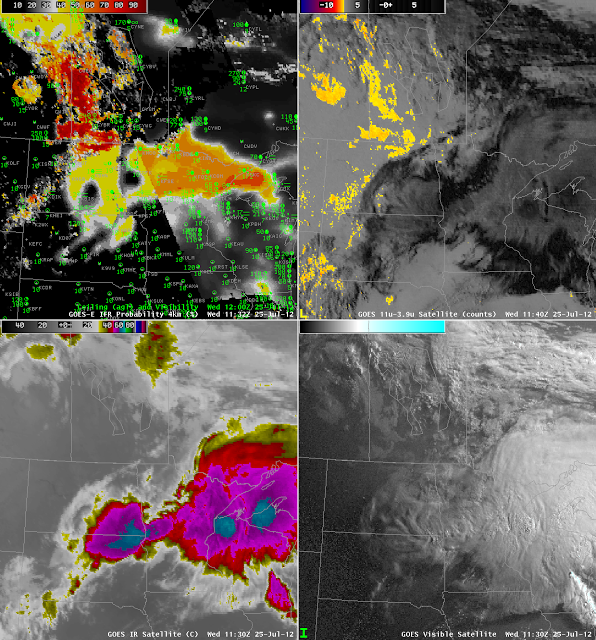
GOES-R IFR Probabilities at 1132 UTC with 1200 UTC surface Observations (Upper left), GOES-East Brightness Temperature Difference (10.7 micrometer brightness temperature – 3.9 micrometer brightness temperature) at 1130 UTC (upper right), GOES-East 10.7 micrometer brightness temperature (lower left) and GOES-East Visible imagery at 1130 UTC (lower right).

Convection developed over the upper Midwest and northern Plains during the early morning hours of 25 July 2012.  Deep convective clouds preclude the ‘traditional’ brightness temperature difference method of fog detection:  emissions from the low-level water-based clouds cannot be seen by the satellite because of high-level cirrus clouds associated with thunderstorm anvils.  IFR conditions nevertheless can occur and can be predicted using model-based predictors in the fused GOES-R IFR probability product.  The case above is an excellent example.

The bottom two images show the tradiational satellite imagery, telling the tale of a departing mesoscale system.  It leaves in its wake low clouds over North Dakota and Manitoba that are detected by the traditional product, and notice how the GOES-R IFR probabilities are highest here, because satellite and model predictors both agree.  Under the convective cloud canopy, probabilities are lower:  around 40% in central North Dakota (where night-time predictor relationships are being used) and around 55% over the Arrowhead of Minnesota (where daytime predictor relationships are being used);  the terminator boundary is very obvious in the IFR Probability figure.  There is an excellent overlap between the GOES-R IFR Probabilities and reported IFR conditions that is impossible to get in this case with satellite information alone.

Signals of IFR Day and Night from GOES-R IFR Probability

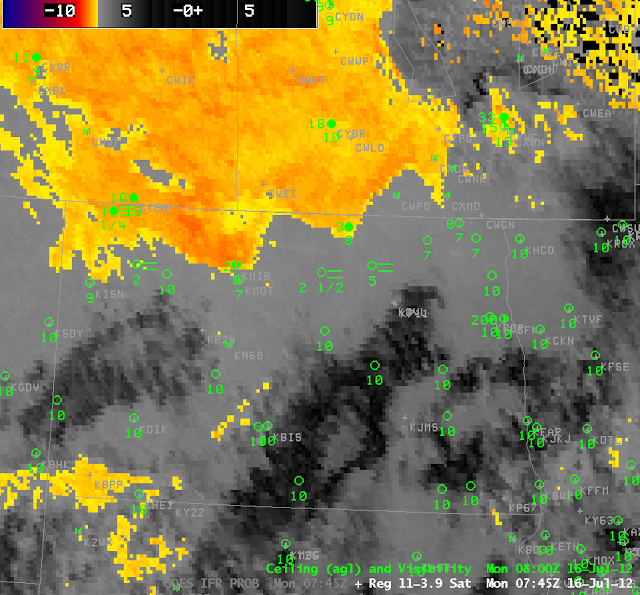
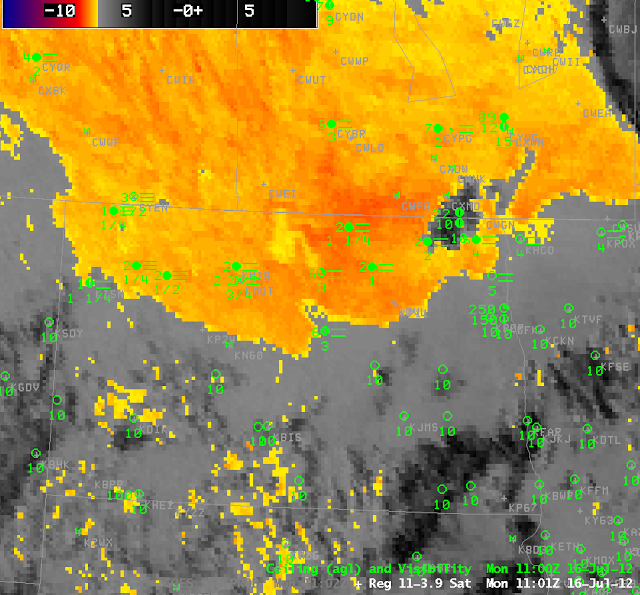
Brightness Temperature Difference (11 micrometers – 3.9 micrometers) at 0745 UTC on 16 July

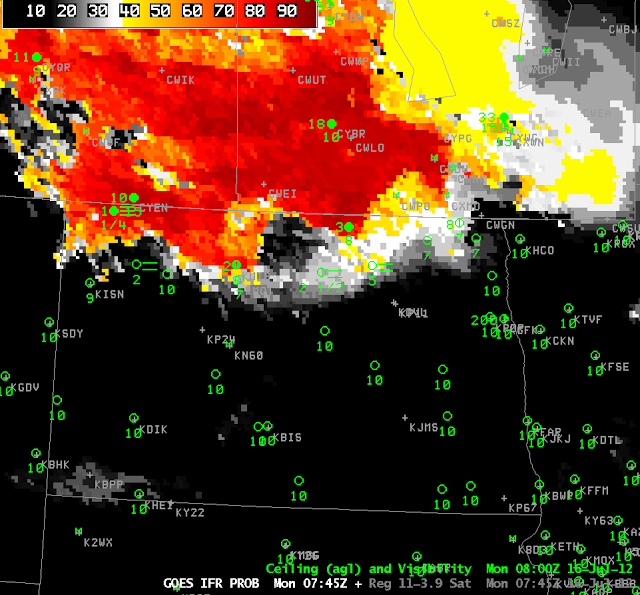
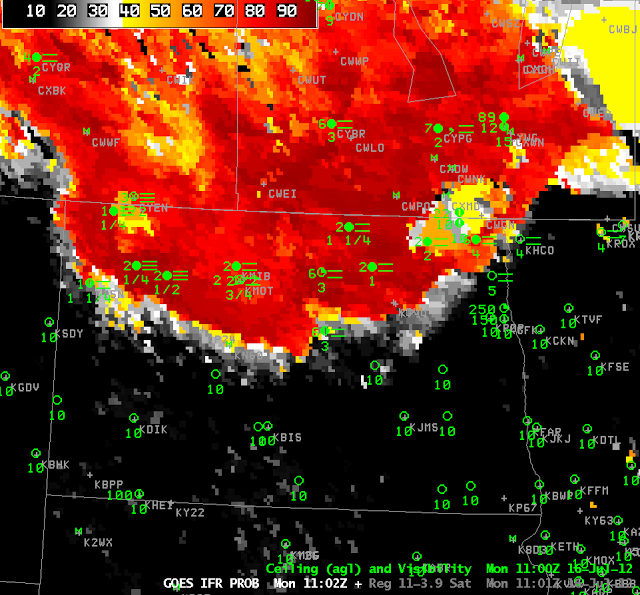
GOES-R IFR probability product at 0745 UTC on 16 July 2012

The two images above show the ‘traditional’ GOES fog product — the brightness temperature difference between 11 and 3.9 micrometers — at 0745 UTC on 16 July 2012 (top) and the GOES-R IFR probabilities at the same time.  In addition, ceilings and visibilities at stations in North Dakota are plotted.  Both products accurately capture the fog/low stratus along the North Dakota/Canada border.  The IFR probabilities do a better job at suggesting the development of IFR at Rugby, ND (with 2-1/2 mile visibility).  The IFR probabilities are also correct over southwestern North Dakota: IFR conditions do not exist there despite the brightness temperature difference.

Brightness Temperature Difference (11 micrometers – 3.9 micrometers) at 1101 UTC on 16 July

GOES-R IFR probability product at 1102 UTC on 16 July 2012

At 1100 UTC (above), both products accurately portray the existence of fog/low stratus over north central North Dakota, but the traditional brightness temperature difference product continues to suggest fog/low stratus over southwestern North Dakota, where IFR conditions do not exist, and where the IFR probability has little signal.

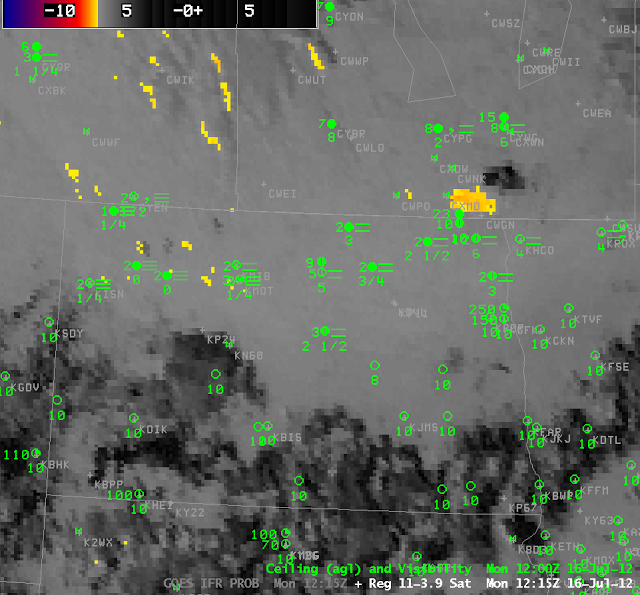
Brightness Temperature Difference (11 micrometers – 3.9 micrometers) at 1215 UTC on 16 July

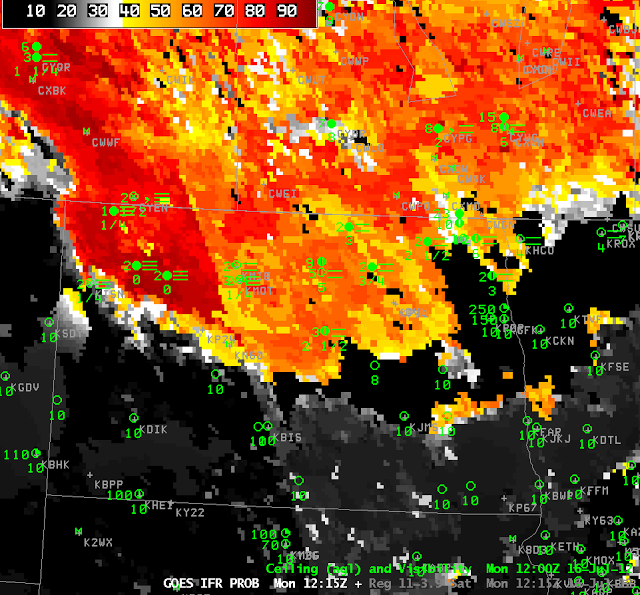
GOES-R IFR probability product at 1215 UTC on 16 July 2012

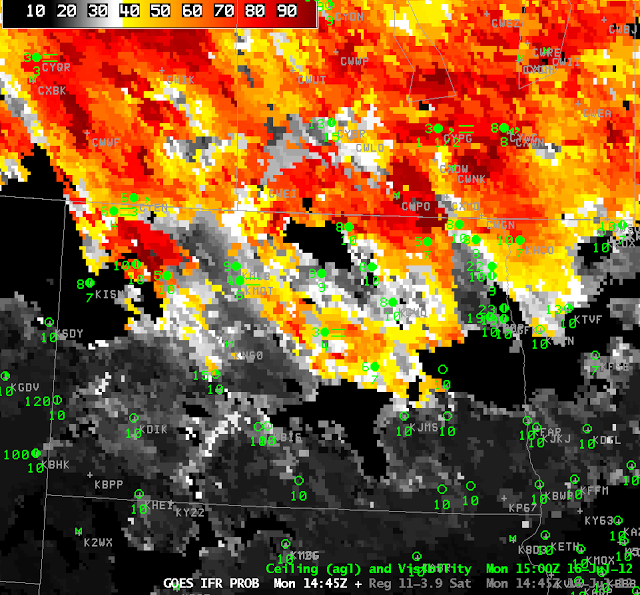
When the sun rises, reflected solar 3.9-micrometer radiation causes the brightness temperature difference between 11 and 3.9 micrometers to flip sign, and the color enhancement used at night loses value in day.  In contrast, the GOES-R IFR probability maintains a robust signal from nighttime through twilight to daytime (the terminator is visible in the IFR probability image at 1215 UTC 16 July, above, running north-northwest from south-central North Dakota to western north-central North Dakota).  Higher IFR probabilities continue to overlap the region where IFR conditions are reported.  By 1445 UTC (below), the region of IFR conditions is breaking apart;  stations that persist in reporting IFR conditions (or near IFR) are within the highest IFR probability in the field — Minot and Harvey in ND, Estevan in Saskatchewan and Portage in Manitoba.

GOES-R IFR probability product at 1445 UTC on 16 July 2012