Category Archives: Multiple Cloud Layers

Dense Fog over the Upper Midwest

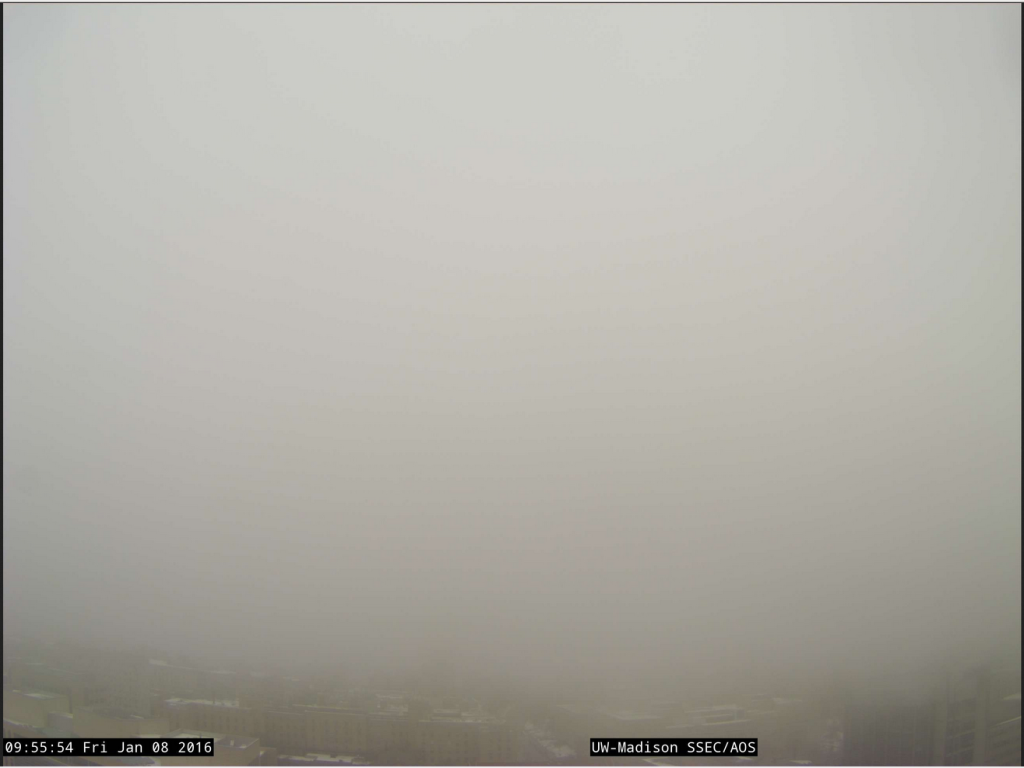
SSECWebCamNorth_0955CST_08Jan2016

SSEC WebCam, north-facing, at 1555 UTC on 8 January 2016 (Click to enlarge)

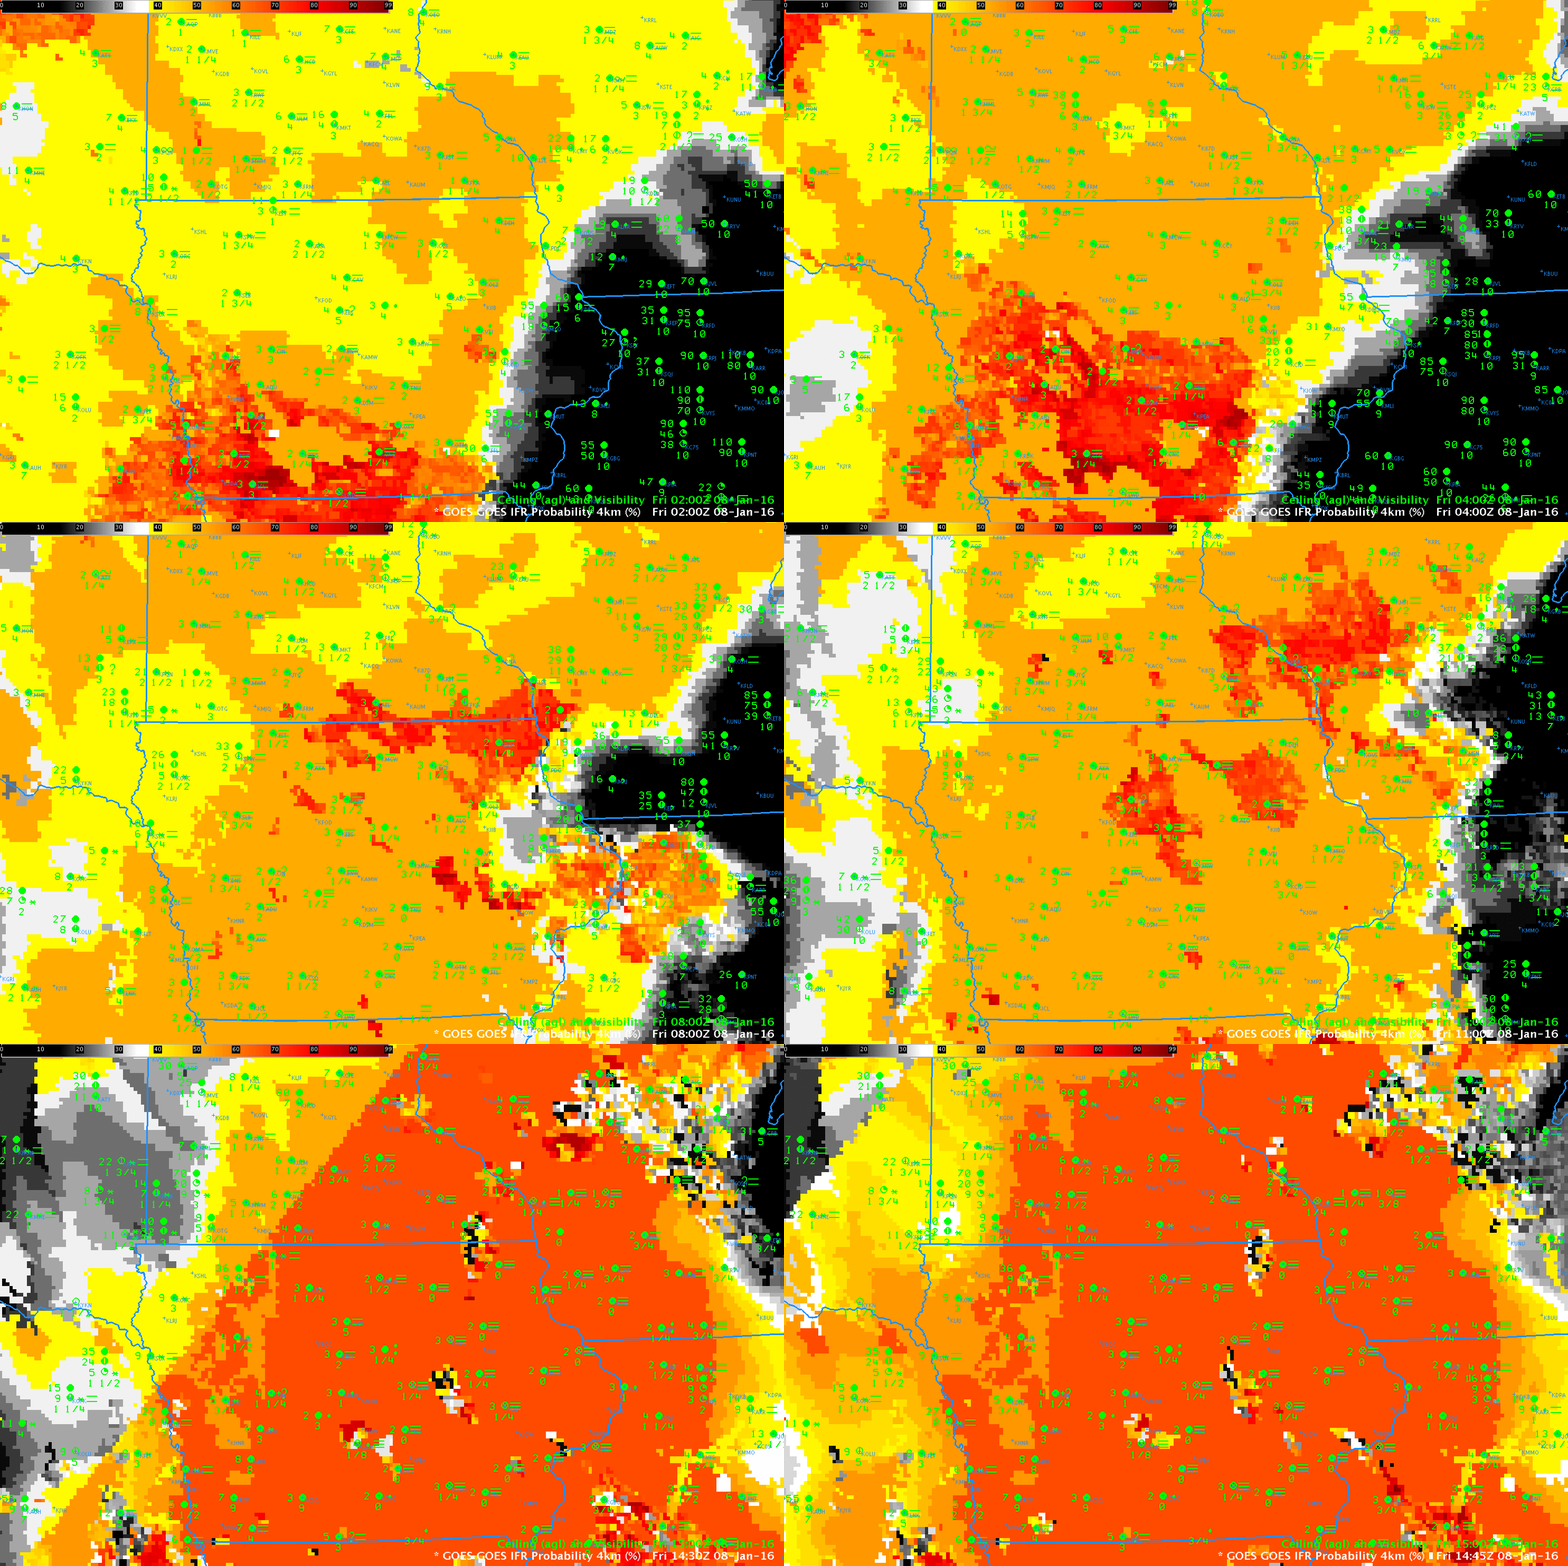
A storm in the Midwest that has drawn moist air northward (dewpoints exceed freezing over snowcover over much of the upper midwest) has caused advection fog over a wide area of the upper midwest. (The WebCam at SSEC in Madison WI (source) is shown above)  Dense Fog Advisories (below) were issued by the Davenport, Des Moines, Lincoln and LaCrosse WFOs. Extratropical storm systems are usually accompanied by multiple cloud layers that prevent the satellite from viewing low stratus. For such events as these, only a fog-detection product that includes surface-based information will be useful. GOES-R IFR Probability fields, below, neatly outline the region of lowest visibilities and ceilings.  As the highest probabilities push to the east over Wisconsin and Illinois, visibilities and ceilings both drop.

Other aspects of the animation below require comment. IFR Probability fields use predictors based on both satellite and model data; if one of those predictors cannot be used (satellite data, for instance, in regions where high clouds that mask the view of the near-surface), IFR Probability values will be suppressed. The relatively flat nature of the GOES-R IFR probability field over Iowa is characteristic of a field controlled mainly by Rapid Refresh Model output. But there are embedded regions of greater values of IFR Probability that propagate northward: these are regions where breaks in the higher/mid-level clouds allow the satellite to view low clouds, and satellite predictors are available to the algorithm, and probabilities can therefore be larger. Similarly, as the sun rises — at the end of the animation — IFR Probability in general increases as visible imagery can be used for more confident cloud-clearing. The algorithm yield higher probabilities of IFR Conditions because there is more confidence that a cloud is actually present.

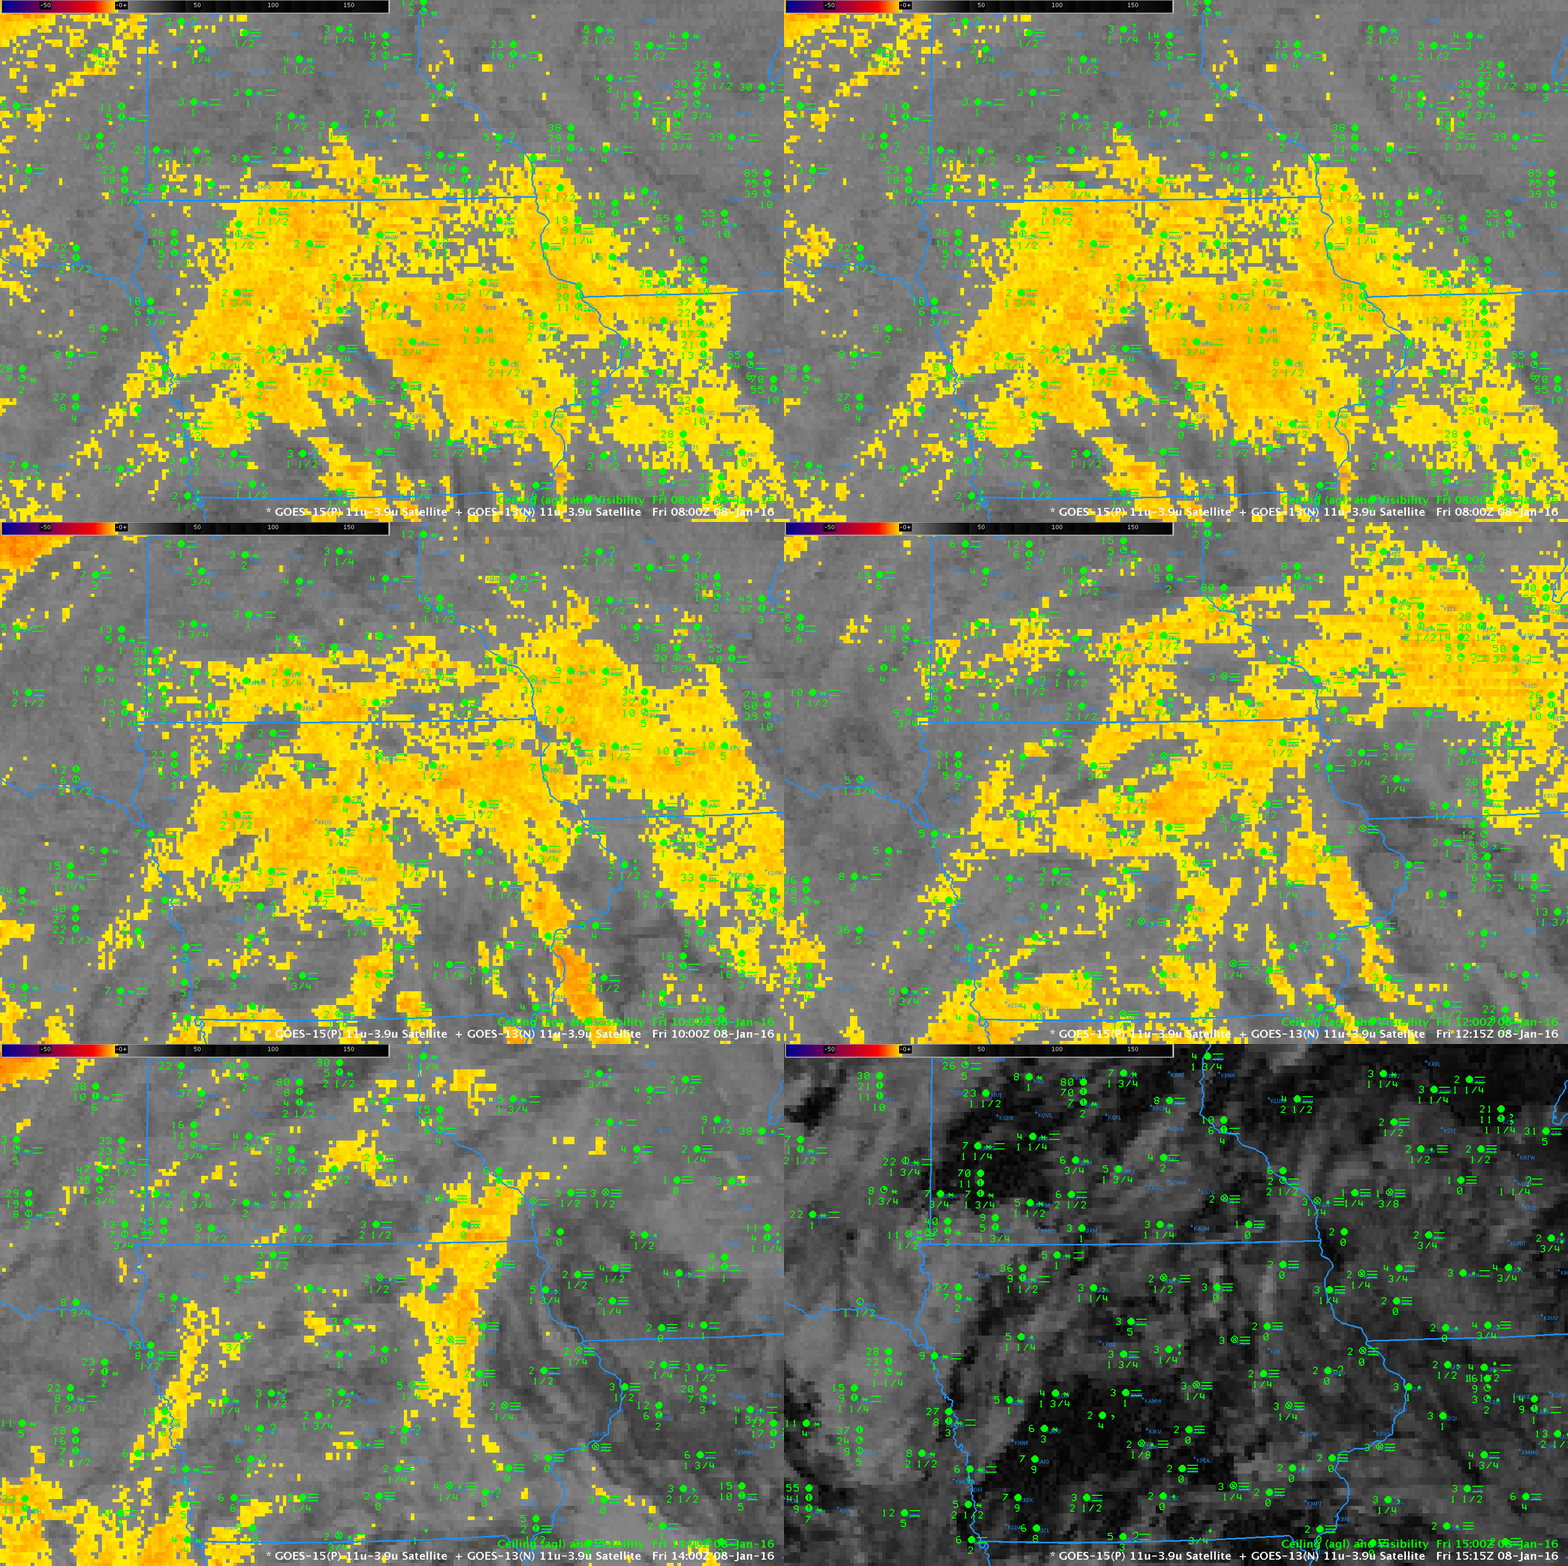
GOES-13 Brightness Temperature Difference values are shown below the IFR Probability field. There is little relationship between the Brightness Temperature Difference field and the reduced surface visibility/lowered ceilings. Note also how the character of the brightness temperature difference field changes as reflected solar radiance becomes important at sunrise.

GOESRIFR_08January2016_02_15anim

Hourly GOES-R IFR Probability fields, 0200-1500 UTC on 8 January 2015 (Click to enlarge)

GOES13BTD_08January2016anhim_0800_1515

GOES-13 Brightness Temperature Difference (10.7 µm – 3.9 µm) Fields, 0800-1500 UTC on 8 January 2015 (Click to enlarge)

Fog over the High Plains under Multiple Cloud Layers

GOESRIFR_0100_1400_06Jan2016anim

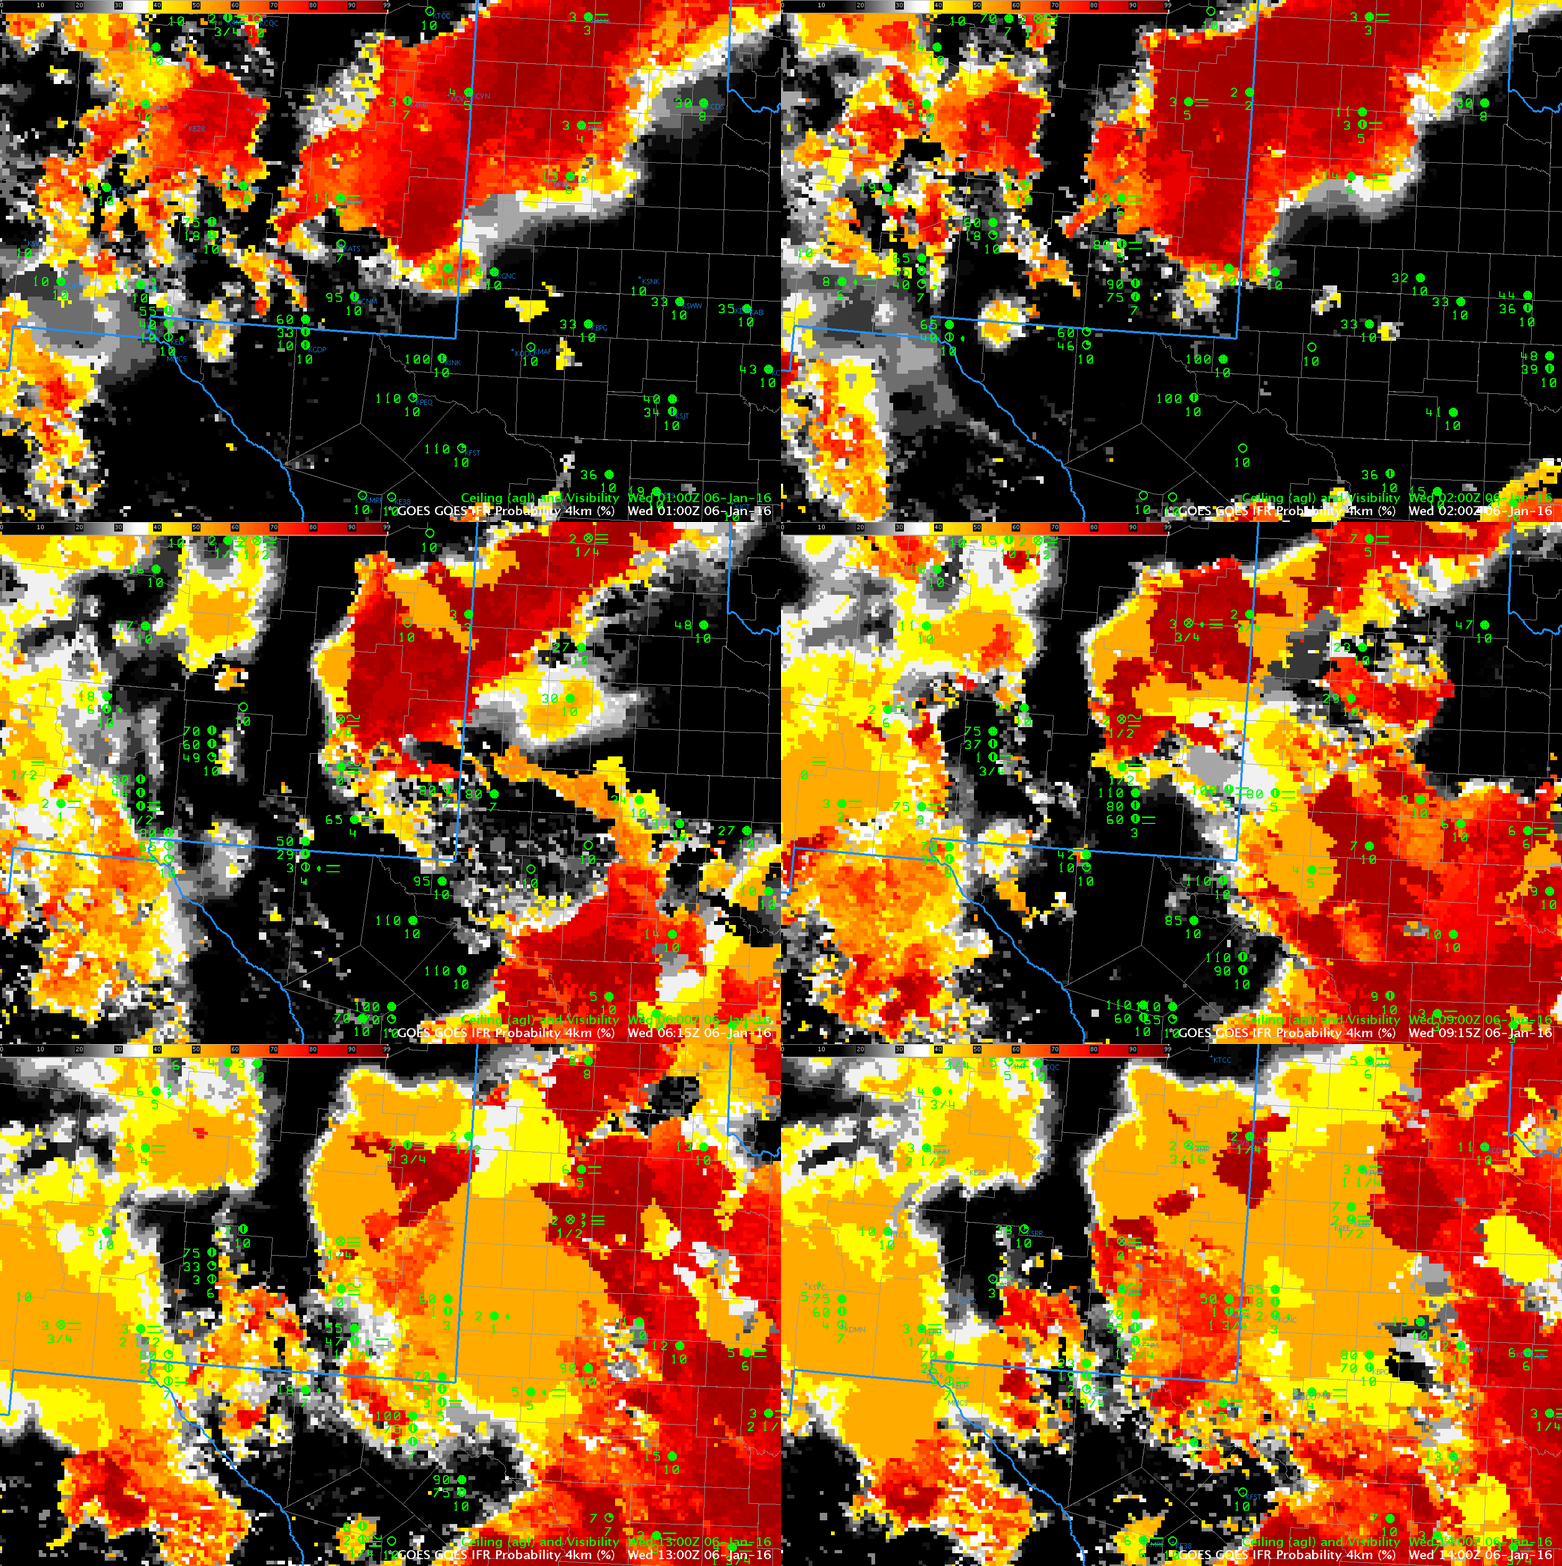
GOES-13 IFR Probability fields, 0100-1400 UTC, 6 January 2015, and surface observations of ceilings and visibility (Click to enlarge)

National Weather Service offices in El Paso and in Lubbock issued dense fog advisories for portions of their respective CWAs early on 6 January 2016. Moisture from a storm entering from the Pacific Ocean (as suggested by this graphic showing the GFS 00-h analysis from 1200 UTC showing the 300-mb jet) means multiple cloud layers. Higher clouds make satellite-only detection of low clouds difficult, and the animation above shows regions (north of Roswell — KROW — at the end of the animation, for example) where the flat GOES-R IFR Probability field suggests only Rapid Refresh data are diagnosing the probability of IFR conditions.

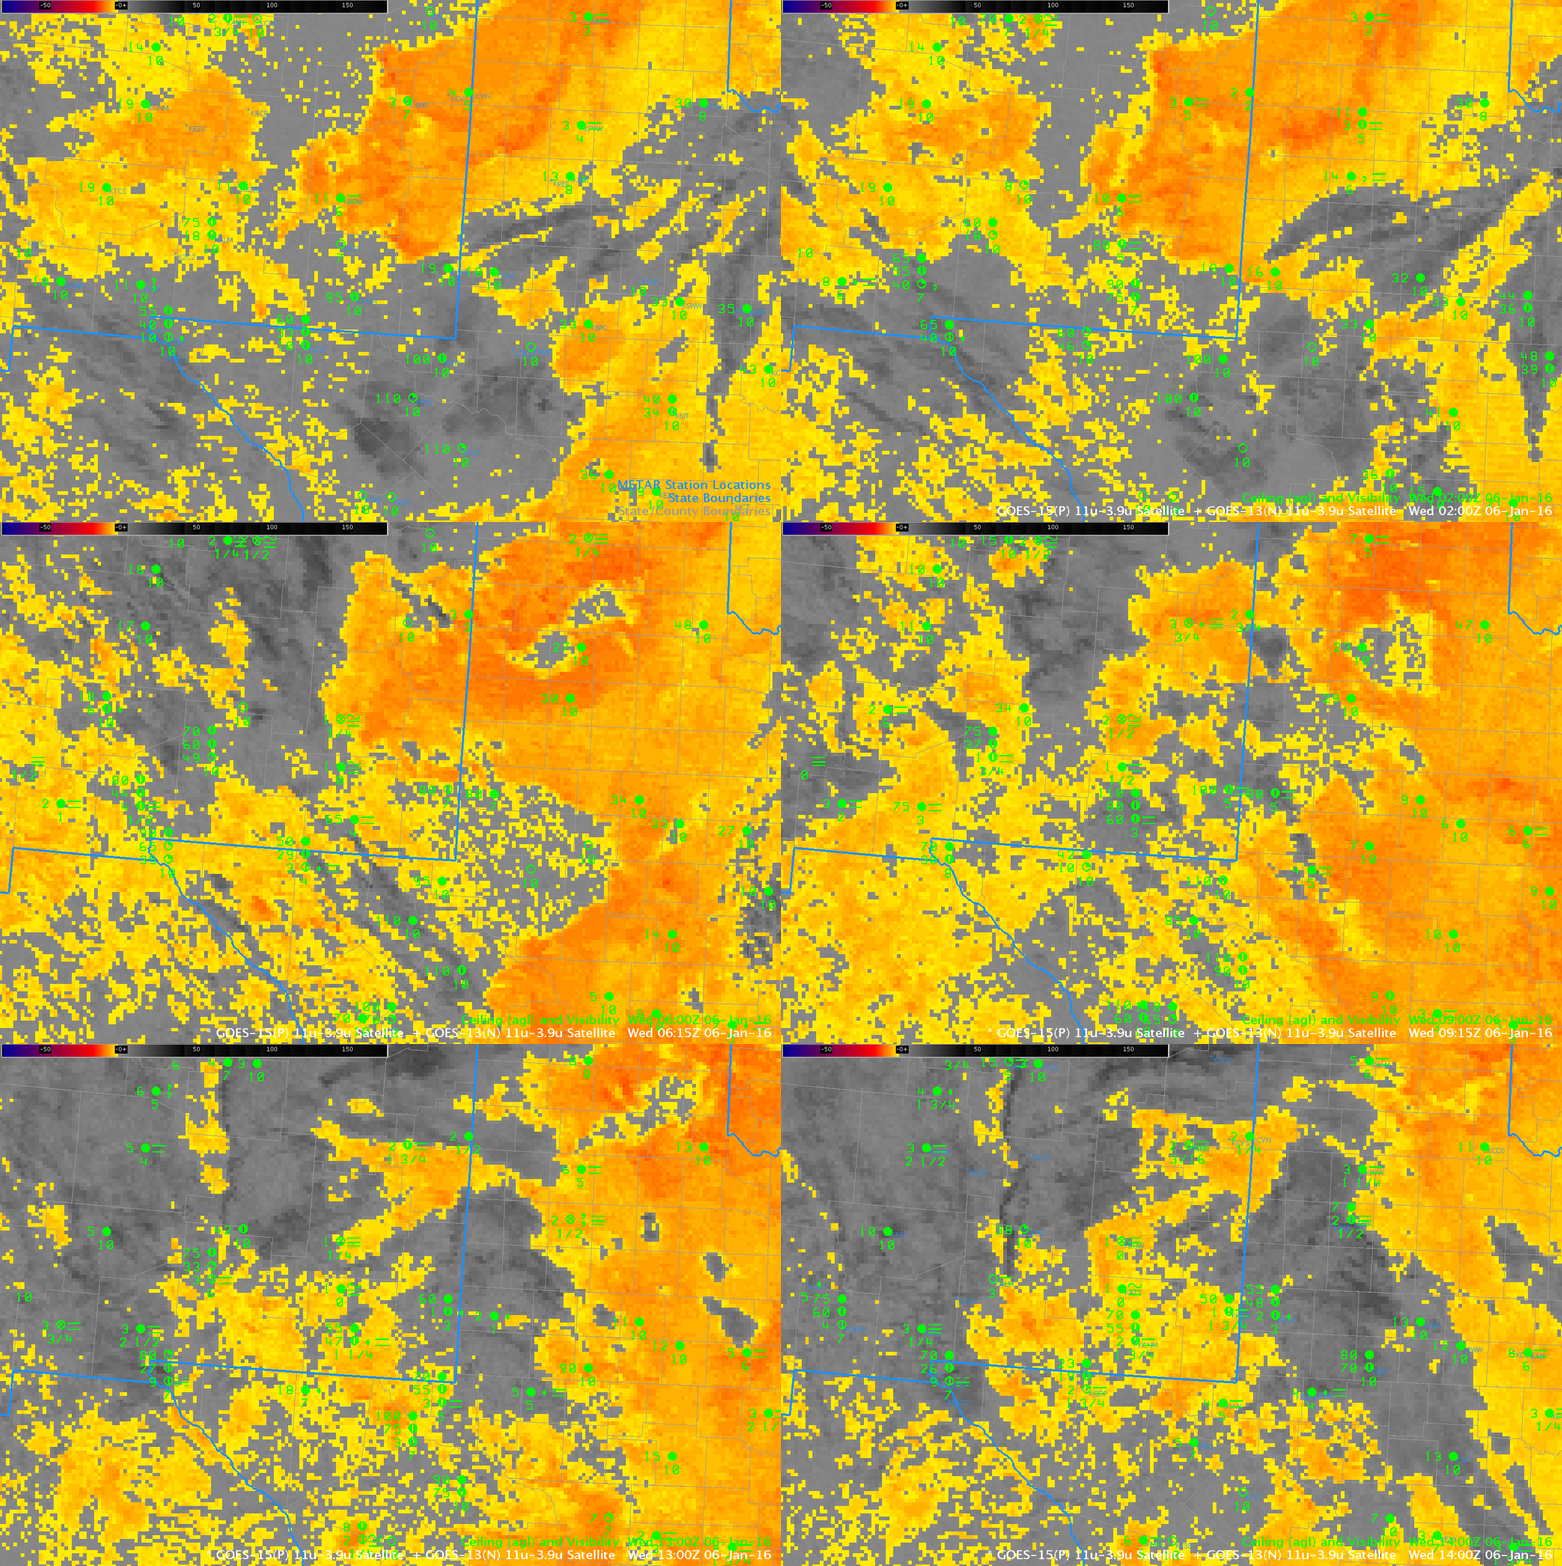
The Brightness Temperature Difference fields, below, for the same times as the IFR Probability fields at top, miss regions of reduced visibility under multiple cloud layers, and also have strong returns in regions of mid-level stratus. Because GOES-R IFR Probability incorporates information about saturation in the lowest 1000 feet of the atmosphere (in the form of Rapid Refresh Model Output), regions that are saturated in low levels that cannot be diagnosed as foggy by satellite alone because of mid-level/high-level clouds can be flagged as likely having IFR conditions, and regions that are flagged by the satellite as having stratus (stratus and fog can look very similar to a satellite) can be screened out if low-level saturation is not diagnosed in the model. Both of these actions serve to increase the GOES-R IFR Probability’s ability to diagnose correctly areas of low clouds/fog relative to brightness temperature difference fields alone.

One other advantage to GOES-R IFR probability fields: They are not strongly affected by changing amounts of 3.9 µm radiation around sunrise/sunset. In the animation below, note how at 1400 UTC (just past sunrise) the brightness temperature difference signal is collapsing. This is because increasing amounts of reflected solar 3.9 µm radiation are changing the difference between observed 10.7 µm and 3.9 µm radiation above water-based clouds. Little change occurs in the IFR Probability fields at this time however.

GOESBTD_0100_1400_06Jan2016anim

GOES-13 Brightness Temperature Difference (10.7µm – 3.9µm) fields, 0100-1400 UTC, 6 January 2015, and surface observations of ceilings and visibility (Click to enlarge)

Dense Fog over New England

GOES13_BTD_11dec2015animg

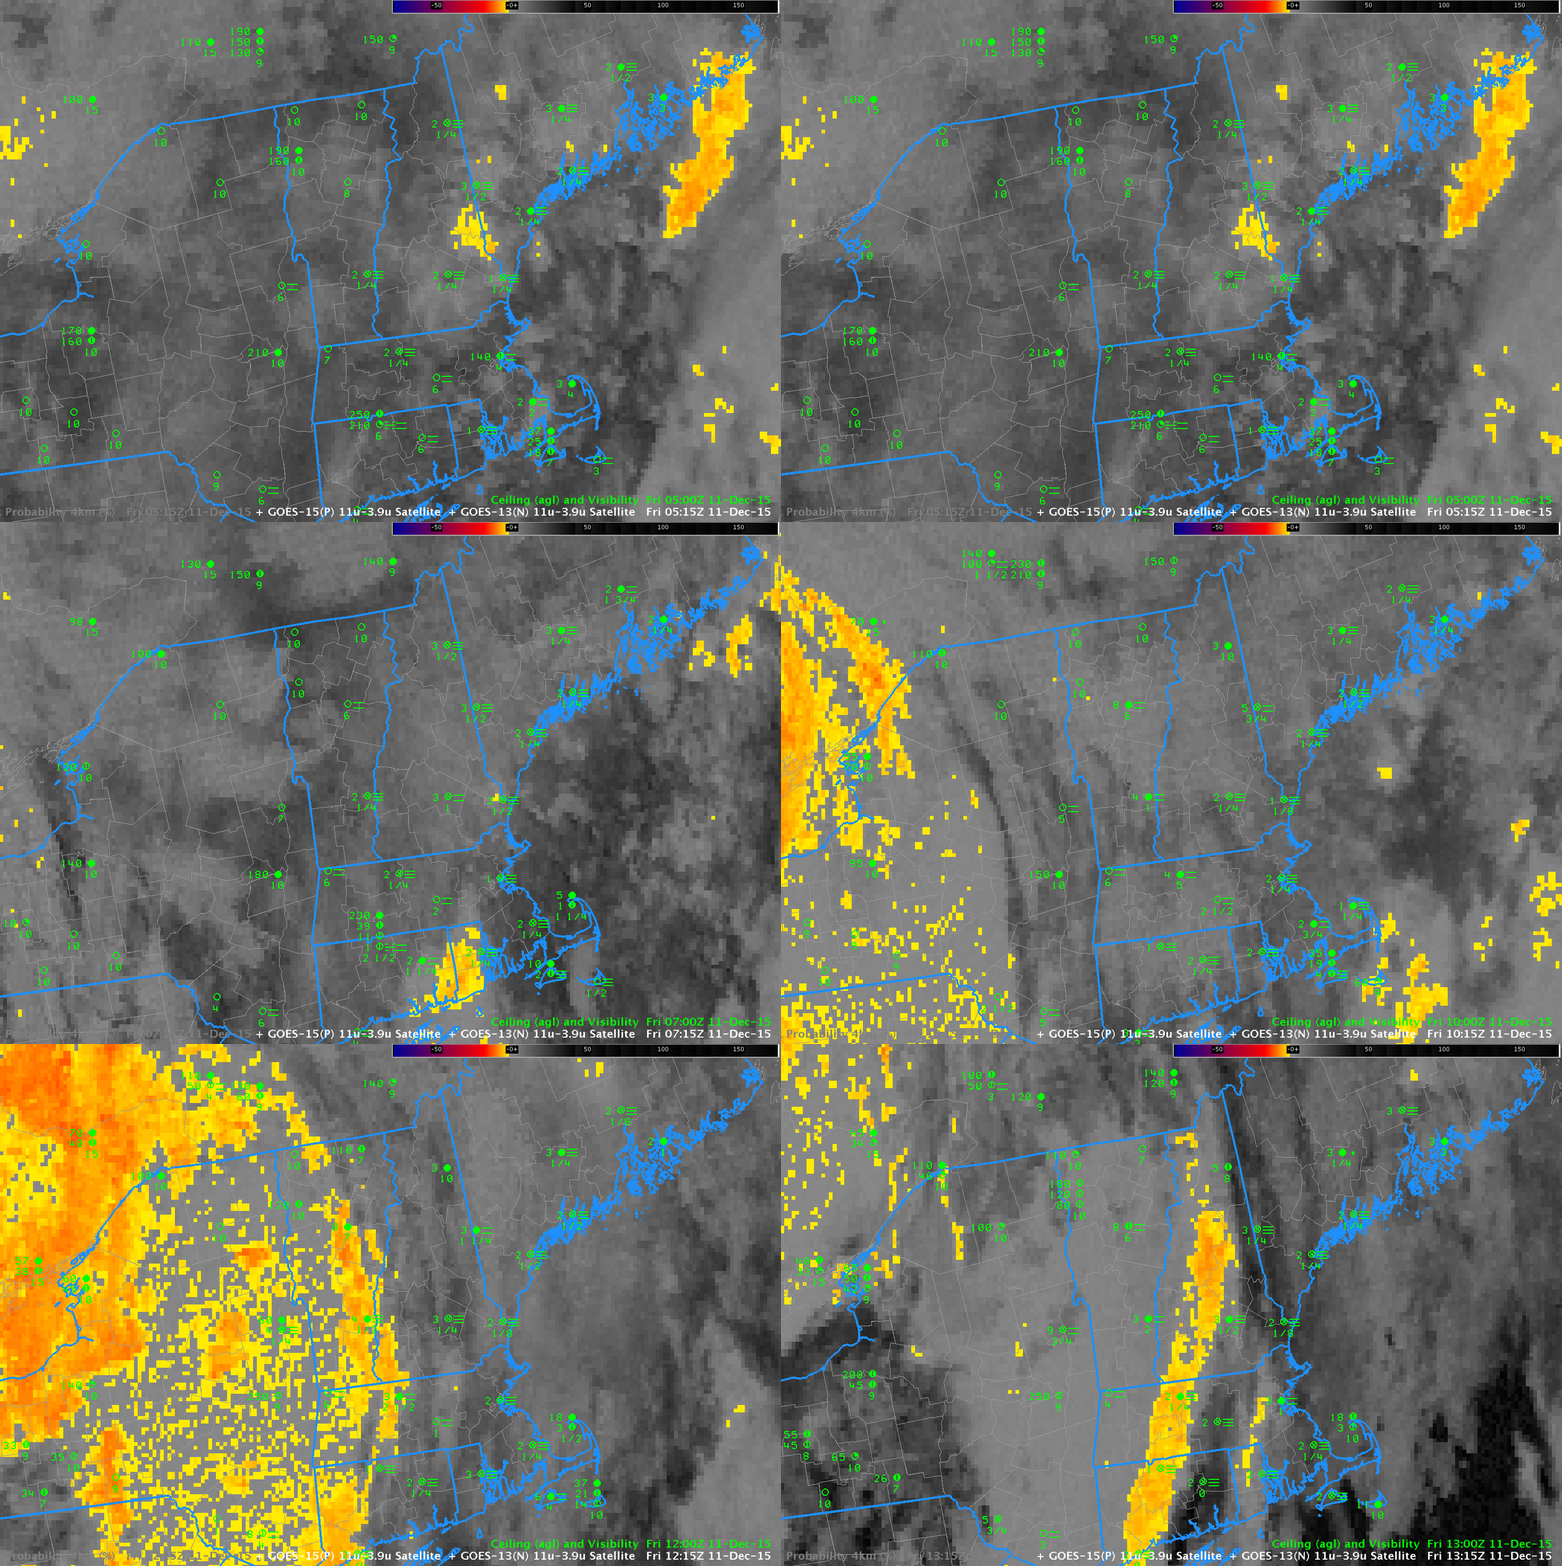
GOES-13 Brightness Temperature Difference Fields (10.7 µm – 3.9 µm), hourly from 0515 through 1315 UTC 11 December 2015 (Click to enlarge)

The brightness temperature difference field (10.7 µm – 3.9 µm), above, over New England during the morning of 11 December 2015 shows extensive cirrus cloud cover (a hole in the high clouds moves over Southern New England just before sunrise). Surface observations of ceilings and visibility show widespread IFR conditions, yet cirrus and mid-level clouds prevent a diagnosis of the low clouds.

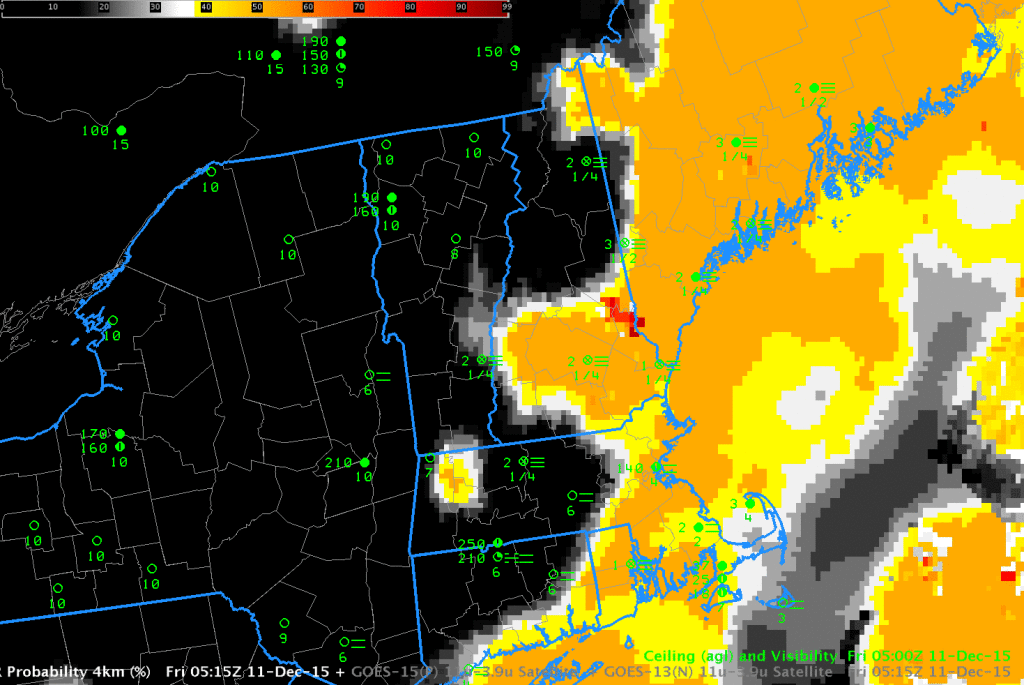
GOES-R IFR Probability fields for the same times, below, do show a strong signal (that is, higher probability of IFR conditions) in regions where IFR conditions are observed or where they have recently developed.  Because GOES-R IFR Probability fields incorporate information from the Rapid Refresh about low-level saturation.  Even if clouds decks obscure the view of near-surface clouds, as in this case, GOES-R IFR Probability fields, because they fuse together satellite data and surface information from the Rapid Refresh model, can provide useful information.

GOES13_IFR_11dec2015anim

GOES-R IFR Probability Fields, hourly from 0515 through 1315 UTC 11 December 2015 (Click to enlarge)

Central Valley Fog under High Clouds

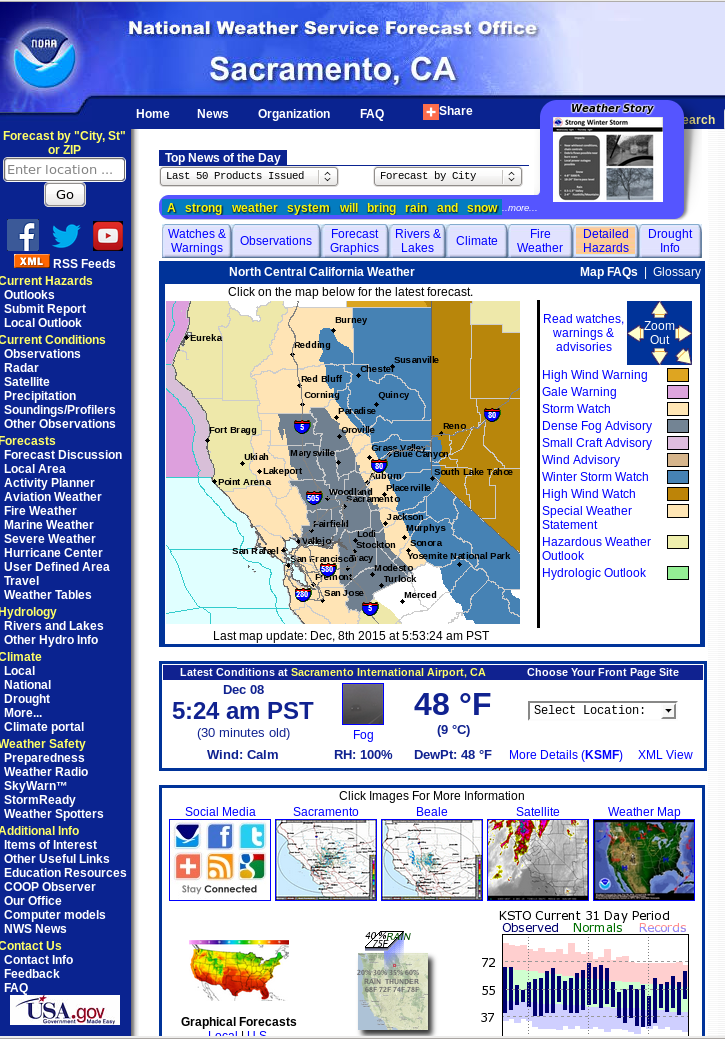
A potent storm in the Gulf of Alaska (Link to surface map) is allowing high clouds to spread inland over much of the west coast of the United States. Dense fog has formed underneath that cloud deck in the California’s Central Valley, and advisories have been issued (Scroll down to see the screen-grab of the NWS Sacramento Office Website). How can satellite products be used to detect such a fog that is hidden by high clouds?

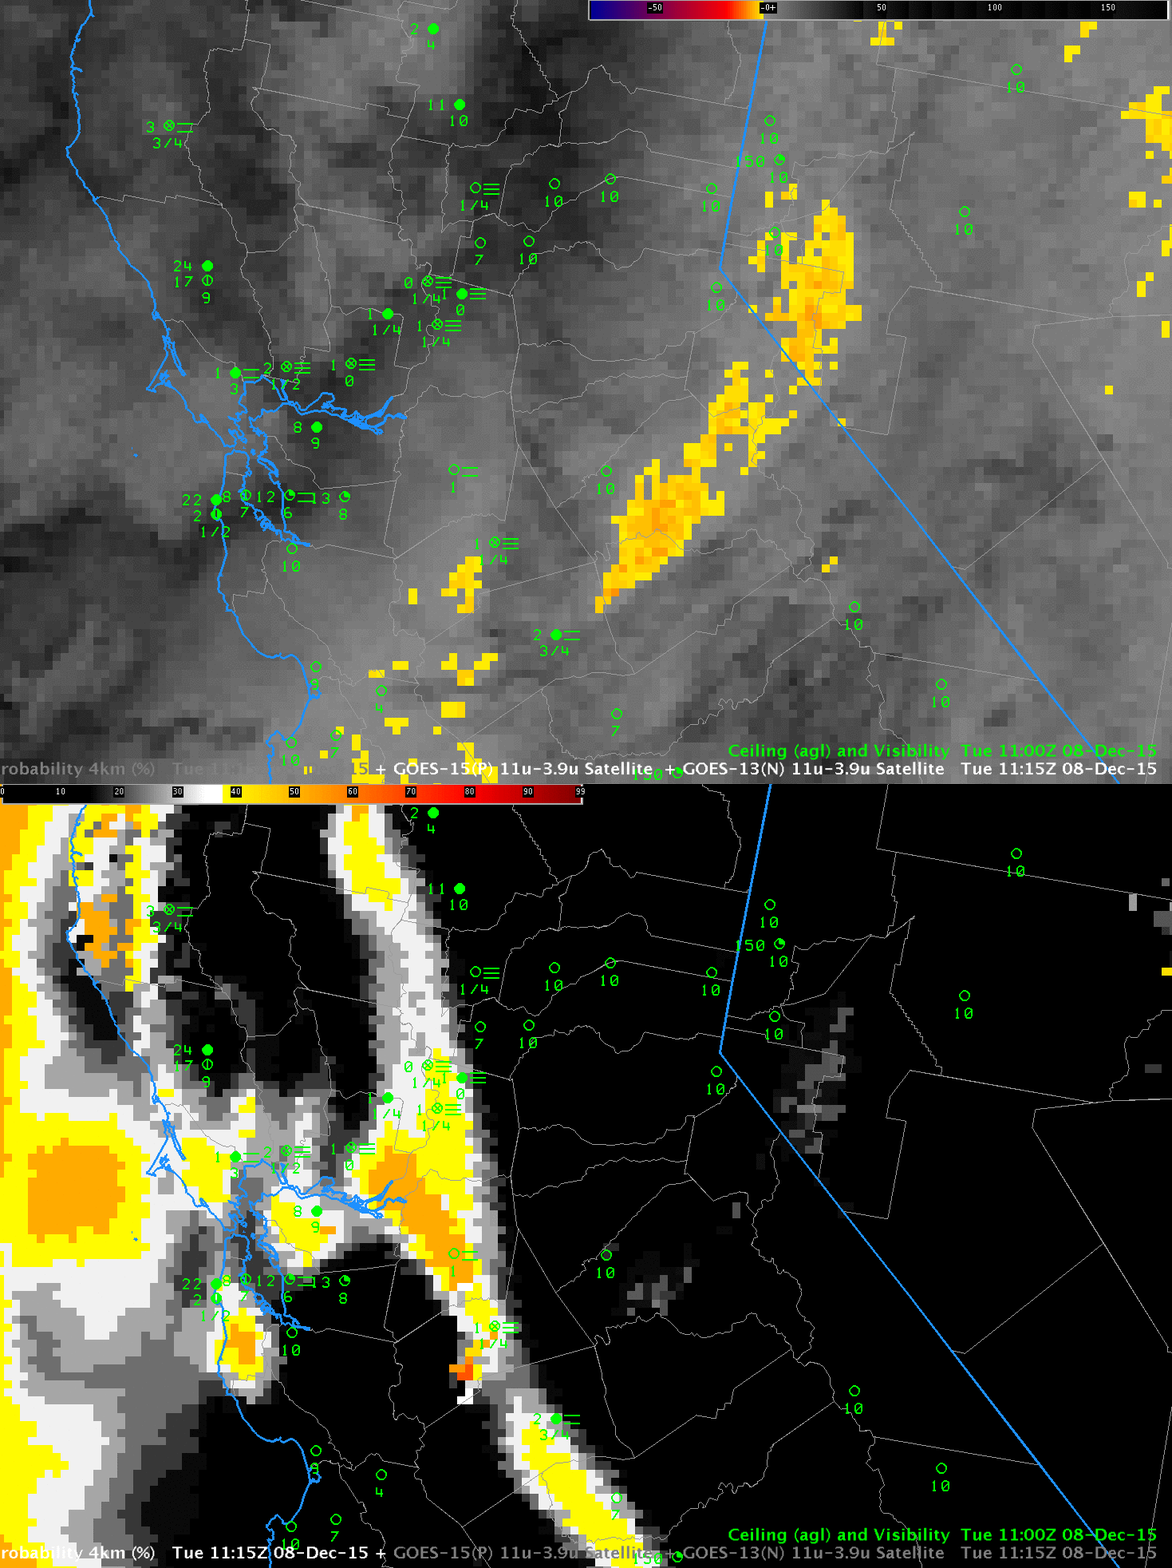
The toggle below shows the GOES-15 Brightness Temperature Difference fields (with a pattern characteristic of mostly high (ice) clouds with a few breaks in the high cloud allowing the satellite to view lower water-based clouds) and the GOES-R IFR Probability field.  IFR Probability is correctly alerting any forecaster to the probability that IFR conditions are occurring in the Central Valley.  IFR Probability fuses information from the Satellite (not particularly helpful in this case) and information from the Rapid Refresh Model predictions of low-level saturation.  The Rapid Refresh is correctly diagnosing the presence of saturation, and IFR Probabilities are enhanced over the Central Valley.

BTD_GOESIFR_1115_08dec2015toggle

GOES-15 Brightness Temperature Difference and GOES-R IFR Probability fields, 1115 UTC on 8 December 2015 (Click to enlarge)

SacramentoNWS

IFR Conditions with a strong extratropical Cyclone

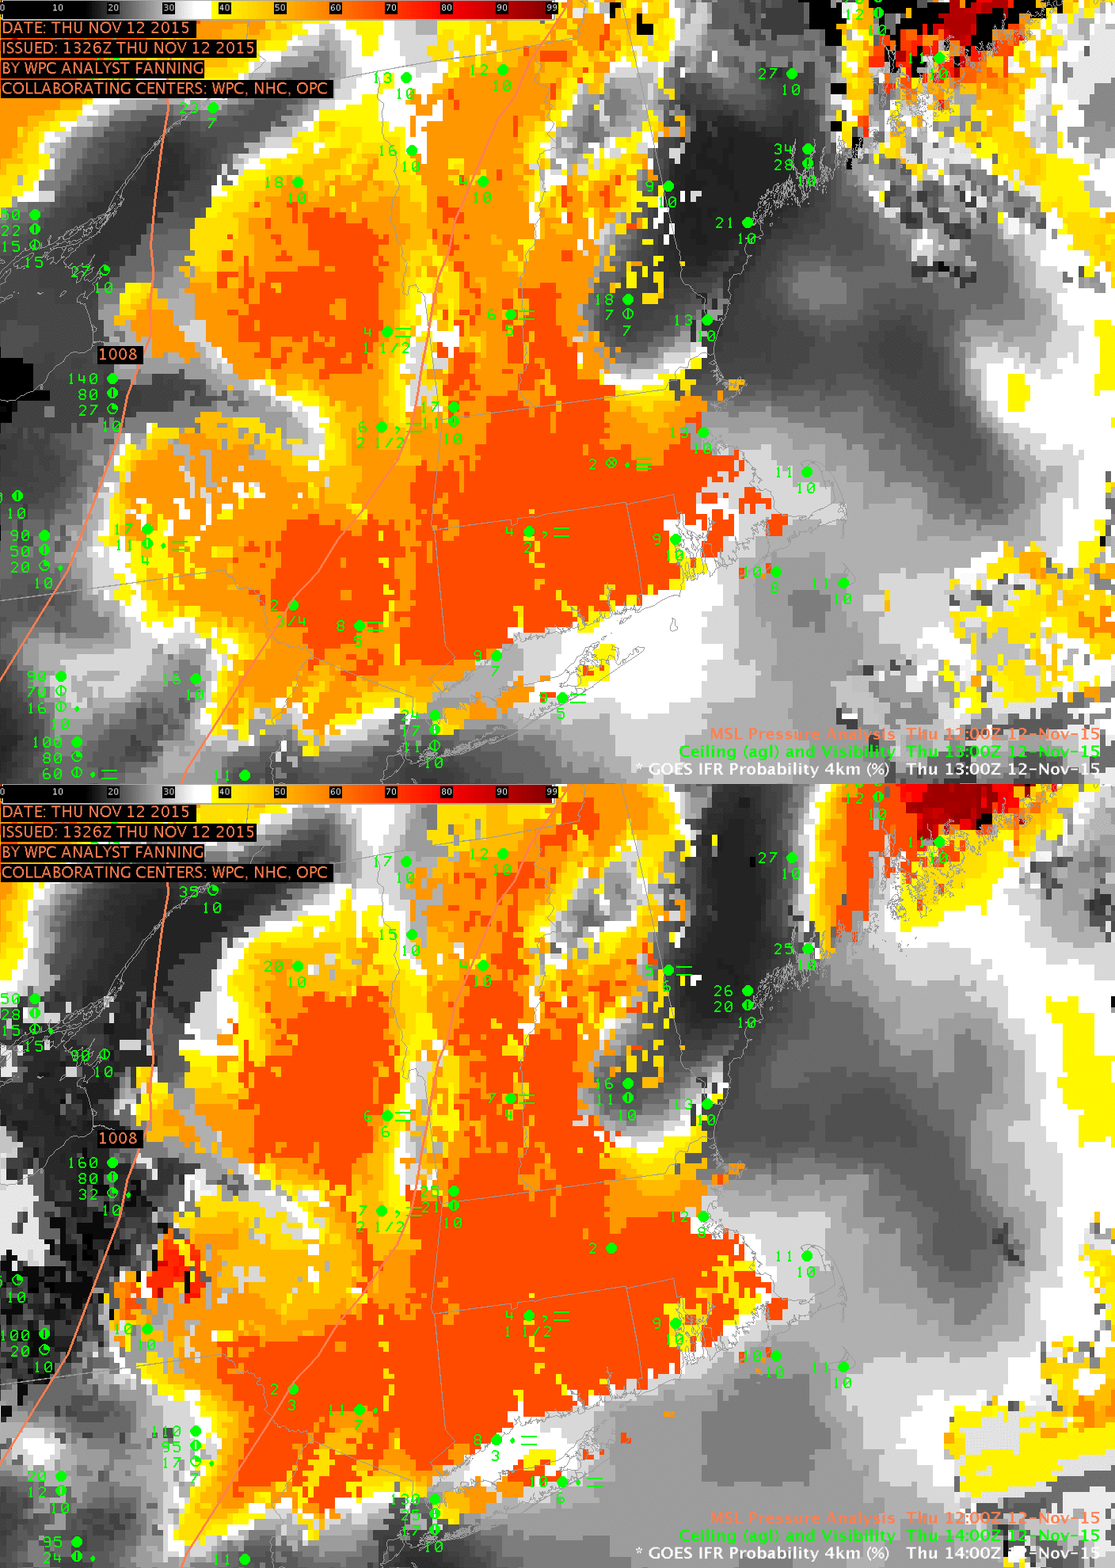
NewEngland_1300_1400_12Nov2015toggle

GOES-R IFR Probability Fields (from GOES-13 and the Rapid Refresh Model), 1300 and 1400 UTC on 12 November 2015 (click to enlarge)

Strong Extratropical Cyclones, such as the one affecting the central and eastern United States on 11-12 November 2015 (1200 UTC Map on 12 November is here), generate multiple levels of clouds that make it difficult to detect fog/low stratus from satellite, because intervening cloud layers get in the way. GOES-R IFR Probability fields, however, because they incorporate near-surface information from the Rapid Refresh Model, can yield useful information about the likelihood of IFR Conditions. The toggle above shows data at 1300 and 1400 UTC over the northeast United States.  Highest IFR Probabilities are removed from the coastlines of New England — as observations confirm.  Note how the Adirondack and Catskill regions have higher probabilities, where terrain is reaching up into the stratus deck.  Features in the IFR Probability field are strongly related to surface-based observations of fog and low stratus.

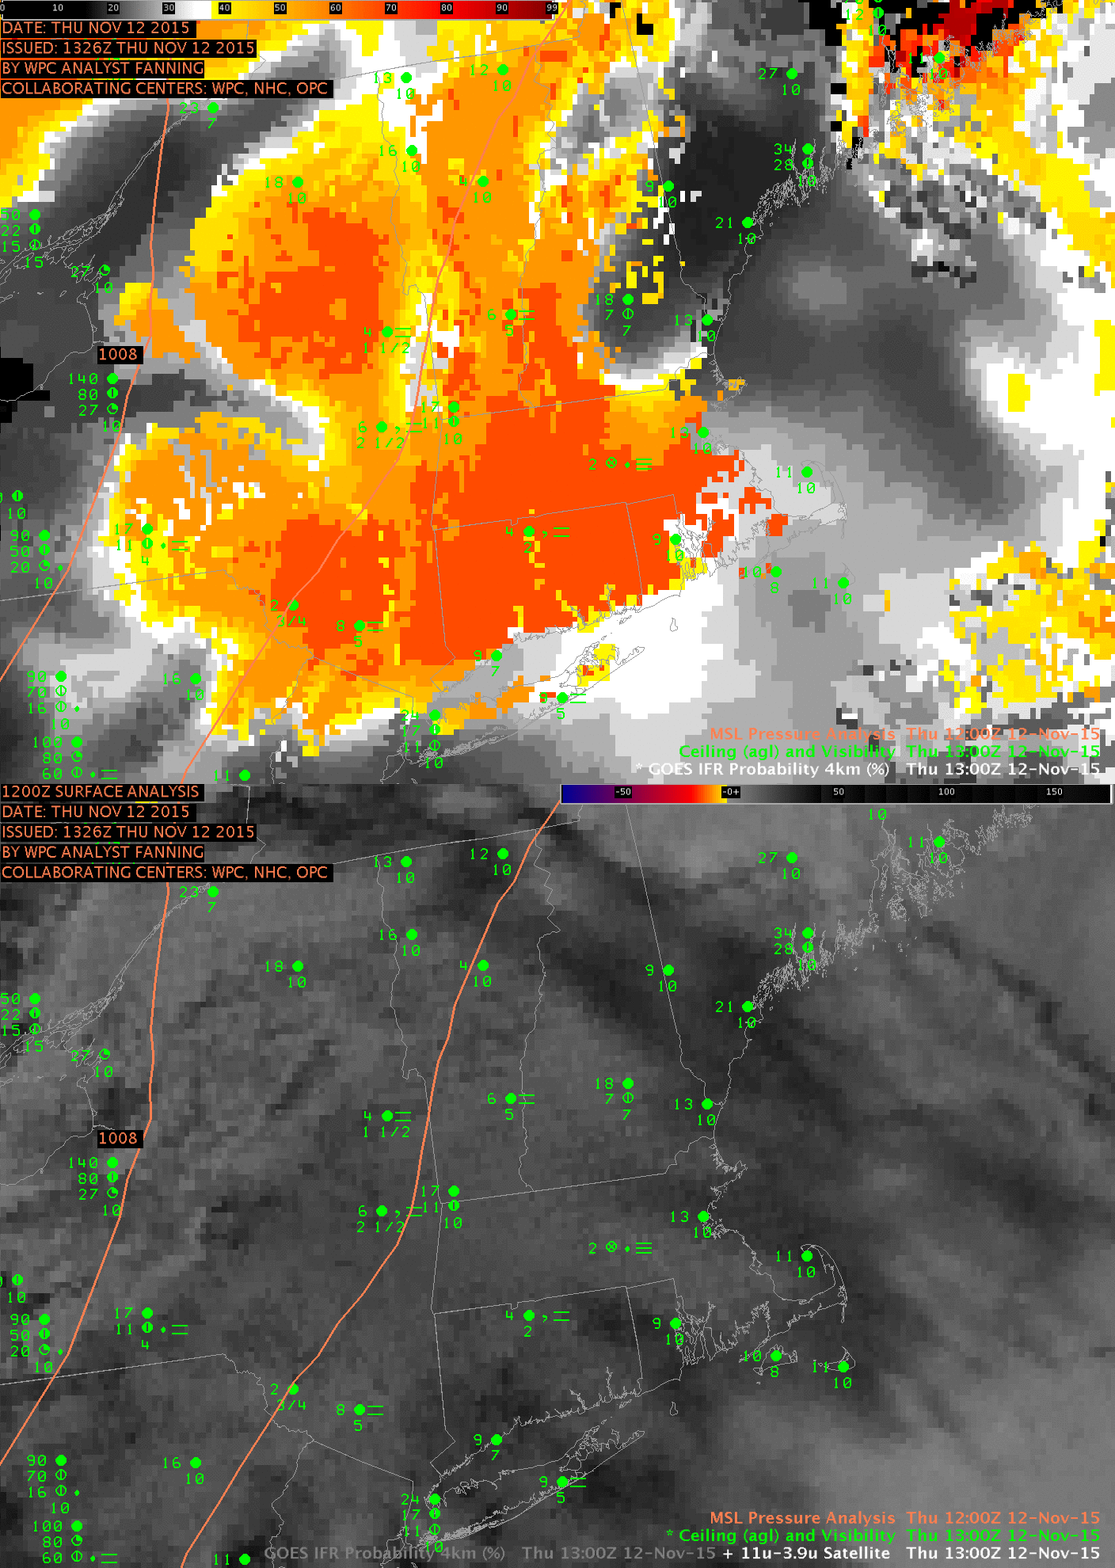
The toggle below shows IFR Probability fields and GOES-13 Brightness Temperature Differences as 1300 UTC.  Features in the brightness temperature difference field have no relationship to surface-based observations of fog and low stratus.

NewEnglandIFR_BTD_1300_12Nov2015toggle

GOES-R IFR Probability Fields (from GOES-13 and the Rapid Refresh Model) and GOES-13 Brightness Temperature Difference fields (10.7µm – 3.9µm), 1300 UTC on 12 November 2015 (click to enlarge)

Benefit of fused data over Oklahoma

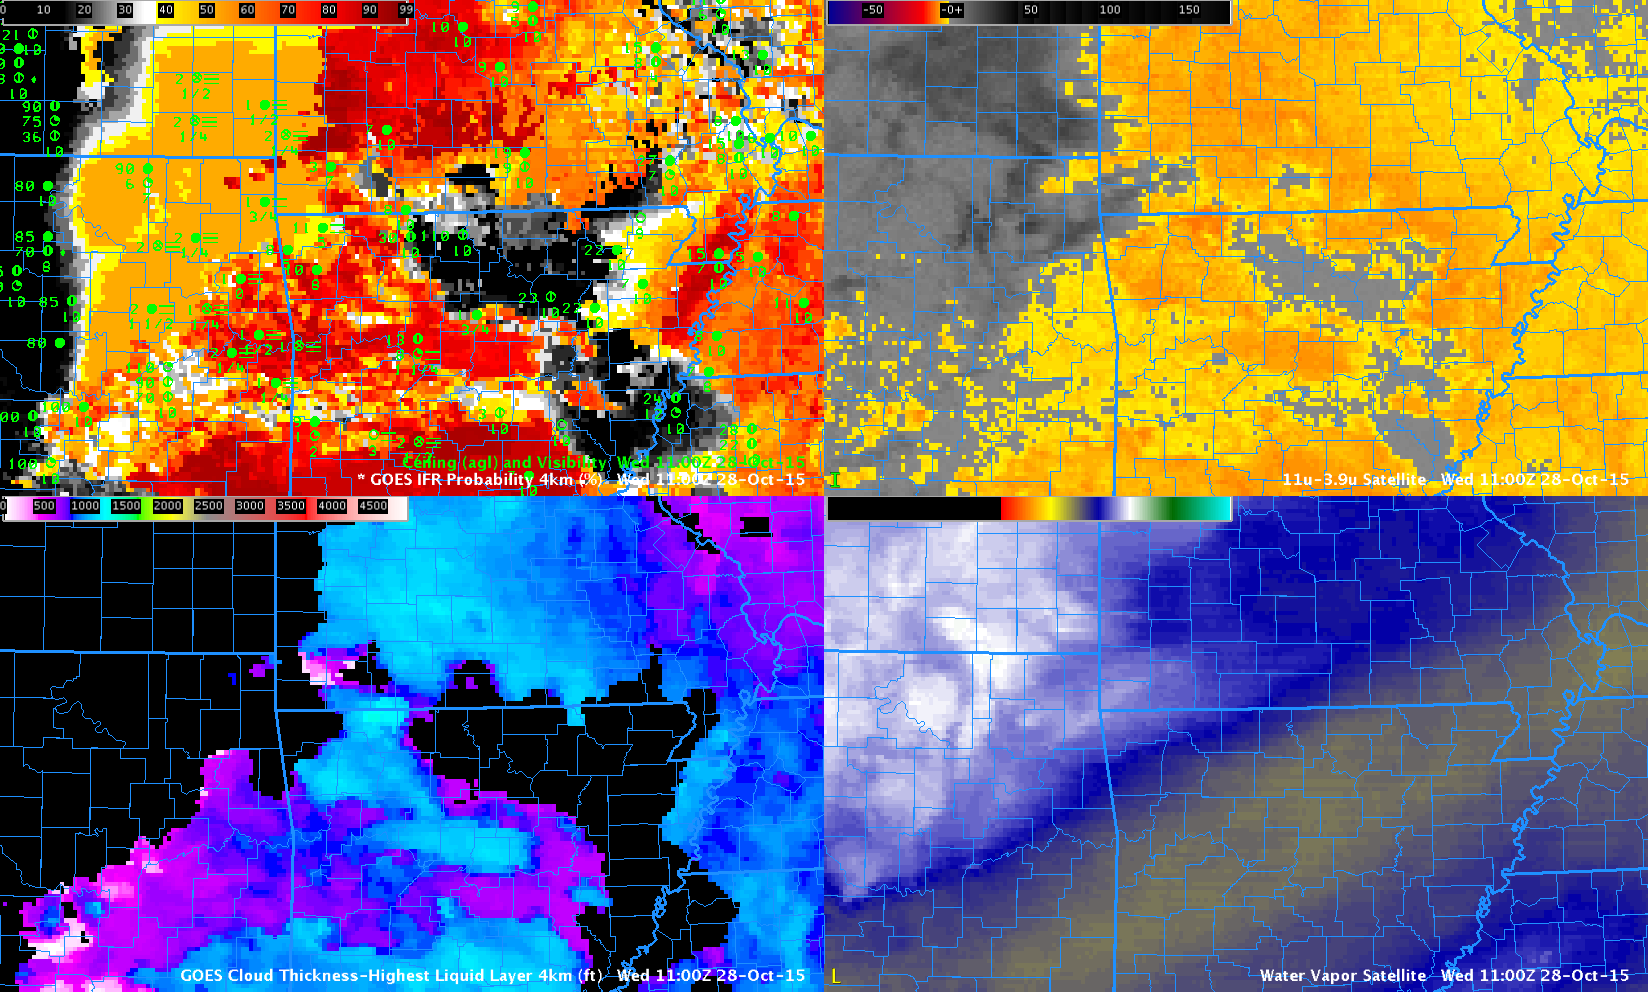
NW_Ark_NE_OK_1100UTC_28Oct2015

GOES-R IFR Probabilities (Upper Left), GOES-R Cloud Thickness (Lower Left), GOES-13 Brightness Temperature Difference (10.7 µm – 3.9 µm) (Upper Right), GOES-13 Water Vapor Infrared Imagery (6.5 µm) (Lower Right), all at 1100 UTC on 28 October 2015 (Click to enlarge)

Fused Data is beneficial in the detection of low ceilings and reduced visibilities. Consider the region in northeastern Oklahoma where cirrus has overspread low clouds and dense fog is reported on the ground. The satellite view of the low clouds is obscured by the cirrus; the brightness temperature difference signal is not one associated with fog/low stratus. However, GOES-R IFR Probability fields maintain a signal because Rapid Refresh model output is used; saturation is occurring in the lowest 1000 feet of the model over eastern OK, and the GOES-R IFR Probability is larger there as a result. (Dense Fog Advisories were issued for this event).

Dense Fog Detection over western North Dakota under Cirrus

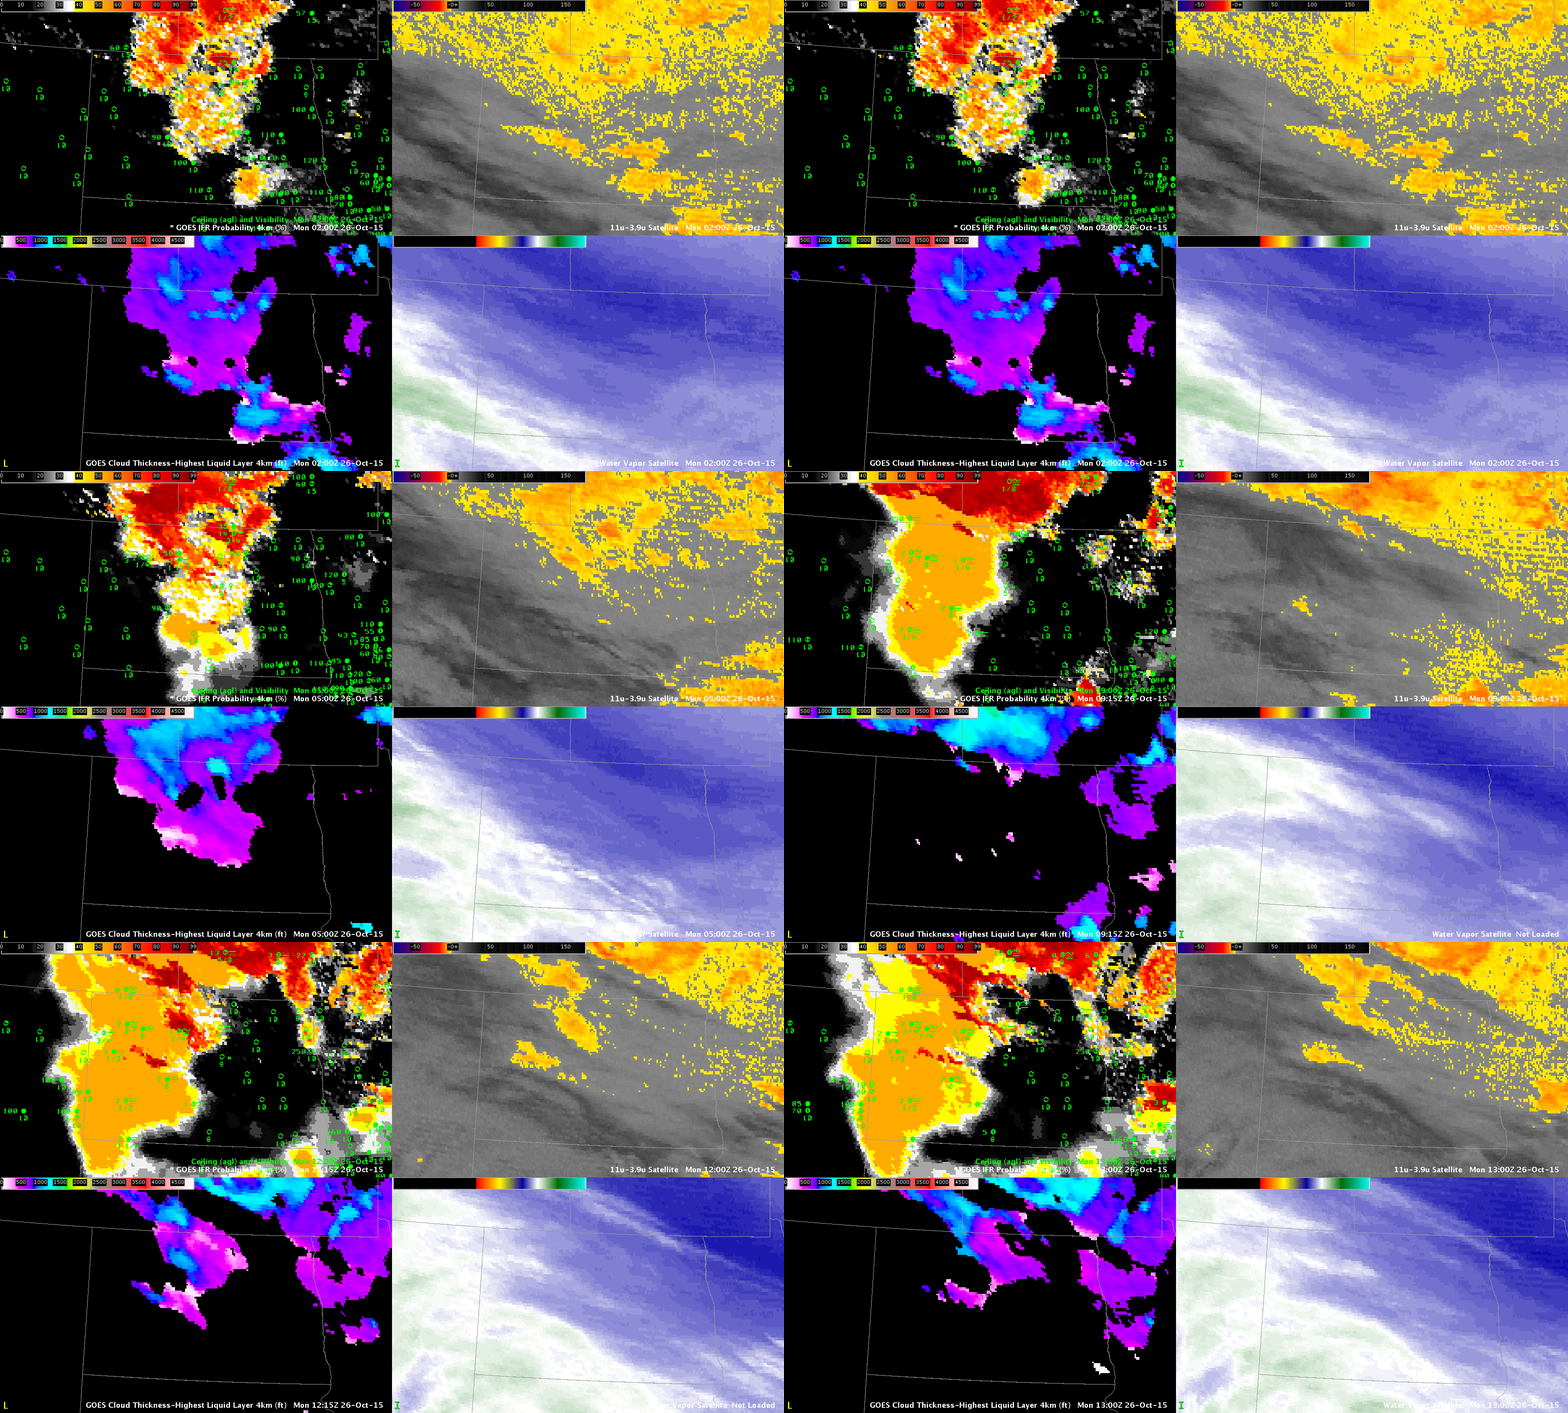
4Panel_0200_1300_26Oct2015anim

GOES-R IFR Probabilities (Upper Left), GOES-R Cloud Thickness (Lower Left), GOES-13 Brightness Temperature Difference (10.7 µm – 3.9 µm) (Upper Right), GOES-13 Water Vapor Infrared Imagery (6.5 µm) (Lower Right) (Click to enlarge)

Dense fog formed over western North Dakota early in the morning of Monday 26 October (and advisories were issued). At the same time, cirrus clouds overspread the region, making satellite detection of the low clouds problematic. This is an excellent example of the benefits of a fused product that blends surface and near-surface information from numerical models with satellite detection. When one of the products gives no information, the other can be relied upon to fill in gaps.

In the example above, dense fog develops over western North Dakota, complete with freezing drizzle. Satellite detection of the low clouds on this date was difficult because of widespread cirrus that overspread the state; these cirrus are apparent in both the water vapor (lower right) and the brightness temperature difference (upper right). When model data principally are used to compute the IFR Probability fields — in regions where high clouds prevent a satellite view of low clouds — the character of the field is flatter and less pixelated. In addition, where high clouds cannot view low clouds, the Cloud Thickness cannot be computed (as it relates 3.9µm emissivity to cloud thickness). Note that there are regions where the cirrus thins enough that low clouds can be viewed — in these regions the Cloud Thickness is computed an the IFR Probability increases (where both Cloud Predictors and Model Predictors can be used, IFR Probabilities are larger).

Fog under high clouds in Indiana

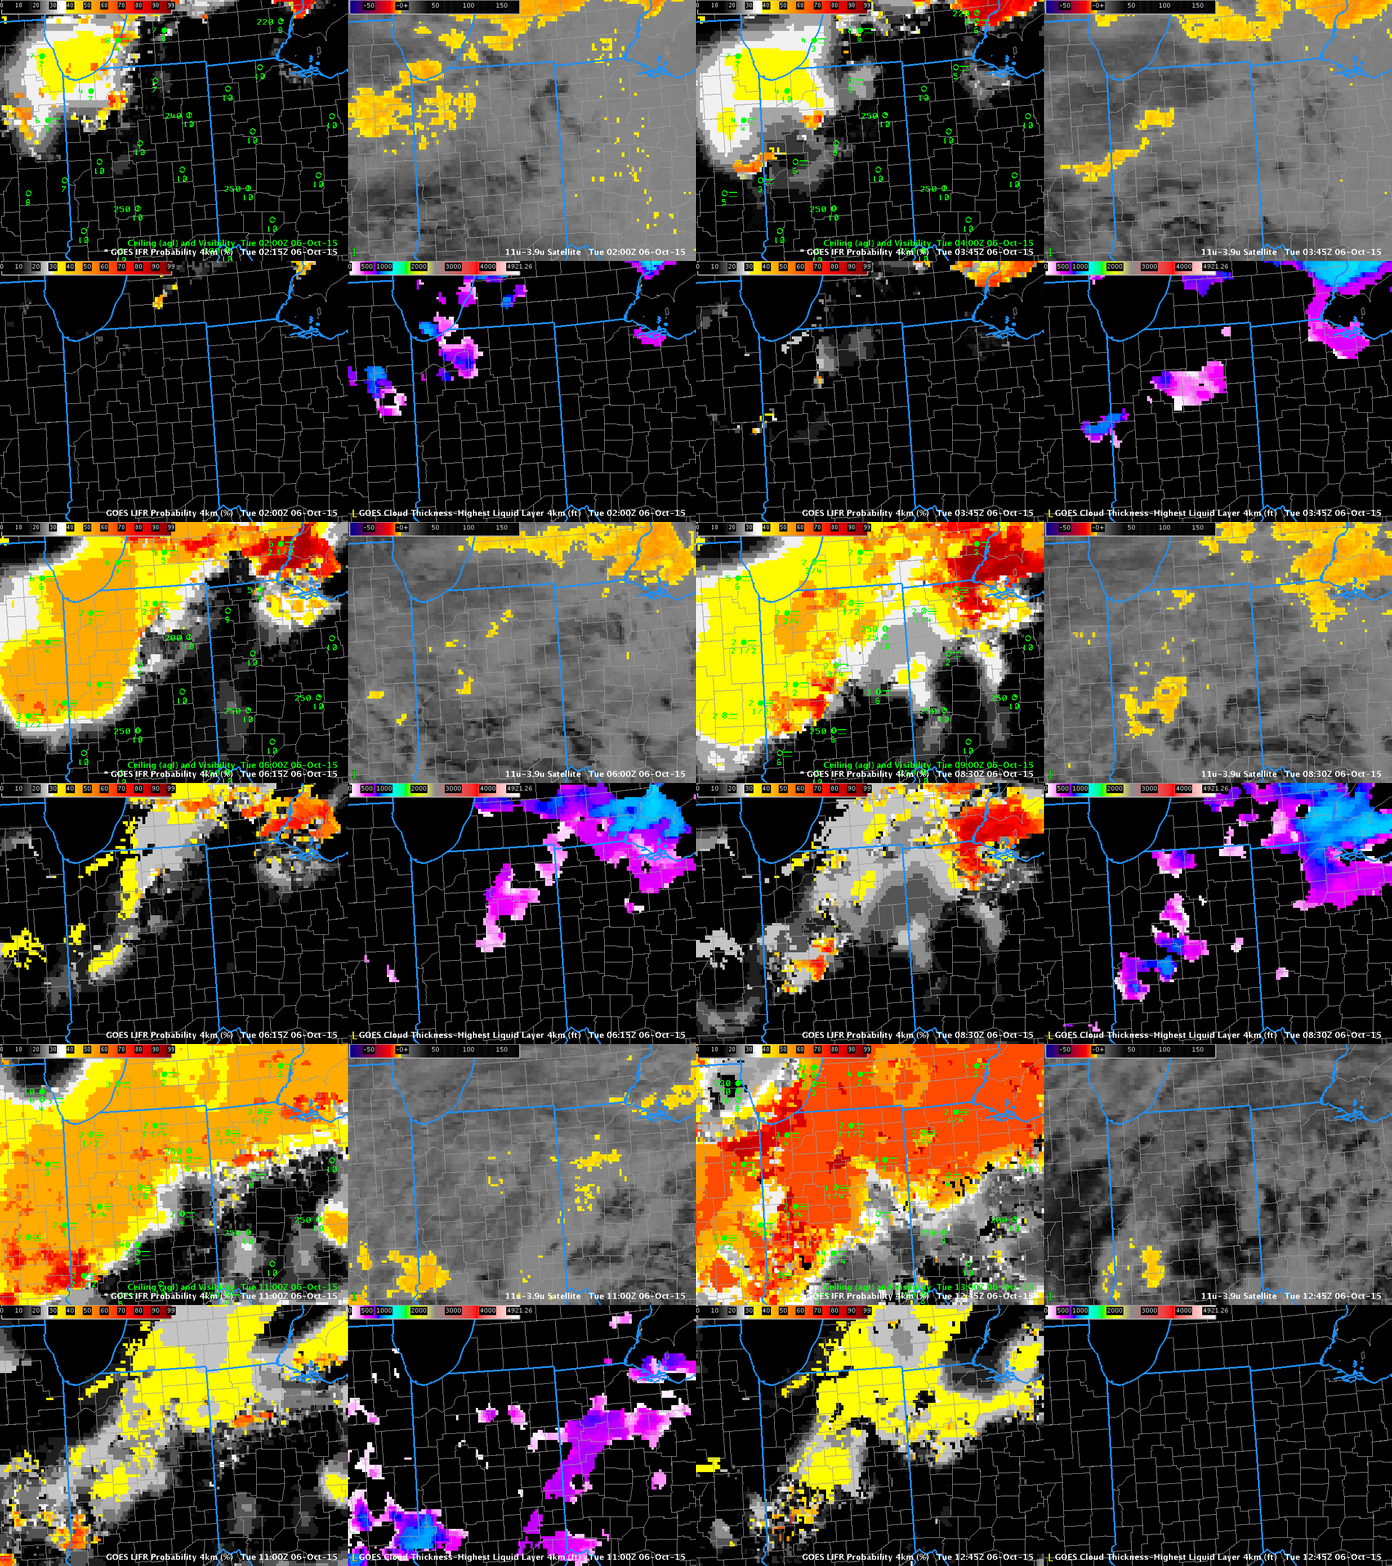
Indiana_06Oct2015_02_12_anim

GOES-R IFR Probability (Upper Left), GOES-R Low IFR Probability (Lower Left), GOES-13 Brightness Temperature Difference (10.7µm – 3.9µm) (Upper Right), GOES-R Cloud Thickness (Lower Right) (Click to enlarge)

Fog developed over Indiana and surrouding states (again) on the morning of 6 October, and the animation above traces that development as diagnosed by GOES-R IFR Probability fields. Multiple cloud layers over the region meant that the Brightness Temperature Difference field, a traditional method of low cloud detection (that keys on the differences in emissivity at 10.7 and 3.9 in water-based clouds) could not be used because low cloud detection was hampered by the presence of high clouds. The fused product, GOES-R IFR Probability, provides useful information by combining Rapid Refresh Data information about low-level saturation with satellite fields. When satellite information about low clouds are missing, as in this case, model data provides a signal.

Because multiple cloud layers exist, the GOES-R Cloud Thickness Product (that diagnoses the depth of the lowest water-based cloud based on an empirical relationship between 3.9 µm emissivity and cloud depth developed using sodar observations off the West Coast of the United States) is not produced over much of the region. It is also not produced at times of twilight — such as those that occur at the end of the animation. There are values over southeastern lower Michigan at the start of the animation, where high clouds were not present.

Low IFR Probability is also shown in the animation above (Lower Left figures). The small values in this case suggest any fog is unlikely to be producing visibilities less than 1 mile or ceilings less than 500 feet.

IFR Probability across the Midwest under cirrus

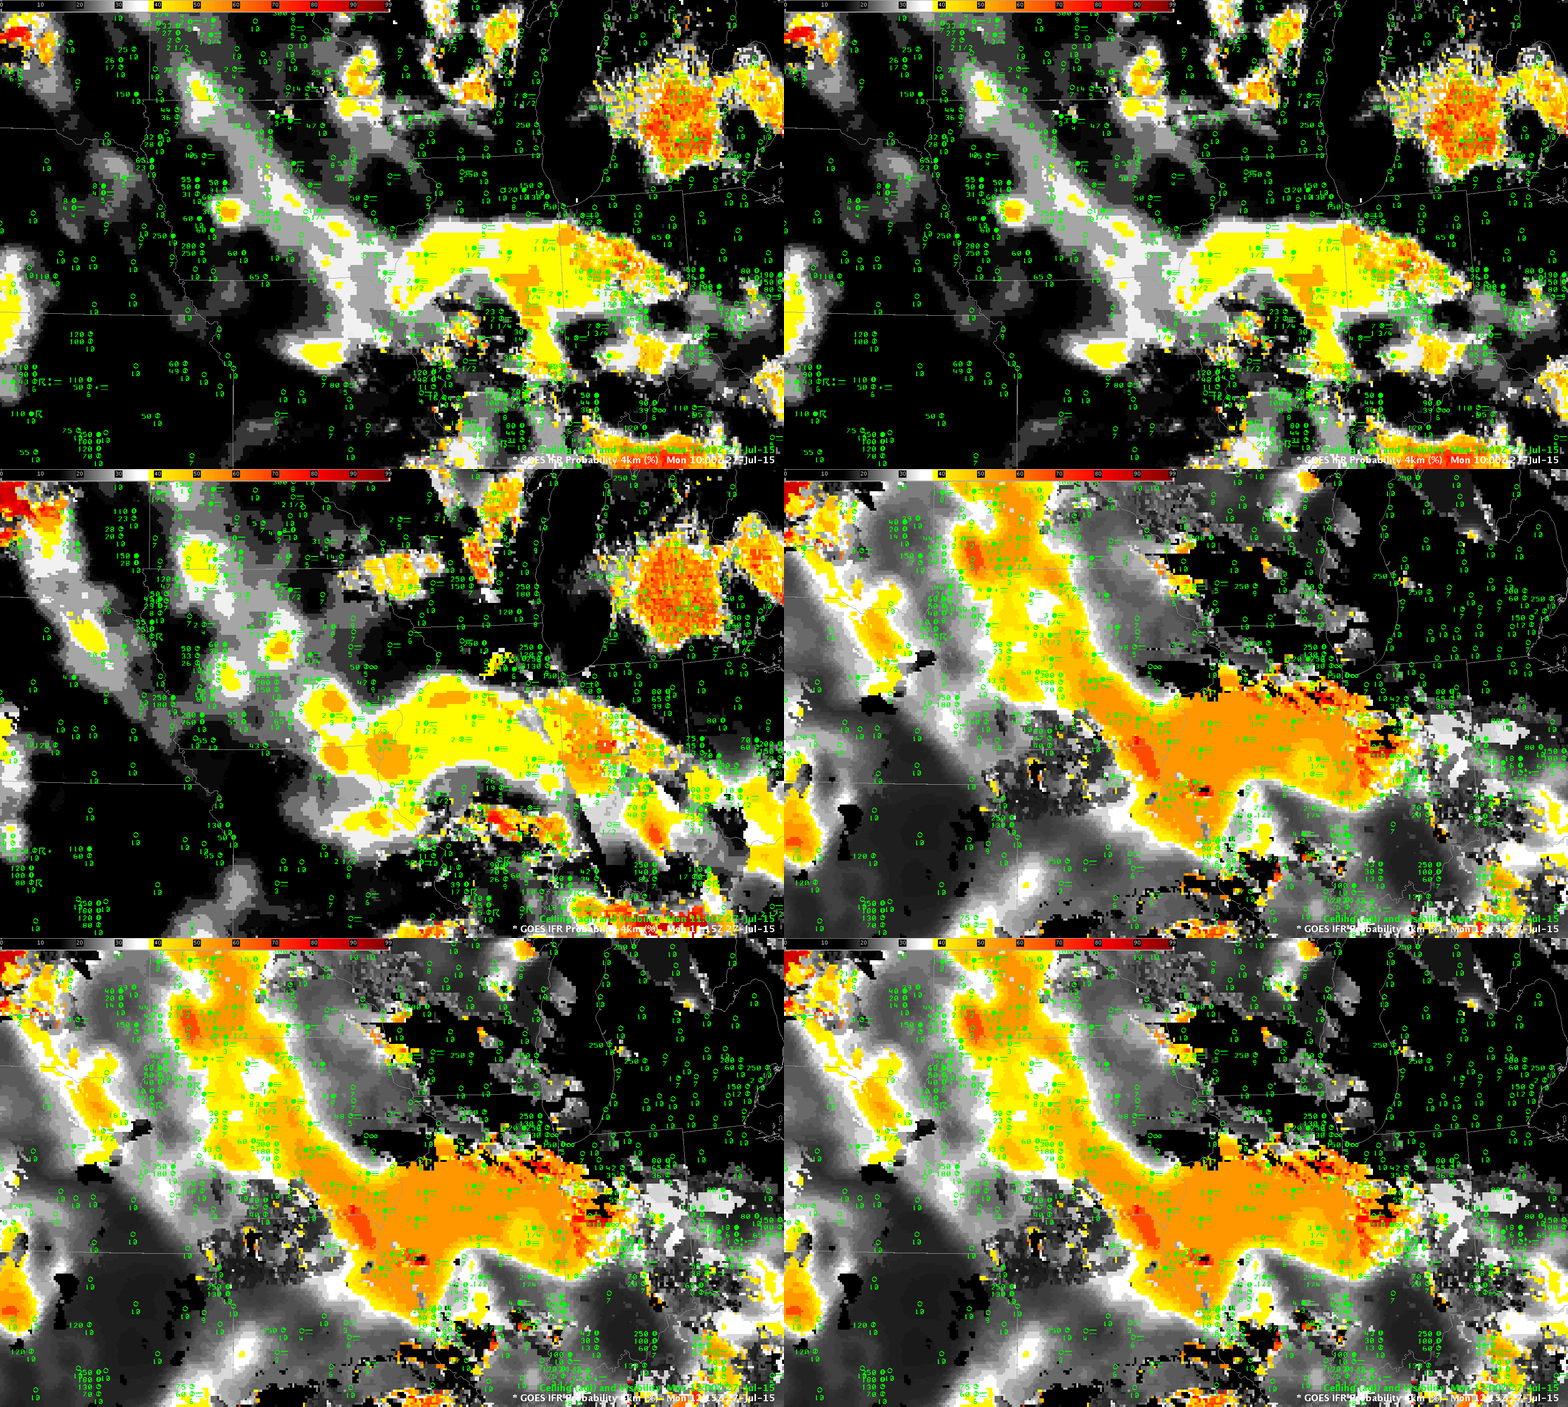
Midwest_1000_1215_27July2015_GOES13_IFRPROBanim

GOES-R IFR Probability fields, 1000, 1115 and 1215 UTC on July 27 2015 along with surface plots of ceilings and visibility (Click to enlarge)

Regions of dense fog developed over the Midwest during the morning of July 27 2015, and the GOES-R IFR Probability fields are shown above for 1000 through 1215 UTC. There is a good spatial relationship to where IFR Probabilities are large(ish) and where IFR conditions are present. This example is a good reminder that GOES-R IFR Probability fields should be interpreted with knowledge of other fields. On this day, an extensive cirrus shield (Click the link to view the Brightness Temperature Difference field at 1000 UTC) prevented GOES-13 from viewing low clouds over much of the midwest; thus, the IFR Probability field was driven mostly by model fields over Illinois and Iowa. This is why the field there is mostly uniform. When satellite data is not used in computing the probabilities (because of cirrus clouds), the magnitude of the IFR Probability is reduced.

Dense Fog over the Midwest US

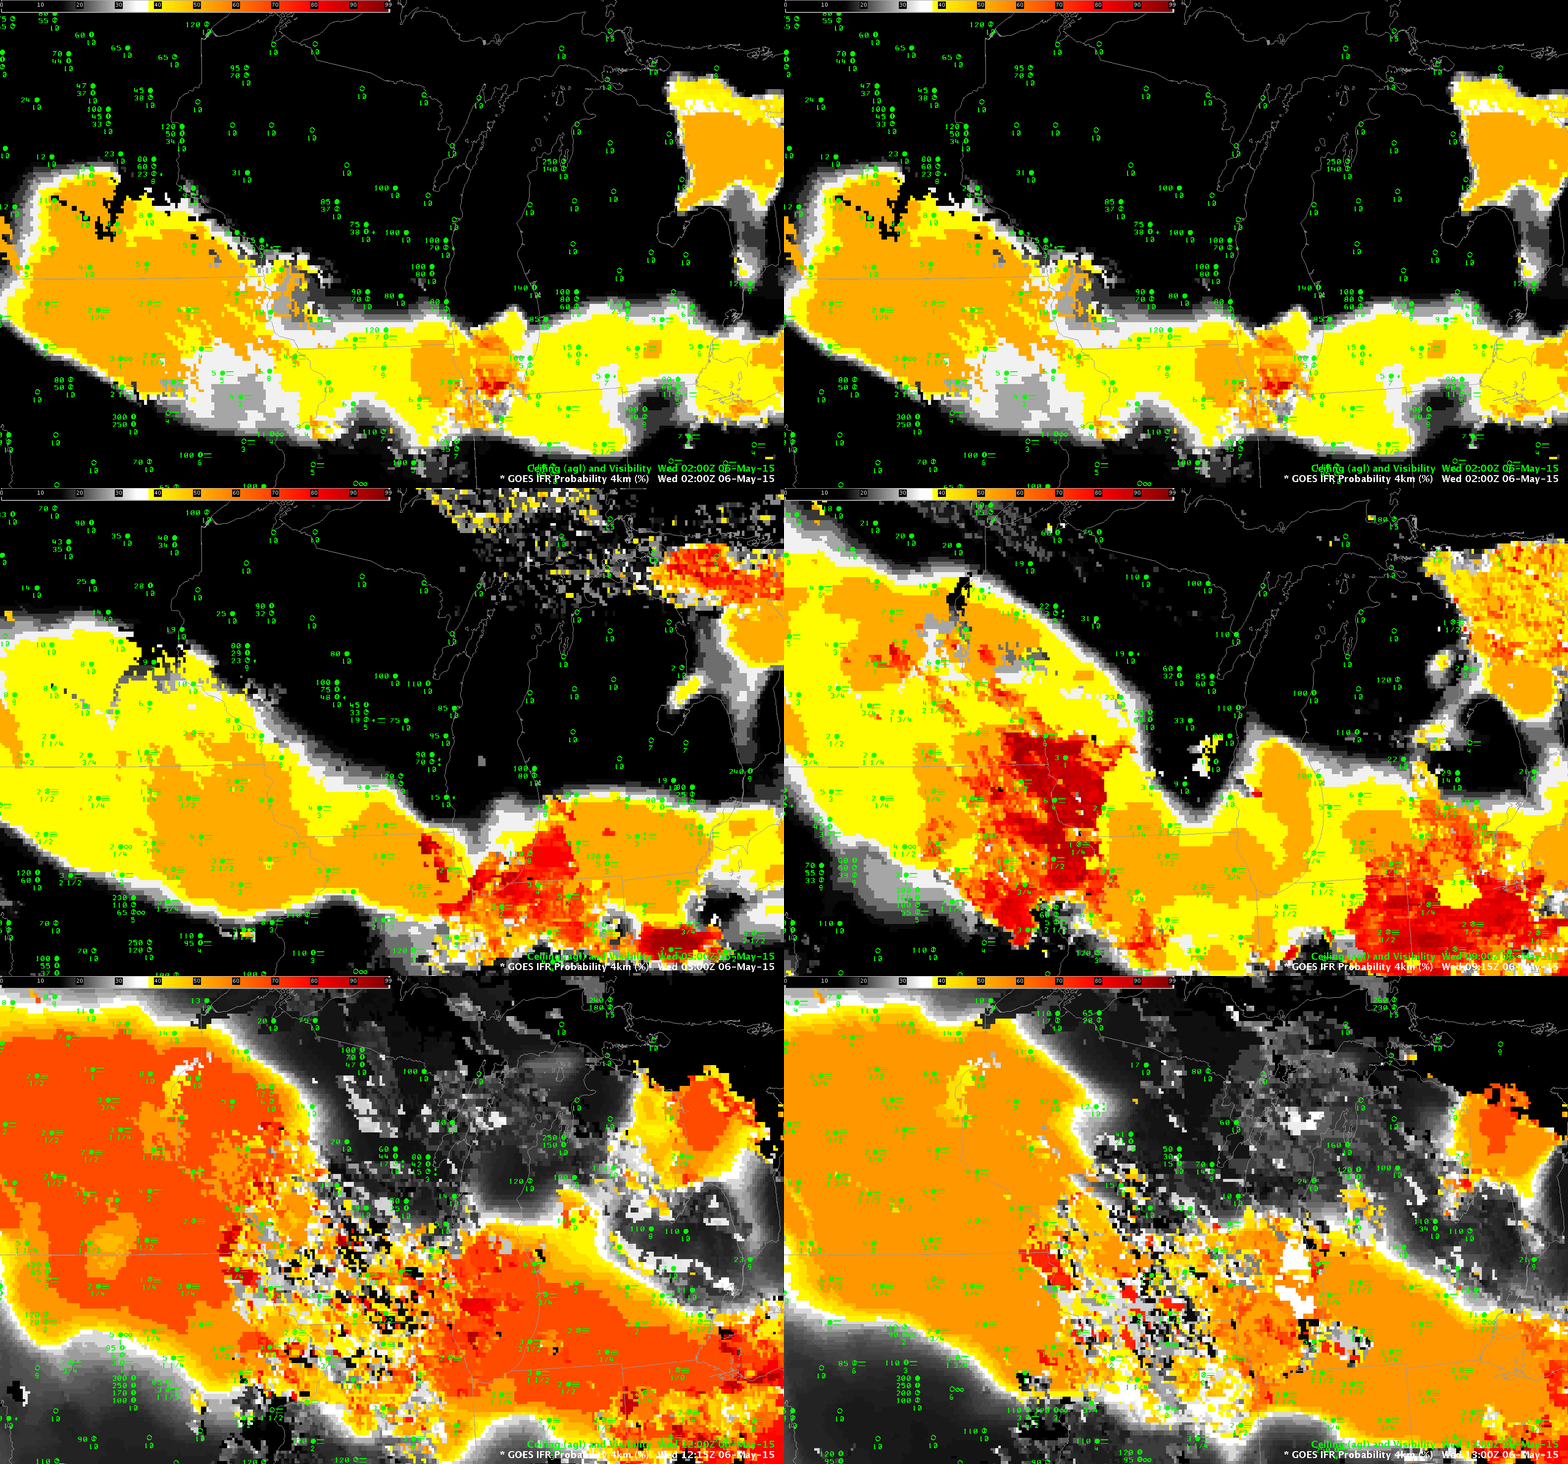
GOESR_IFR_6May2015_0200_1300

Fog and low clouds developed north of a stationary front draped across the midwest early in the morning on May 6th. Dense fog advisories were hoisted from Iowa to northwestern Ohio.

The animation above shows the increase in IFR Probabilities overnight as the dense fog developed.  Note the difference in IFR Probability that arises when satellite data can be used as a predictor (that is, when the developing fog/low stratus is not overlain by higher clouds).  Northwest Ohio until about 1200 UTC is a region where low clouds are viewed.  There, satellite predictors can be used in the computation of IFR Probability fields.  Accordingly, values are larger and there is more small-scale variability (the field looks more pixelated).  In contrast, the field over Iowa for much of the animation is relatively flat.  Here, even through values are comparatively low, interpret them knowing that satellite predictors are not being used because of the presence of middle/higher clouds that preclude the ability of satellite detection of low clouds.

An animation of the traditional brightness temperature difference field, here, from 0500-1000 UTC (after 1100 UTC, increasing reflected solar radiation makes the brightness temperature difference field less useful as a fog/stratus detection device). Compare the regions where IFR Probabilities are largest with the regions of strong Brightness Temperature Difference Signals.

IFR Probability fields above define the region of reduced visibilities very well.  This suggests the Rapid Refresh model and the satellite (where its use was possible) were both in accord with the development of fog/low stratus in this region of the country.

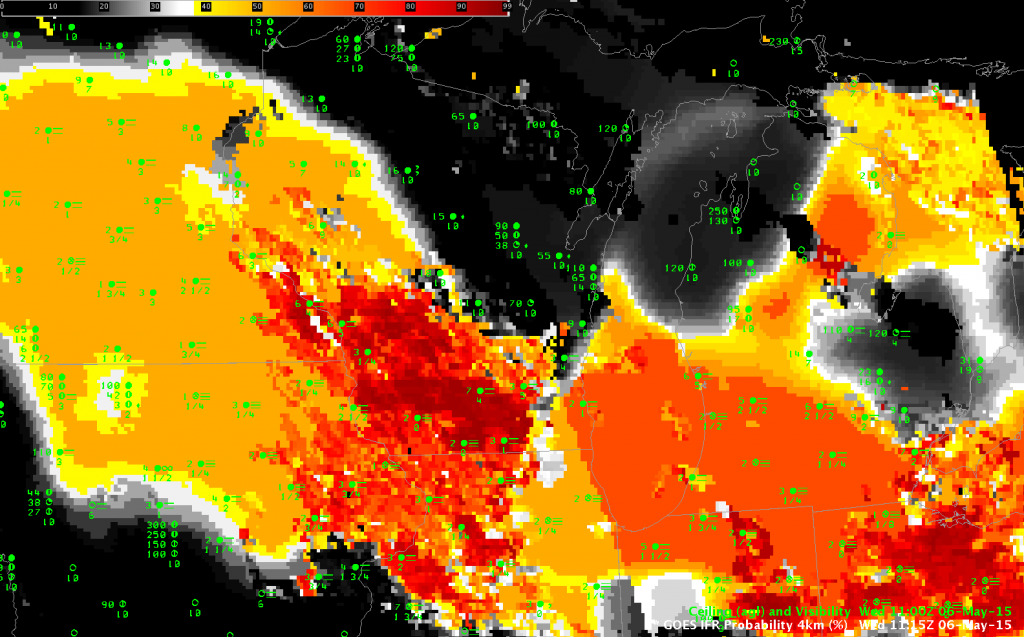
The 1115 UTC image in the animation above, shown below, includes the day/night boundary artifact.  This is the straight line, roughly parallel to the terminator (it will stretch directly north-south on the Equinoxes), that parallels the Lake Michigan shoreline at Chicago.  To the right, daytime predictors are used and IFR Probabilities are somewhat larger (67% vs. 51%) than they are where nighttime predictors are used to the west.

GOESR_IFR_6May2015-50