Category Archives: Midwest

Multiple Cloud Layers/High Clouds over Fog

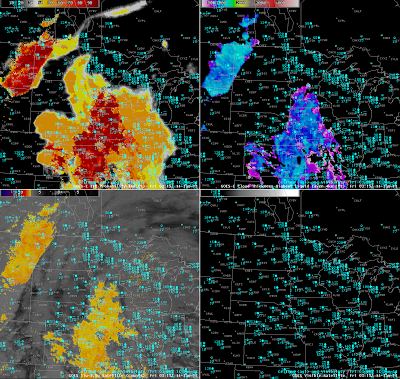
GOES-R IFR Probabilities computed from GOES-East (Upper Left), GOES-East Brightness Temperature Difference (10.7 µm – 3.9 µm) (Upper Right), GOES-R Cloud Thickness of highest liquid water layer (Lower Left), GOES-East Water Vapor (6.7 µm) (Lower Right)

It’s very common in late Winter and early Spring to have a cirrus shield over a region of dense advection fog.  The water vapor imagery, above, shows the cirrus associated with a developing warm conveyor belt over the central part of the USA.  Note how the cirrus signal also shows up in the brightness temperature difference field, and the emissivity properties of ice clouds differ strongly from those of water-based clouds (that in the enhancement in the upper right are orange versus black for ice clouds).  The presence of cirrus also precludes computation of GOES-R cloud thickness, as shown in the lower left imagery.

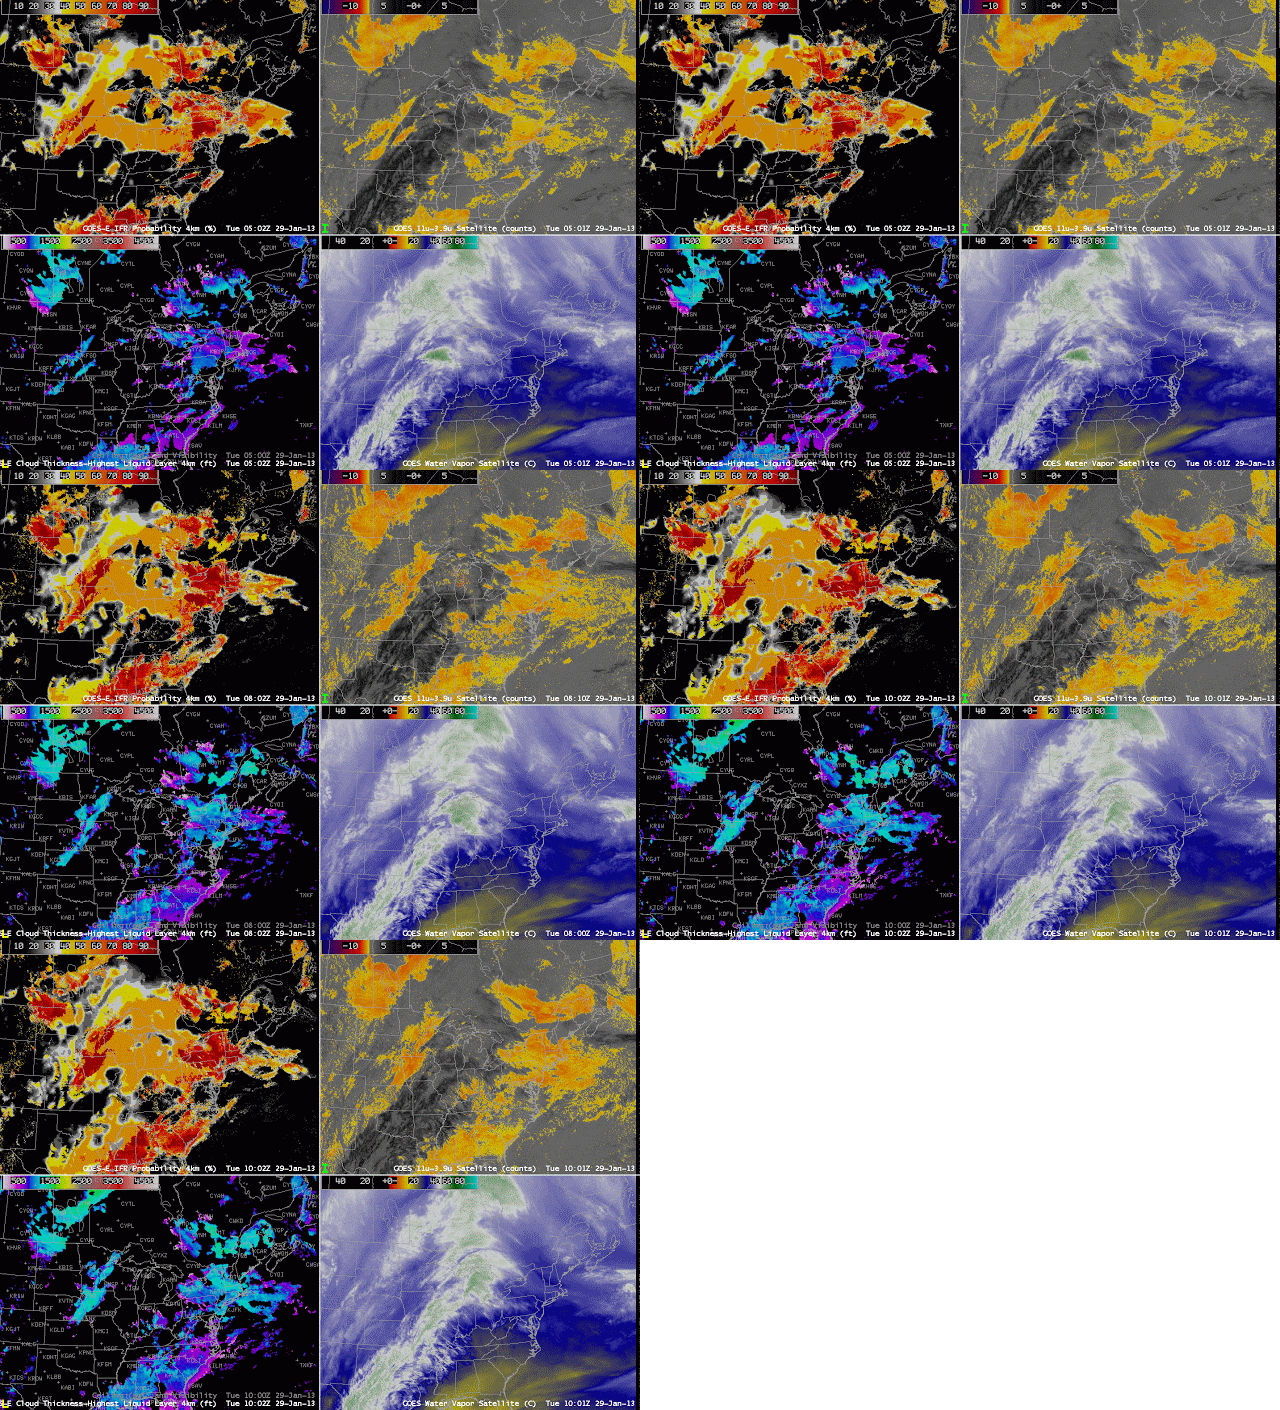
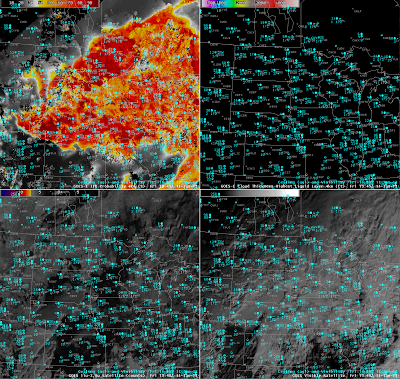
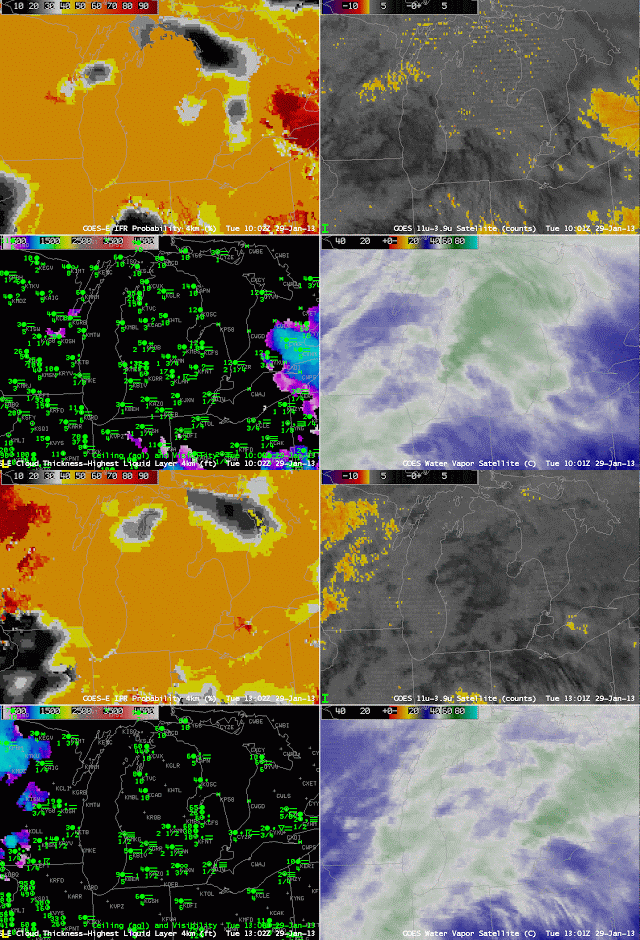
GOES-R IFR probabilities allow for the identification of regions of low clouds/fog even underneath the high clouds.  Note over Michigan the relatively high probabilities.  The probabilities are generated using only model-based predictors (because the satellite algorithm sees only the high clouds so satellite predictors are very small or missing).   The 1000 and 1300 UTC imagery, below, shows widespread IFR conditions underneath cirrus over Michigan and surrounding states.  IFR conditions are generally present in regions where the IFR probabilities are high.  Ceilings/visibilities do not meet IFR criteria over Western Illinois where IFR Probabilities are much lower.

As above, but centered over Michigan

Dense Fog Event Over the Upper Midwest U.S.

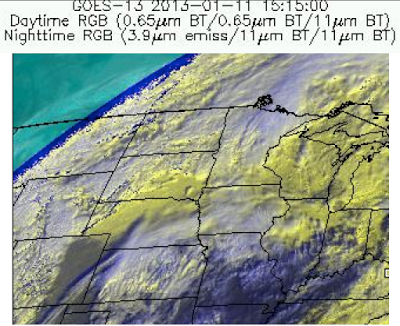
False color image of  a winter storm system moving across the upper Midwest U.S. on 11 January 2013.

A strong winter storm system moved over the upper Midwest on 11 January 2013 bringing heavy snow to the Dakotas. Rain and warm air moved in over the mostly snow covered areas of eastern Nebraska, Minnesota, Iowa, Wisconsin and northern Illinois resulting in a large area of locally dense fog. GOES-R IFR probabilities were used to monitor the large-scale event as it moved over the Upper Midwest U.S.

Due to a large amount of overlaying clouds a satellite only product such as the traditionally-used 11-3.9 micron Brightness Temperature Difference (BTD) only sees the top cloud layer and therefore can not detect fog/low stratus (FLS) beneath. The GOES-R IFR probabilities, however, combine both satellite and mesoscale NWP model data to create a blended product that can estimate the probability that IFR conditions are present even where overlaying clouds obscure all or part of the scene. This animation of the weather system shows that the traditional 11-3.9 micron BTD product only detects a small portion of the fog event, confirmed by the surface observations of ceiling and visibility. The GOES-R FLS product provides relatively high probabilities (>50%) that IFR conditions are present over the entire extent of the fog event with significantly high probabilities (>90%) when satellite data is useful.

GOES-R IFR probabilities (Upper Left), GOES-R Cloud Thickness (Upper Right), GOES-East Brightness Temperature Difference (10.7µm – 3.9µm) (Lower Left) and GOES-East Visible Satellite Imagery (Lower Right) on 11 January 2013. Surface observations of ceiling (100’s of ft) and visibility (miles) are shown in blue.

In the scene above the large change in probability seen in the GOES-R IFR product is a direct result of where the overlaying clouds obstruct the view of the lower clouds from the satellite. Where the satellite is able to see the low level clouds both satellite and model information are combined to determine the probability that IFR conditions are present. For this scene a strong satellite component and strong model component result in extremely high probabilities (>90%) that provide high confidence that IFR conditions are present over parts of the region. In areas where the overlaying clouds obstruct the satellite view only model data is used to determine the IFR probabilities. Without a strong satellite component the resulting probabilities are lower, however, they are still relatively high (>50%) and when used in conjunction with surface observations also provide high confidence that IFR conditions are present. The IFR probabilities show the extent of the fog over central Nebraska, southern Wisconsin and Illinois better than the traditional BTD product with very little false detection (high probabilities where surface obs do not indicate IFR conditions). Looking over the Dakotas and Nebraska the GOES-R IFR probabilities closely match the surface observations with relatively high probabilities over all of Nebraska and the eastern Dakotas where IFR conditions are present and very low probabilities in central N. Dakota and western S. Dakota where surface obs indicate VFR conditions.

GOES-R IFR probabilities (Upper Left), GOES-R Cloud Thickness (Upper Right), GOES-East Brightness Temperature Difference (10.7µm – 3.9µm) (Lower Left) and GOES-East Visible Satellite Imagery (Lower Right) on 11 January 2013. Surface observations of ceiling (100’s of ft) and visibility (miles) are shown in blue.

The traditional BTD product is mostly a nighttime only product as solar contamination in the 3.9 micron channel during the day makes it much more difficult to use. As daylight approaches the scene from 11 January 2013 the traditional BTD product appears to drop out. The GOES-R IFR product has no such issues and works smoothly through the night-to-day transition with consistently high probabilities accurately showing the full extent of the area of fog that continued through the rest of the afternoon.

IFR Conditions during a Weak weather event

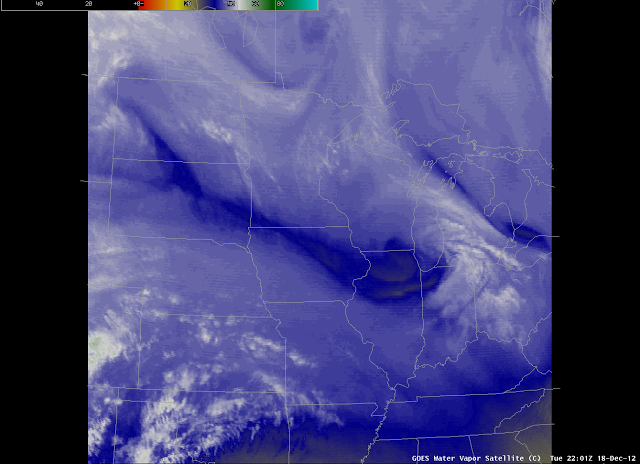
GOES-East Water Vapor Imagery (6.7 ) from 2202 UTC on 18 December 2012

A weak weather system moved through the upper Midwest on December 18th, laying down a light strip of snow over Iowa and southern Wisconsin.  The Water Vapor imagery, above, shows the small scale vorticity center that helped to force the precipitation band moving over southern Lake Michigan after most of the snow in Wisconsin had tapered off.

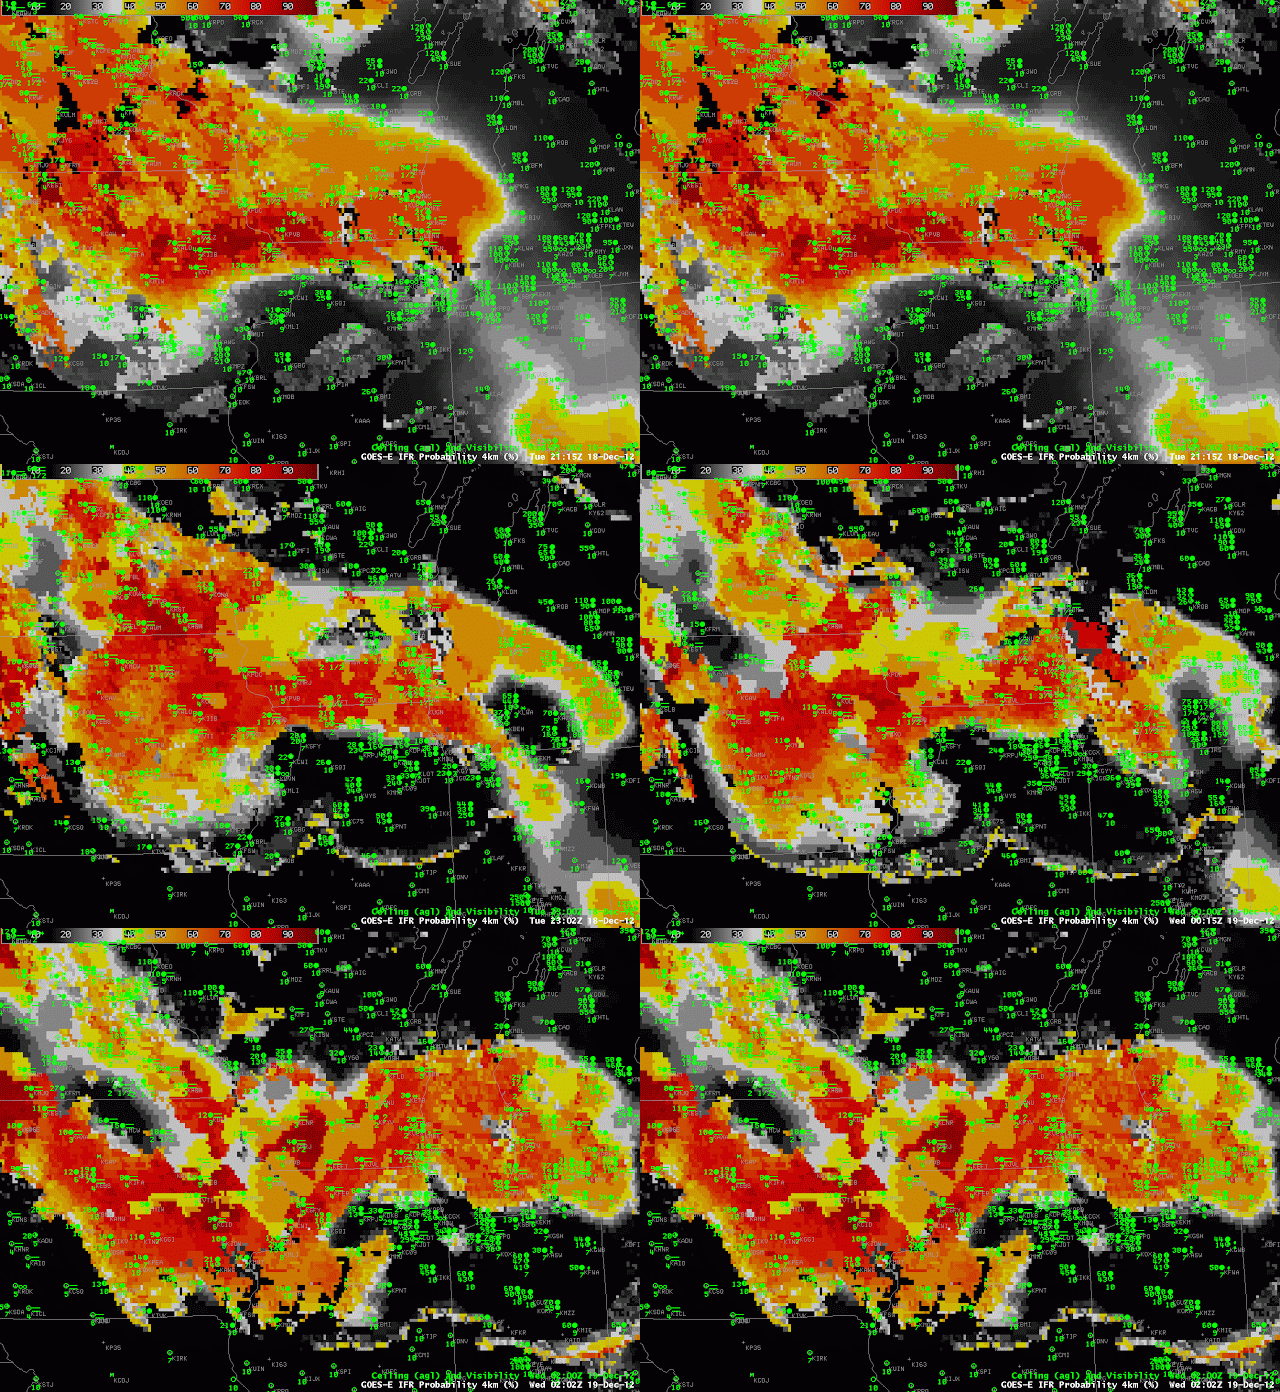
The storm left behind abundant low-level moisture, and Fog/Low Stratus that caused IFR conditions were common.  The animation of the GOES-R IFR Probability product, below, shows high probabilities in the region where light snow and drizzle persisted.  Several aspects of this image require comment.

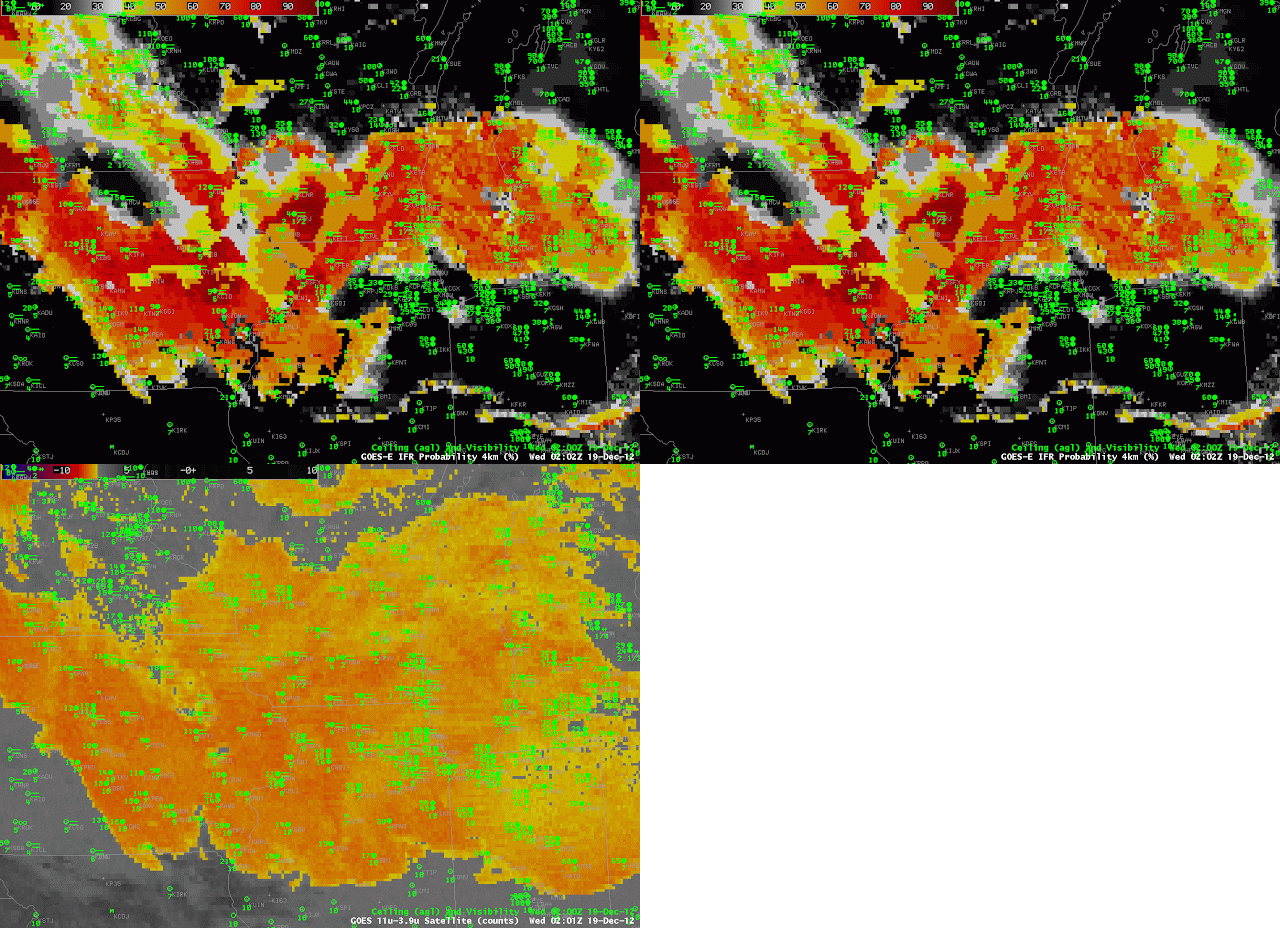
GOES-R IFR probabiltiies computed from GOES-East, and surface observations of ceilings and visibility, hourly from 2100 UTC 18 December to 0200 UTC 19 December.

The image at 2200 UTC shows the boundary between day-time predictor use and night-time predictor use.  This boundary runs southeast to northwest over Iowa.  IFR probabilities are somewhat lower where the night-time predictors are used initially, but patches of higher IFR probability do occur.  The IFR Probability product does distinguish well between the fog and low stratus that does restrict visibility and the elevated stratus over Illinois that is obvious in the traditional brightness temperature difference product, below.  Note especially how Chicago’s O’Hare airport is not reporting IFR conditions, nor under a region where GOES-R IFR probabilities are high, but it is in a region where the traditional brightness temperature product has a strong signal.

Toggle between GOES-R IFR Probability field and GOES-East Brightness Temperature Difference Field, 0200 UTC 19 December 2012

Dense Fog at O’Hare

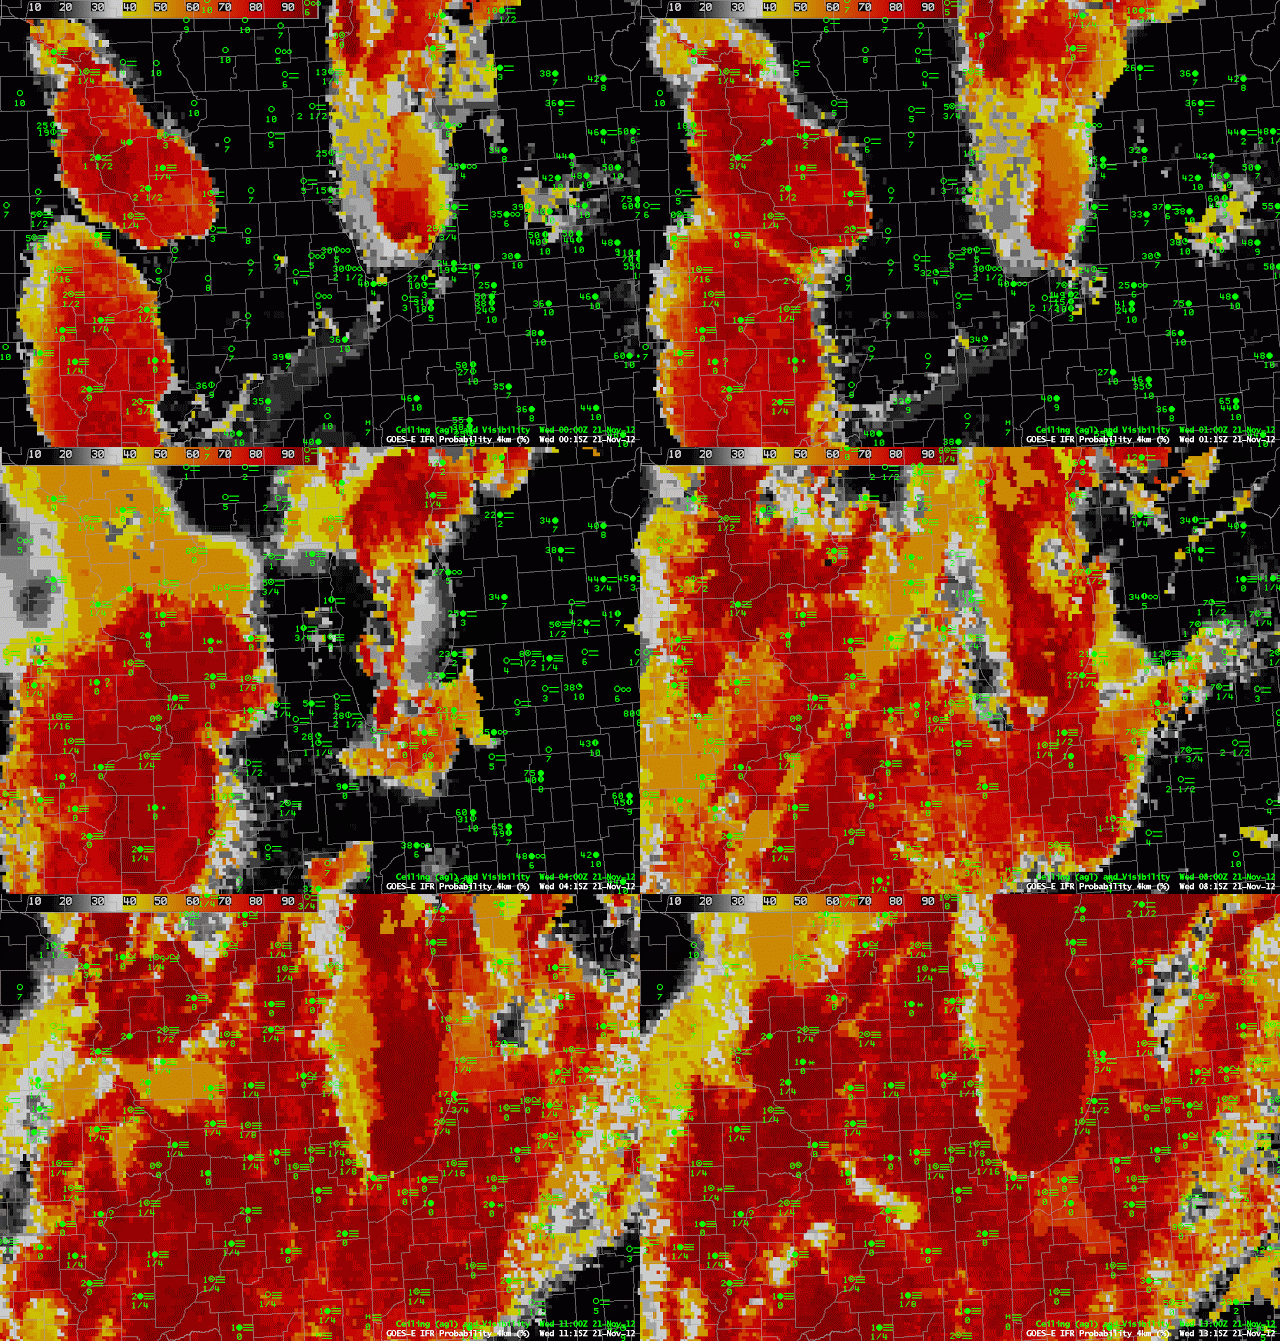
GOES-R IFR Probabilities, computed from GOES-East, and surface observations of ceilings and visibilities, hourly from 00:15 UTC to 13:15 UTC on 21 November 2012
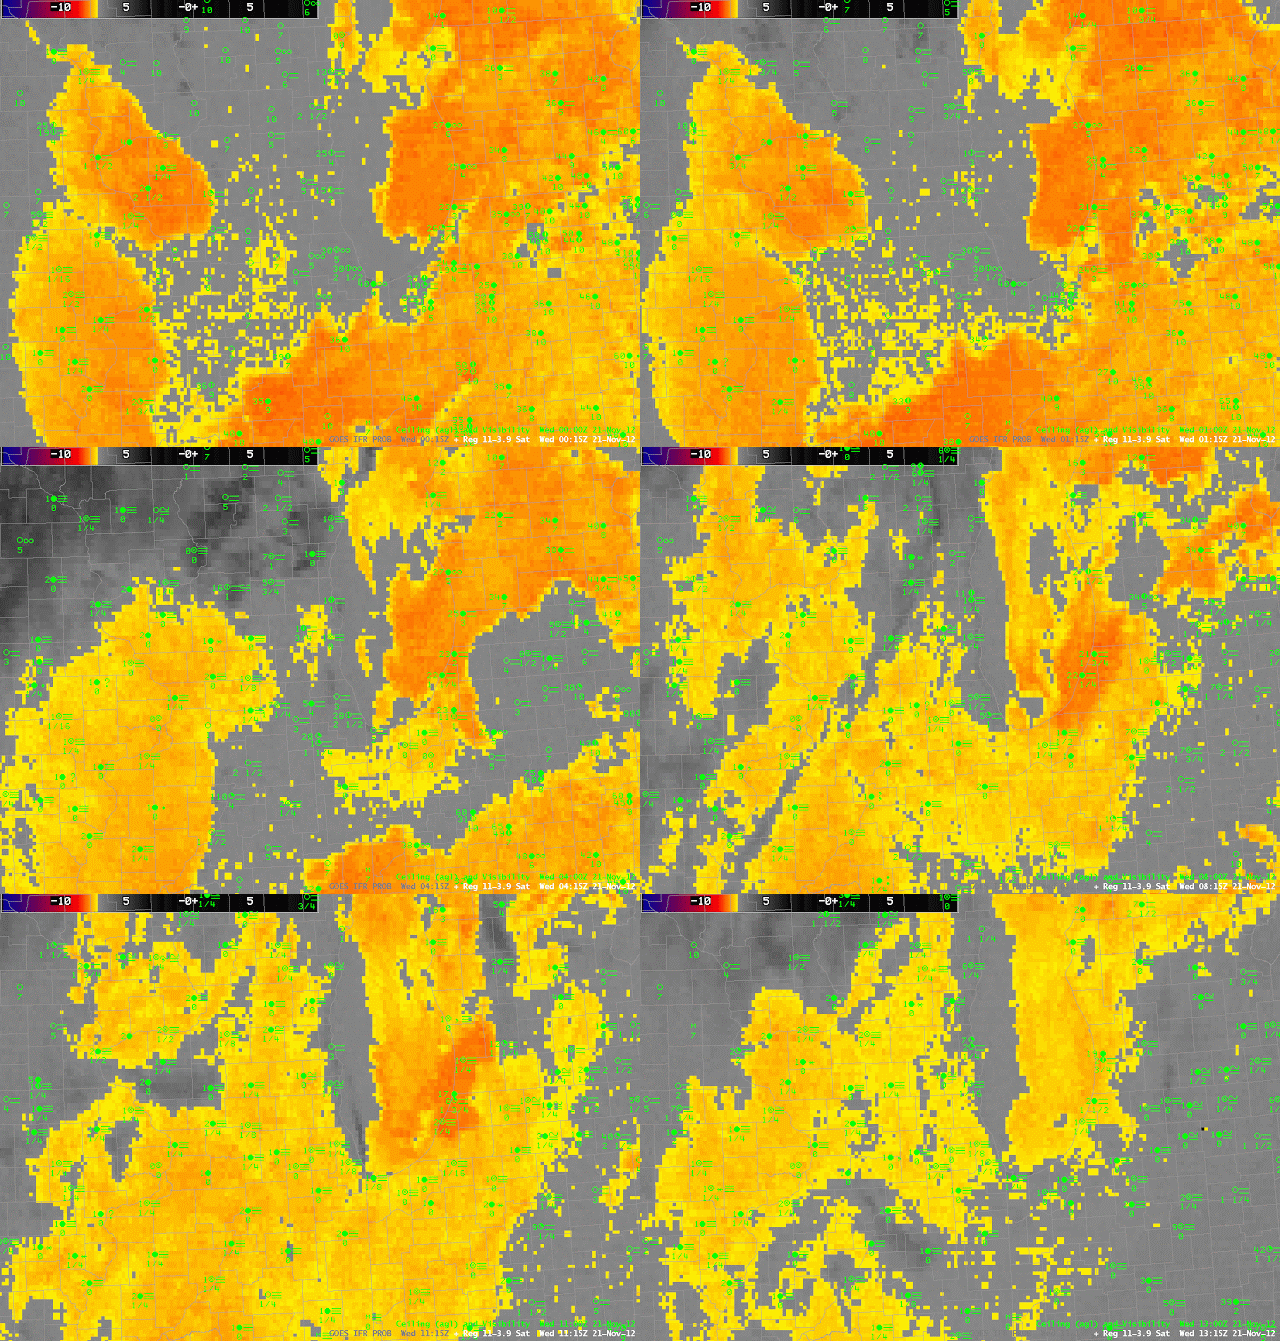
Heritage Fog Detection product, that is, brightness temperature difference 10.7 – 3.9, hourly from 00:15 UTC to 13:15 UTC on 21 November 2012

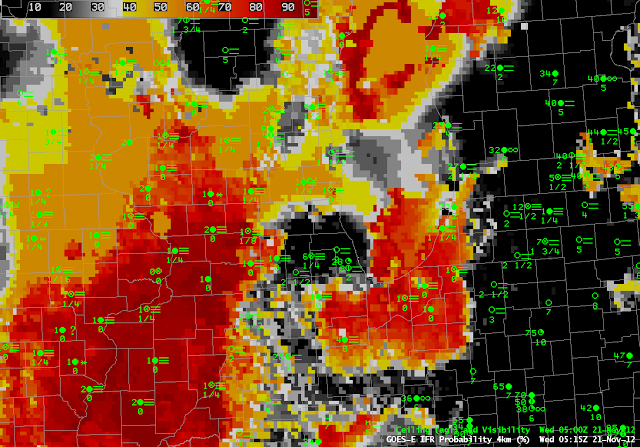
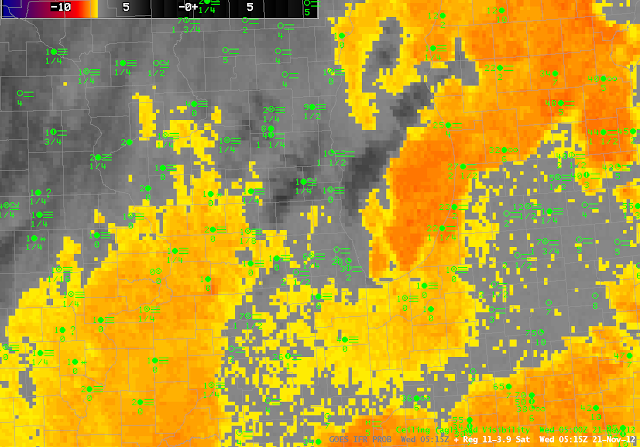
Dense fog has developed over the midwest on one of the busiest travel days of the year.  The GOES-R IFR Probabilities, top loop, above, show the fog initially over the Mississippi River Valley (this fog had actually formed the night before and persisted through the day — link)  and then spreading eastward towards Chicago’s O’Hare Airport.  The animation of GOES-R IFR probabilities and surface observations depicts the widespread nature of the fog.  Compare the fields above to the fields of the brightness temperature difference, the Heritage Fog Detection product, just above.  Several notable differences are obvious.  Note, for example, that at the start of the loop, much of Michigan is covered by a strong brightness temperature difference signal, but IFR conditions are not common.  The GOES-R IFR Probabilities correctly shows low probabilities of reduced visibilities under the elevated stratus deck over Michigan.  There are several upper cloud features that propagate across Illinois during the course of the night.  These features prevent the Heritage Cloud Product from detecting low clouds.  For example — the region over southern Wisconsin at 0515 UTC.  The IFR probabilities decrease in this region (and acquire the characteristically smooth appearance that arises when model predictors predominate in the computation of probabilities), and rebound once the higher clouds move off to the south and east.  The 0515 UTC images for both products are below. 

GOES-R IFR Probabilities from 0515 UTC on 21 November
Heritage Fog Detection from 0515 UTC on 21 November

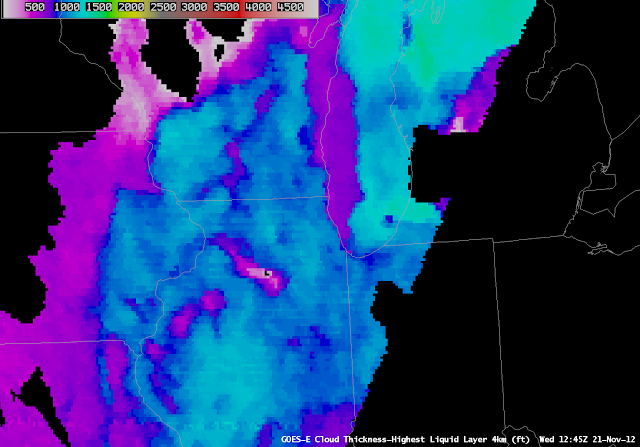
The Wednesday before Thanksgiving is a very busy travel day through O’Hare, the timing of the fog dissipation is therefore of utmost importance.  The depth of the fog/low stratus at that time just before twilight conditions (when the product is not computed) can be related to dissipation time, as shown in this graph.  The last cloud thickness estimate just before sunrise, below, was around 1000 feet over O’Hare, suggesting that the Fog will burn off about 3 hours after sunrise (13:00Z).

GOES-R Cloud Thickness from 1245 UTC on 21 November

The images below show the fog clearing across the area. Note how the areas where the last cloud thickness estimate before sunrise was thicker (Central Illinois and SW Wisconsin where thicknesses were close to 1200 ft) takes longer to clear than areas where the clouds were thinner (E Wisconsin and NE Illinois around O’Hare where thicknesses were around 1000 ft).

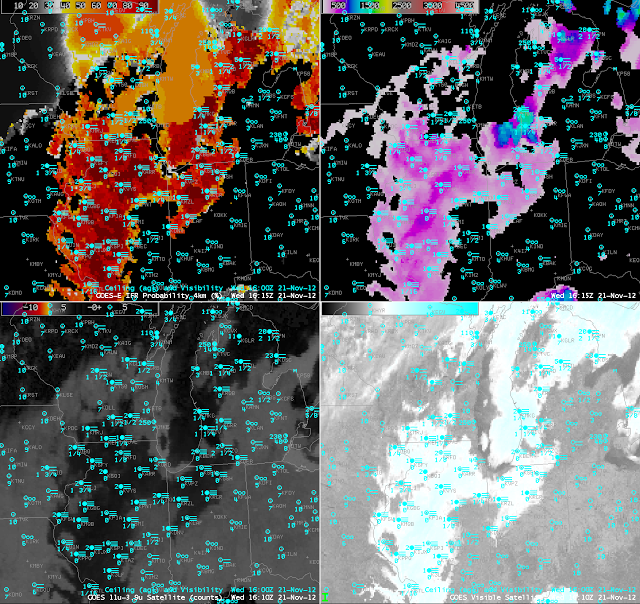
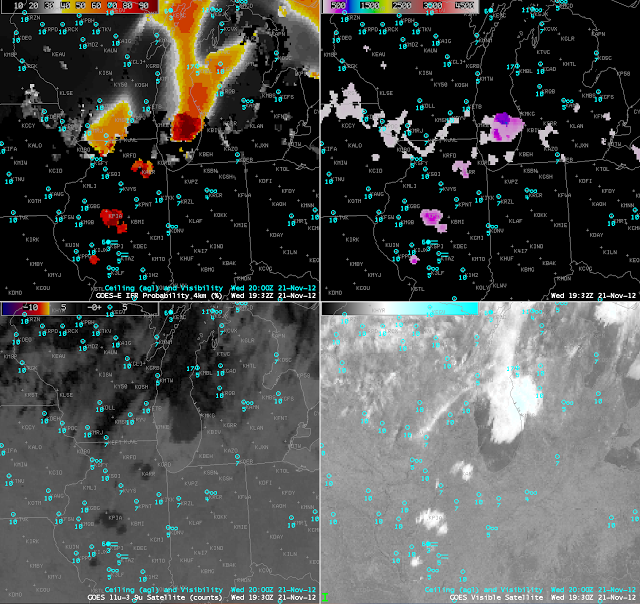
GOES-R IFR probabilities (top left), GOES-R cloud thickness (top right), heritage 3.9-11 micron BTD product (bottom left) and visible satellite image (bottom right) for Nov 21, 2012 at 16:15 UTC. Surface observations of ceiling and visibility are in blue.

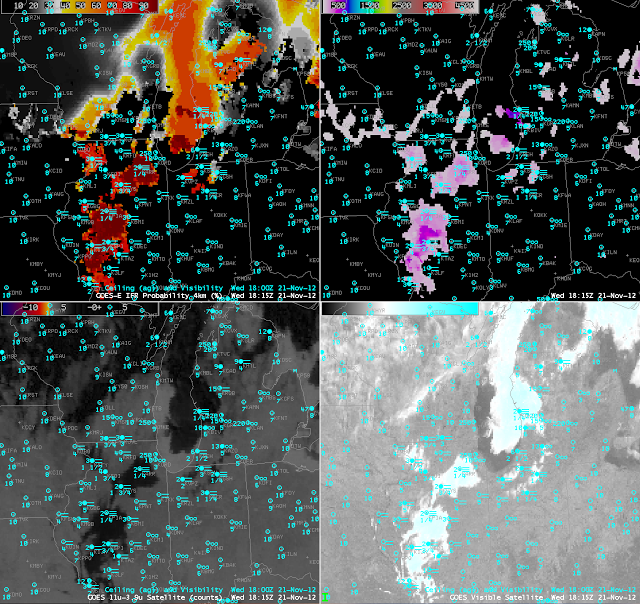
In the above image at 16:15 UTC (about 3hrs after sunrise) the fog has cleared near O’Hare, in SE Wisconsin and other areas where pre-sunrise cloud thicknesses were ~1000 ft. In the image below at 18:15 UTC (about 5 hours after sunrise) the fog has cleared everywhere except central Illinois where the largest pre-sunrise thicknesses were estimated.

GOES-R IFR probabilities (top left), GOES-R cloud thickness (top right), heritage 3.9-11 micron BTD product (bottom left) and visible satellite image (bottom right) for Nov 21, 2012 at 18:15 UTC. Surface observations of ceiling and visibility are in blue.
As seen below, by 19:32 UTC (about 6.5 hrs after sunrise) the last small pockets of fog finish burning off. It was noted by a NWS forecaster in Sullivan, WI that a strong low-level inversion was present that took longer to erode than usual. This likely resulted in some of these lingering areas of fog to persist a little longer than was estimated using the last pre-sunrise GOES-R cloud thickness relationship. The complete animation is available here.

GOES-R IFR probabilities (top left), GOES-R cloud thickness (top right), heritage 3.9-11 micron BTD product (bottom left) and visible satellite image (bottom right) for Nov 21, 2012 at 19:32 UTC. Surface observations of ceiling and visibility are in blue.

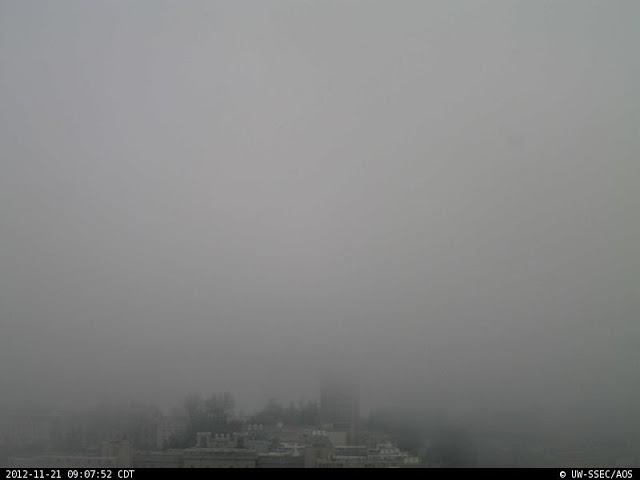
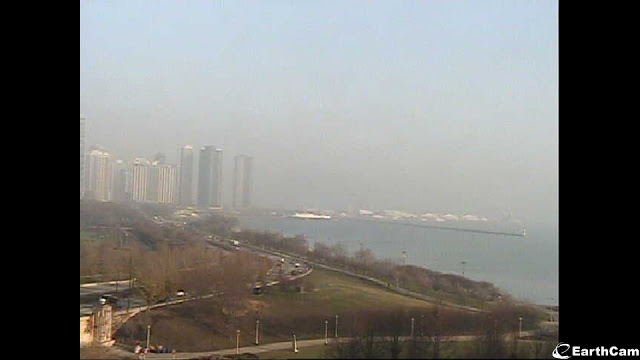
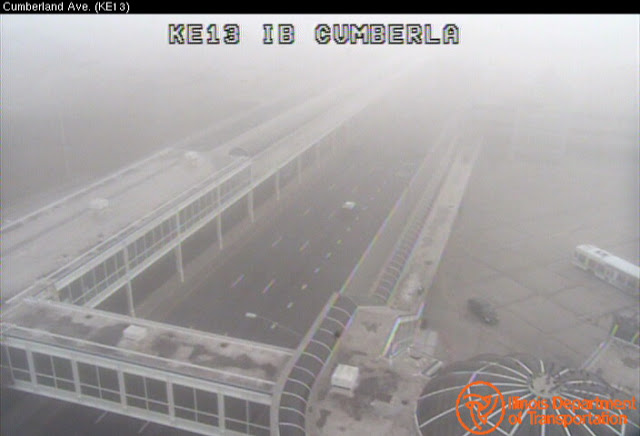
Fog was considerably less dense at the Lakefront in Chicago.  Various web-cam captures, below, demonstrate the variable denseness of the fog in Chicago, and also in Madison, WI.

North-Facing Webcam, Madison WI, time as indicated.  Source.

North-Facing Webcam from Field Museum in Chicago, ca. 1445 UTC 21 November.  Source.

Kennedy Expressway at Cumberland Ave, ca. 1445 UTC 21 November 2012.  Source.

Dense Fog over the Upper Midwest

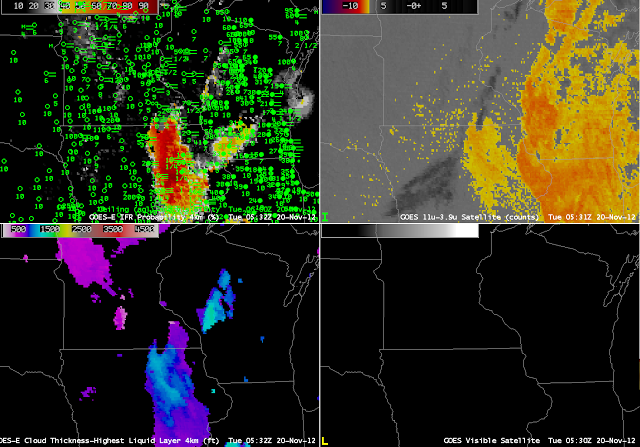
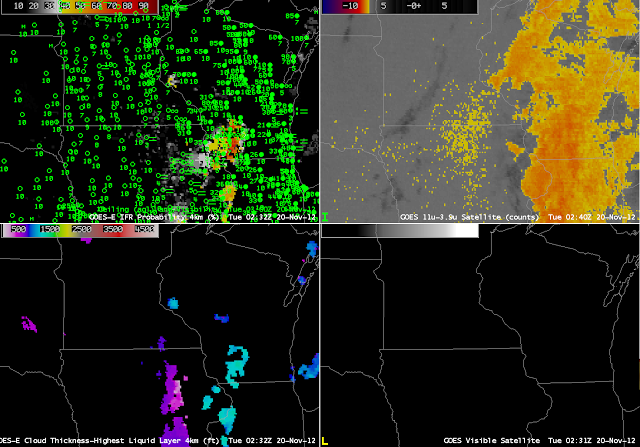
GOES-R IFR Probabilities computed from GOES-East (upper left), GOES-East Traditional Brightness temperature difference, 10.7 µm  – 3.9 µm (upper right), GOES-R Cloud Thickness (lower left), GOES-East Visible (0.63 µm ) imagery (lower right), from approximately 0230 UTC 20 Nov 2012.

Dense fog developed over portions of the upper Mississippi Valley early in the morning on 20 November 2012.  This event forced delayed openings for many eastern Iowa schools.  How well did the GOES-R Fused Data products do for this event?  The animation above shows the quick development of high IFR probabilities over Iowa;  development over northwest Wisconsin, where IFR conditions were observed, was delayed.  Why?  The imagery above, from 0230 UTC, shows IFR probabilities increasing over eastern Iowa where near IFR conditions are already developing.  At 0330 UTC, below, ceilings and visibilities continue to lower over eastern Iowa where IFR Probabilities increase.  Note that the traditional brightness temperature difference field shows a strong signal over Wisconsin and Illinois — but IFR conditions there are not widespread, and IFR probabilities are except over southwest Wisconsin.  The 0330 imagery also hints at higher clouds moving in from the west over southwest Minnesota and western Iowa/eastern Nebraska, where the darker regions in the brightness temperature difference product exists.
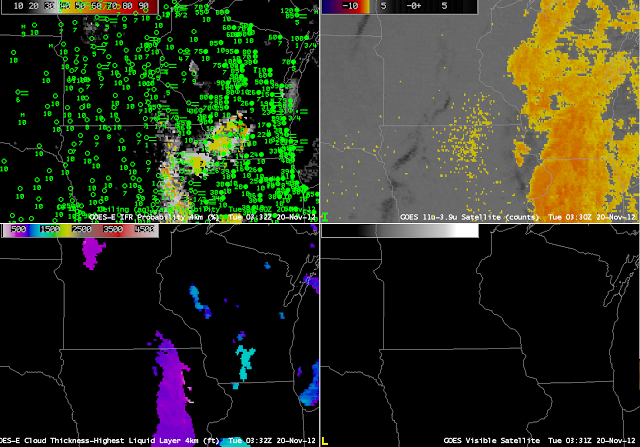
GOES-R IFR Probabilities computed from GOES-East (upper left), GOES-East Traditional Brightness temperature difference, 10.7 µm  – 3.9 µm (upper right), GOES-R Cloud Thickness (lower left), GOES-East Visible (0.63 µm ) imagery (lower right), from approximately 0330 UTC 20 Nov 2012.
GOES-R IFR Probabilities computed from GOES-East (upper left), GOES-East Traditional Brightness temperature difference, 10.7 µm  – 3.9 µm (upper right), GOES-R Cloud Thickness (lower left), GOES-East Visible (0.63 µm ) imagery (lower right), from approximately 0530 UTC 20 Nov 2012.

Two hours later, at 0530 UTC, IFR conditions are widespread over eastern Iowa where the traditional brightness temperature difference product has a signal, and where GOES-East-based GOES-R IFR Probabilities are very high.  The Traditional brightness temperature difference signal from GOES-East continues to have a strong signal over central Wisconsin southward into Illinois where, except for southwest Wisconsin, IFR conditions are not common.  Note the development of IFR conditions in northwest Wisconsin, in a region where IFR probabilities are low.  In this region, satellite detection of low clouds is complicated by higher clouds (indicated by the dark region in the brightness temperature difference product).  In addition, low-level relative humidity fields at this time in the Rapid Refresh model are lower than they are over Iowa (see the animation of fields used to compute IFR probabilities at the bottom of this post).
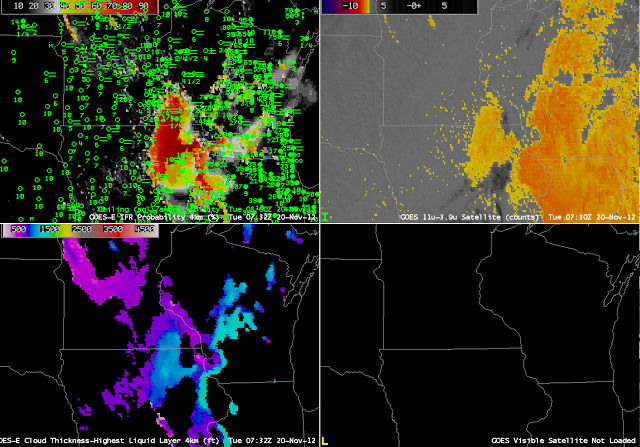
GOES-R IFR Probabilities computed from GOES-East (upper left), GOES-East Traditional Brightness temperature difference, 10.7 µm  – 3.9 µm (upper right), GOES-R Cloud Thickness (lower left), GOES-East Visible (0.63 µm ) imagery (lower right), from approximately 0730 UTC 20 Nov 2012.

At 0730 UTC, above, mid-level clouds over eastern Iowa are having an effect on IFR probabilities there.  Because satellite predictors cannot give a strong indication of fog/low stratus when mid-level (or higher) clouds are present, IFR probabilities will decrease.  This is happening over portions of eastern Iowa where IFR conditions persist.  Probabilities fall, and the field acquires a much smoother look;  in addition, Cloud thickness is not computed.  These occurrences all are a consequence of the presence of higher clouds, as depicted by the darker grey enhancement in the traditional brightness temperature difference field.  Note that IFR probabilities continue to be fairly low over northwest Wisconsin where IFR or near-IFR conditions are present.
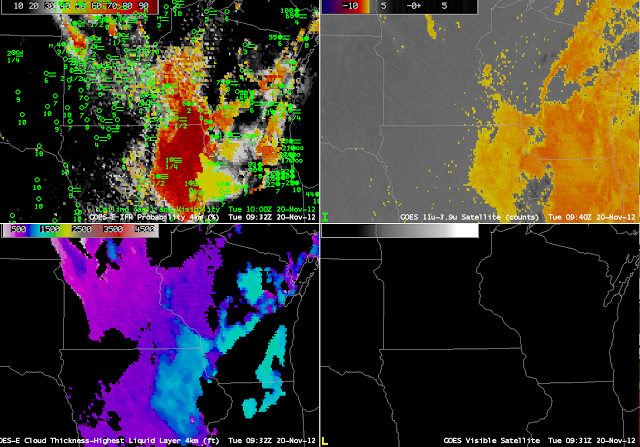
GOES-R IFR Probabilities computed from GOES-East (upper left), GOES-East Traditional Brightness temperature difference, 10.7 µm  – 3.9 µm (upper right), GOES-R Cloud Thickness (lower left), GOES-East Visible (0.63 µm ) imagery (lower right), from approximately 0930 UTC 20 Nov 2012.

By 0930 UTC, IFR probabilities finally do increase over northwest Wisconsin where IFR or near-IFR conditions are present (similarly, they increase over eastern Wisconsin near Lake Michigan).  Both the satellite signal and the Rapid Refresh signal have started to suggest low clouds near the surface, as observed.  An animation of fields important to the computation of IFR probabilities is below.  Note how the near-surface relative humidity saturates first over eastern Iowa;  that saturation is slow to spread northward into northwest Wisconsin.
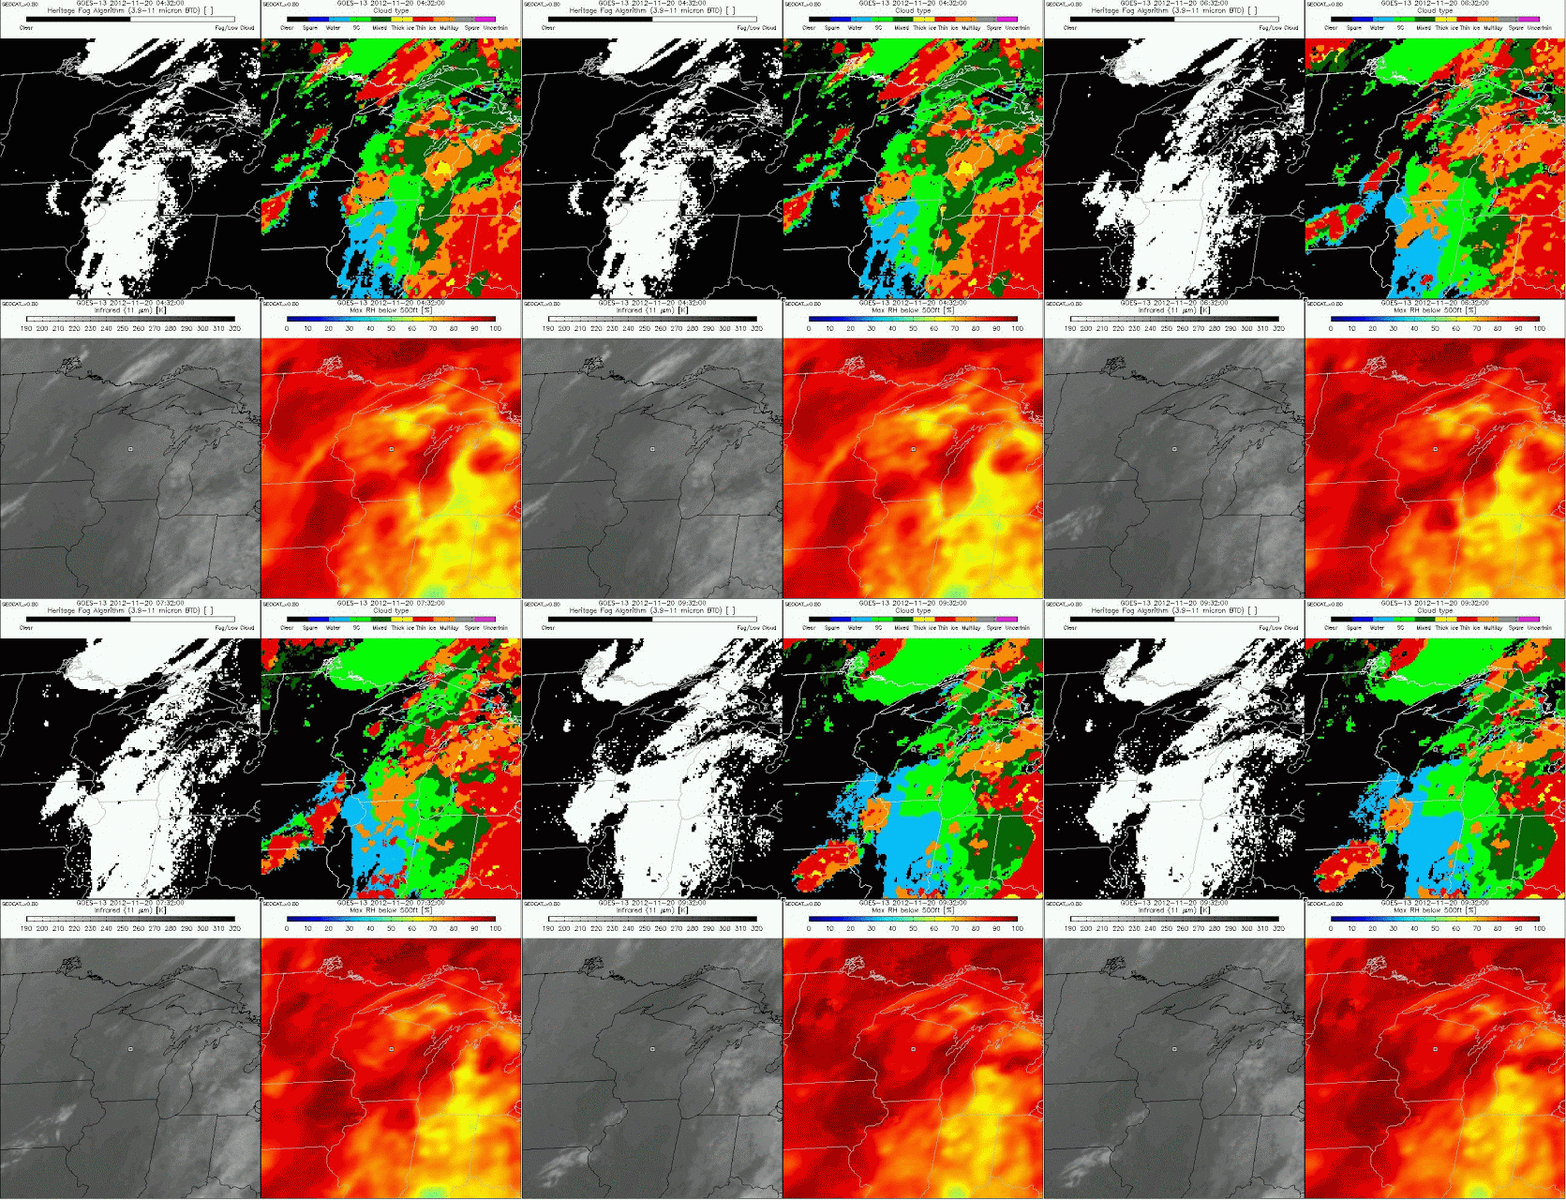
Heritage Fog Algorithm (10.7 µm – 3.9 µm ) from GOES-East (upper left, white = fog/low stratus), GOES-R Cloud Type (upper right), GOES-East 10.7 µm imagery (lower left), Peak Rapid Refresh Model Relative Humidity below 500 m (lower right), hourly from 0432 UTC through 0932 UTC, 20 November 2012.  Data from this site.

The last pre-twilight Cloud Thickness product can be used to guess the dissipation of radiation fog.  Those data are shown below.  Cloud thickness over eastern Iowa and southwest Wisconsin peaks around 1200 feet.  This graph suggests, then, a dissipation time about 5 hours after sunrise.
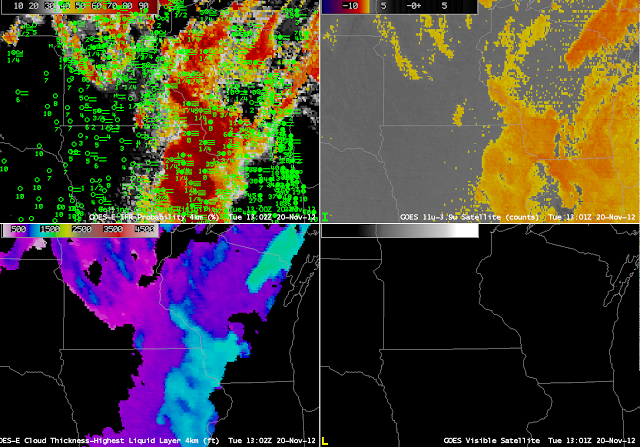
GOES-R IFR Probabilities computed from GOES-East (upper left), GOES-East Traditional Brightness temperature difference, 10.7 µm  – 3.9 µm (upper right), GOES-R Cloud Thickness (lower left), GOES-East Visible (0.63 µm ) imagery (lower right), from approximately 1300 UTC 20 Nov 2012.
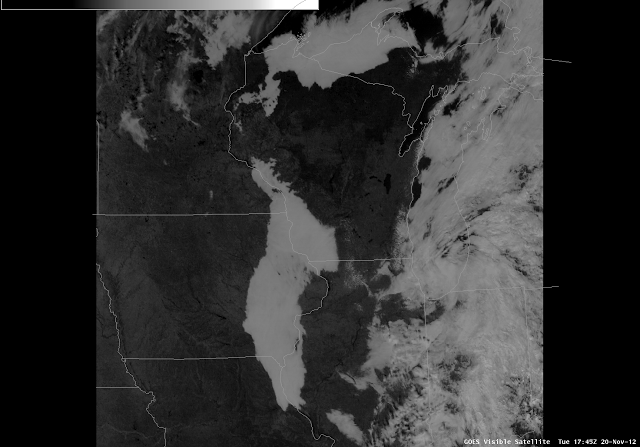
GOES-East Visible Imagery, 1745 UTC

Note how well the low clouds over eastern Iowa at 1745 UTC align with the cloud thickness field at 1300 UTC!
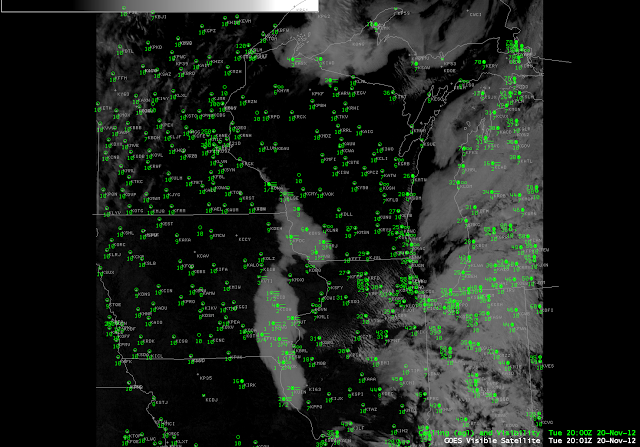
GOES-East visible imagery and station ceilings/visibilities, 2002 UTC

(Update:  The low sun angle of mid- to late-November is making it difficult for the fog to burn off.  As of 2000 UTC, stratus persists)
Fog/Low Stratus over the Upper Midwest U.S.

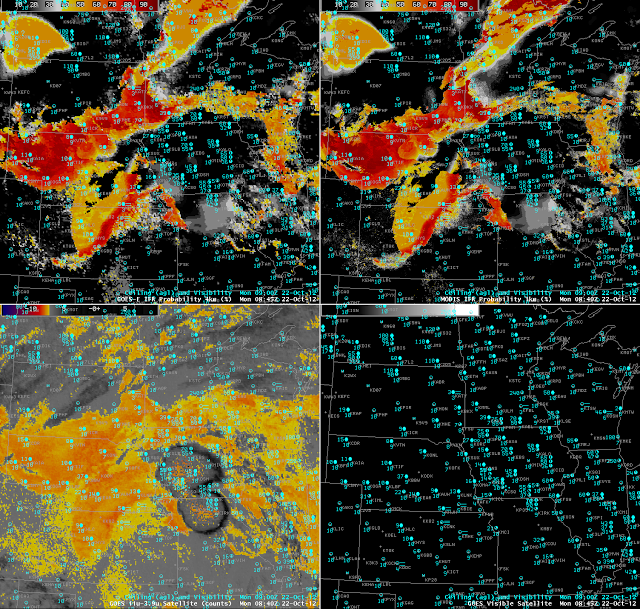
GOES-R IFR probabilities (upper left), GOES-R LIFR probabilities (upper right), GOES-13 brightness temperature difference (3.9-11 µm) (lower left) and visible satellite image (lower right). Surface observations of visibility and cloud ceiling (above ground level) are overlaid on all 4 panels in blue

The GOES-R IFR probabilities are useful when monitoring the formation of fog and/or low stratus (FLS) clouds. In this case over the Upper Midwest U.S. FLS started forming over eastern South Dakota and quickly spread to adjacent states eventually becoming widespread over most of the Upper Midwest. Surface observations of IFR conditions correlate very well to the areas of high IFR probabilities denoted by the dark orange to red colors. In the animation above the GOES-R IFR probabilities track the formation of the FLS with high confidence, evidenced by the relatively high IFR probabilities. The traditionally-used 3.9-11 micron BTD product also detects the FLS, but has difficulty detecting the spatial extent of the hazardous areas of the cloud deck. During the initial formation before 10Z Surface observations over Iowa and S. Minnesota indicate that elevated clouds are present, but they do not meet the IFR criteria for surface visibility (< 3 miles) and/or cloud ceiling (<1000 ft) until after a cluster of showers and thunderstorms passes through. This cluster of showers and storms can be seen in the 3.9-11 micron BTD as the gray and black circular area moving east over Iowa. In these types of situations the satellite only approach does not provide any information on what's going on near the surface because the satellite can only view the top most cloud layer. Using a blended approach merging satellite information with modeled forecast data from the Rapid Refresh model the IFR probabilities can still provide useful information on the presence of hazardous low cloud conditions even when multiple cloud layers are present.
The GOES-R LIFR probabilities can be useful for gaining confidence on whether the FLS is near the surface or if the cloud deck is elevated. Areas of relatively higher IFR and LIFR probabilities usually correlate well to lower surface visibility observations while areas of relatively high IFR probabilities and low LIFR probabilities usually correspond to higher surface visibilities but low cloud ceilings.
When the Sun rises, reflected solar radiation makes using the traditional BTD very difficult. The GOES-R IFR probabilities are available both night and day so users will be able to use the products through sunrise and sunset with confidence. During the day the visible satellite image shows the smooth FLS deck over western Nebraska and what appears to be some cumuliform clouds over eastern Nebraska. Surface observations show IFR conditions are present over most of Nebraska and again correlate very well with high IFR probabilities, even in the presence of the overlaying cumuliform cloud deck.
GOES-R IFR probabilities applied to MODIS (upper left), GOES-R LIFR probabilities applied to MODIS (upper right), MODIS brightness temperature difference (3.9-11 µm) (lower left) and visible satellite image (lower right). Surface observations of visibility and cloud ceiling (above ground level) are overlaid on all 4 panels in blue
The GOES data is available at a high temporal resolution, but only has a spatial resolution of 4km. Applying the GOES-R FLS products to MODIS allows the use of a much high spatial resolution (1km) dataset. The downfall is that since MODIS is on a polar orbiting satellite it is only available a few times per day. However, the higher spatial resolution allows the user to see much more detail than can be obtained using GOES data.

FLS detection over the upper midwest

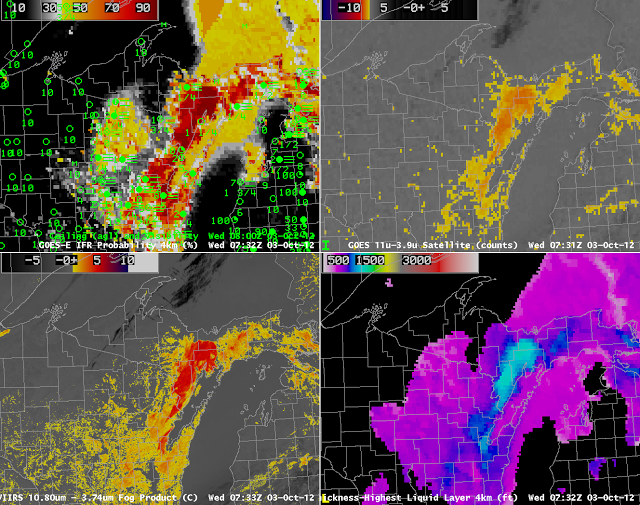
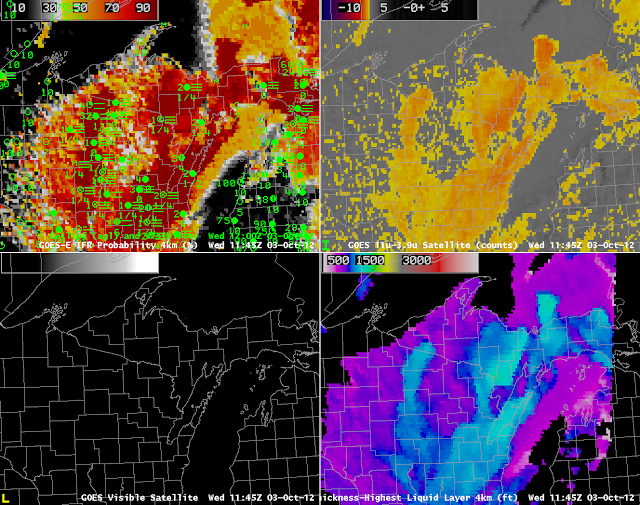
0730 UTC GOES-R IFR Probabilities computed from GOES-14 (Upper left), Traditional Brightness Temperature difference (10.7 µm – 3.9 µm) from GOES-14 (Upper Right), Brightness Temperature Difference (11.35 µm – 3.74 µm) from VIIRS on Suomi/NPP (Lower left),  Thickness of highest Liquid Water Cloud Layer (Lower Right)

Low cloud formation over northern and northeastern Wisconsin early in the morning of October 3rd 2012 demonstrated some strengths of the fused GOES-R Fog/Low Stratus product.  Note that the 0732 UTC GOES-R IFR Probability has a pocket of higher probabilityes over north-central Wisconsin (near Vilas and Oneida Counties) in a region where the traditional brightness temperature difference has a weak signal, and in a region where surface observations indicate fog is present. This region is a good example of how the model RH data can amplify weak satellite signals where fog/low clouds are present but the satellite signal alone may not be strong enough to detect it.

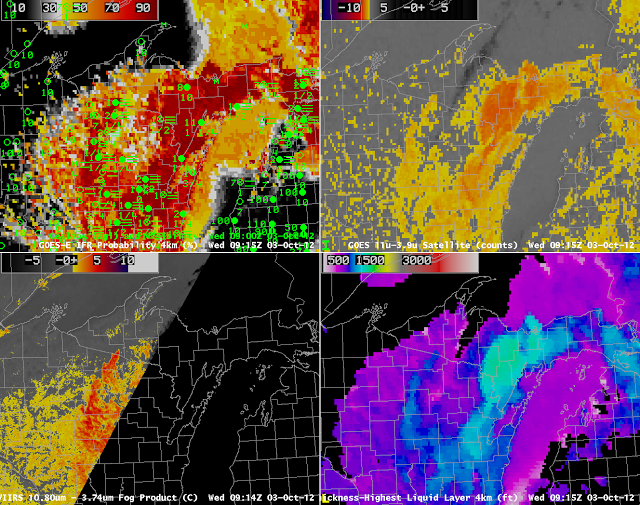
0915 UTC GOES-R IFR Probabilities computed from GOES-14 (Upper left), Traditional Brightness Temperature difference (10.7 µm – 3.9 µm) from GOES-14 (Upper Right), Brightness Temperature Difference (11.35 µm – 3.74 µm) from VIIRS on Suomi/NPP (Lower left),  Thickness Of highest Liquid Water Cloud Layer (Lower Right)

At 0915 UTC, the region of IFR conditions in north-central Wisconsin persists.  At this time, however, the satellite signal also increases showing a signature consistent with low clouds/fog, and therefore GOES-R IFR probabilities significantly increase.  Two things should be clear.  First, the GOES-R IFR probability predicted the presence of Fog/Low Stratus before satellite signal was strong enough to detect it alone (a benefit of using a fused data product) and could be used better to nowcast the evolving boundary layer.  Second,  GOES-R IFR Probabilities when the model signal (in this case, the Rapid Refresh) is strong and the satellite signal is weak are lower than when both model and satellite signals are strong.  This is always the case.

1145 UTC GOES-R IFR Probabilities computed from GOES-14 (Upper left), Traditional Brightness Temperature difference (10.7 µm – 3.9 µm) from GOES-14 (Upper Right), Visible Imagery (0.62 µm) from GOES-14 (Lower left),  Thickness Of highest Liquid Water Cloud Layer (Lower Right)

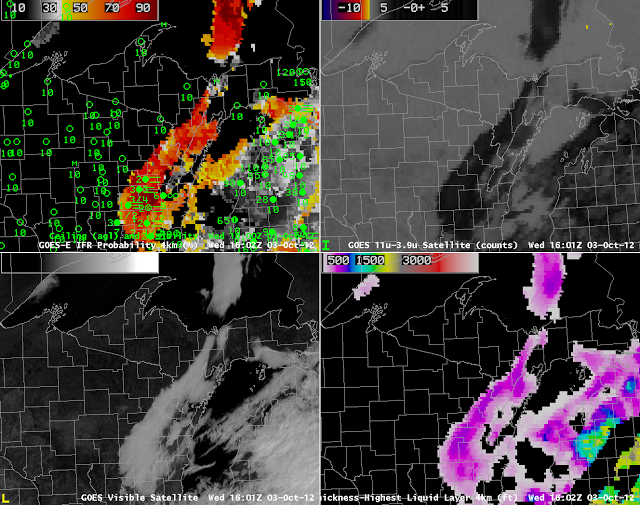
The 1145 UTC shows the last pre-dawn estimate of Cloud Thickness over north-central Wisconsin (the terminator is apparent, running north-south through the Straits of Mackinac).  Estimated cloud thickesses over Vilas and Oneida counties are between 1000 and 1150 feet, vs. 1250 feet over Green Bay and more than 1300 feet over southern Upper Michigan.  Predictably, then, the fog/low stratus over north-central Wisconsin dissipates before the fog/low stratus over northeast Wisconsin and eastern Upper Michigan (see below).

1602 UTC GOES-R IFR Probabilities computed from GOES-14 (Upper left), Traditional Brightness Temperature difference (10.7 µm – 3.9 µm) from GOES-14 (Upper Right), Visible Imagery (0.62 µm) from GOES-14 (Lower left),  Thickness Of highest Liquid Water Cloud Layer (Lower Right)

Emissivity properties in a drought

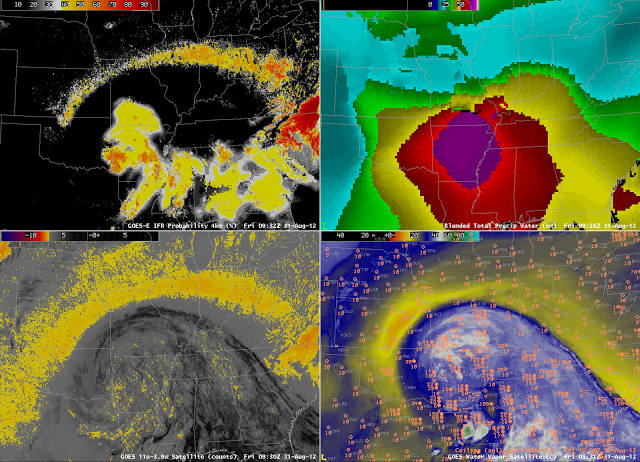
GOES-R IFR Probabilities (upper left), Total Precipitable Water (the so-called ‘Blended Product’) (upper right), 10.7 µm – 3.9 µm Brightness Temperature Difference (lower left), Enhanced Water vapor imagery with surface observations (lower right)

The driving mechanism in the brightness temperature difference product, the heritage method for detecting fog and stratus from satellites, keys on differences in the emissivity of water clouds at 3.9 µm versus the emissivity at 10.7 µm.  Water clouds do not emit 3.9 µm radiation as a blackbody does, but they do emit 10.7 µm radiation almost as a blackbody.

As ground dries out in a drought, its emissivity changes. Those changes are a function of wavelength.  This example is from early morning on 31 August, as the remnants of Isaac slowly spread northward.  The brightness temperature difference shows a strong signal around the cirrus canopy of the storm.  These highlighted regions arcing from Kansas to Illinois have suffered extreme drought all summer.  The satellite signal is so strong in this case over the very dry Earth — because of the changed emissivity properties of the parched Earth — that it cannot be overcome by the model parameters that are used.  As a result, IFR probabilities are high over Indiana and Illinois where no IFR conditions are observed.

When relatively low IFR probabilities are more likely to mean fog

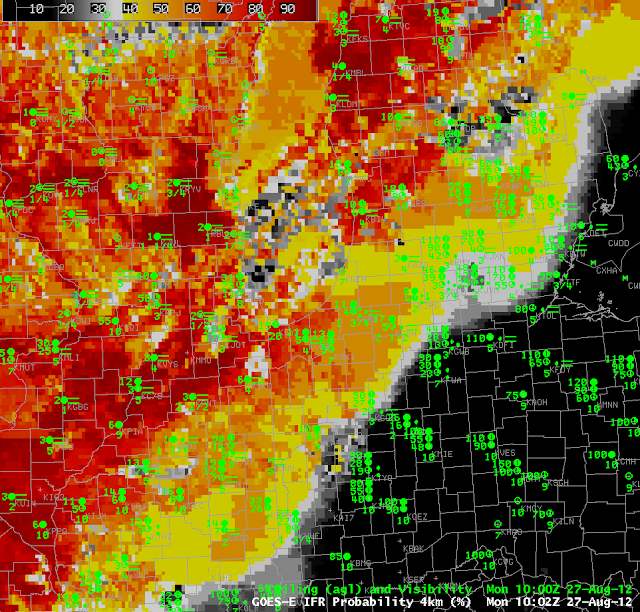
GOES-R IFR Probabilities over the Midwest, 1000 UTC on 27 August 2012

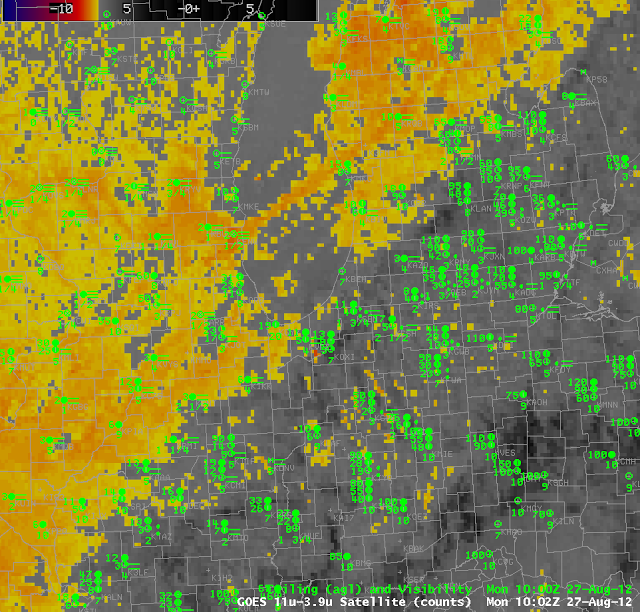
An important consideration when interpreting GOES-R IFR probabilities is the data being used to compute the probabilities.  When both model and satellite data are used, higher probabilities can result, as over south central and southeastern Wisconsin in the image above where probabilities exceed 90% in a region of IFR conditions.  The pixelated nature of the field there suggests that satellite data are being incorporated into the probability field.  When only model data are used, as over southern Lower Michigan in the image above, lower probabilities will result; however, IFR probabilities are nevertheless observed (as in Kalamazoo (KAZO), for example).  The blockier nature of the IFR probability field is showing that only model data are being used in that region.  The traditional brightness temperature field for that time is shown below. 

Traditional Brightness Temperature Difference Field over the lower Great Lakes, 1002 UTC 27 August 2012.

Cloud thickness as a predictor of Fog Dissipation

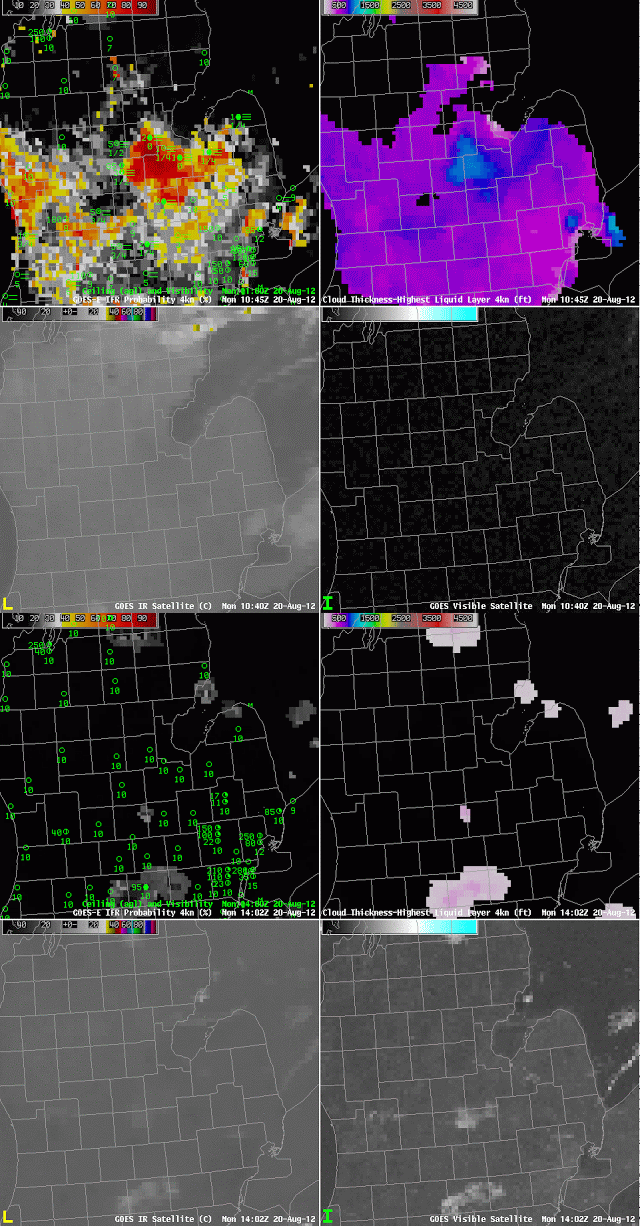
GOES-R IFR Probabilities (Upper Left), GOES-R Cloud Thickness (Upper Right), GOES-East 10.7 µm imagery (Lower Left) and GOES-East 0.63 µm (Visible) imagery (Lower Right)m at 1045 and 1402 UTC

Radiation fog occurred over central Lower Michigan near Saginaw overnight into the morning of the 20th of August, and the thickest fog is indicated at 1045 UTC — just before sunrise — to be just shy of 1000 feet thick.  This fog bank slowly shifted southward, and dissipated shortly after 1400 UTC, one county south of its location at 1045 UTC.  That dissipation time neatly fits in with the graph of fog thickness vs. dissipation time shown here.