Category Archives: Midwest

Northern Indiana Fog Event

VIIRS_DNB__REF_20130829_0748

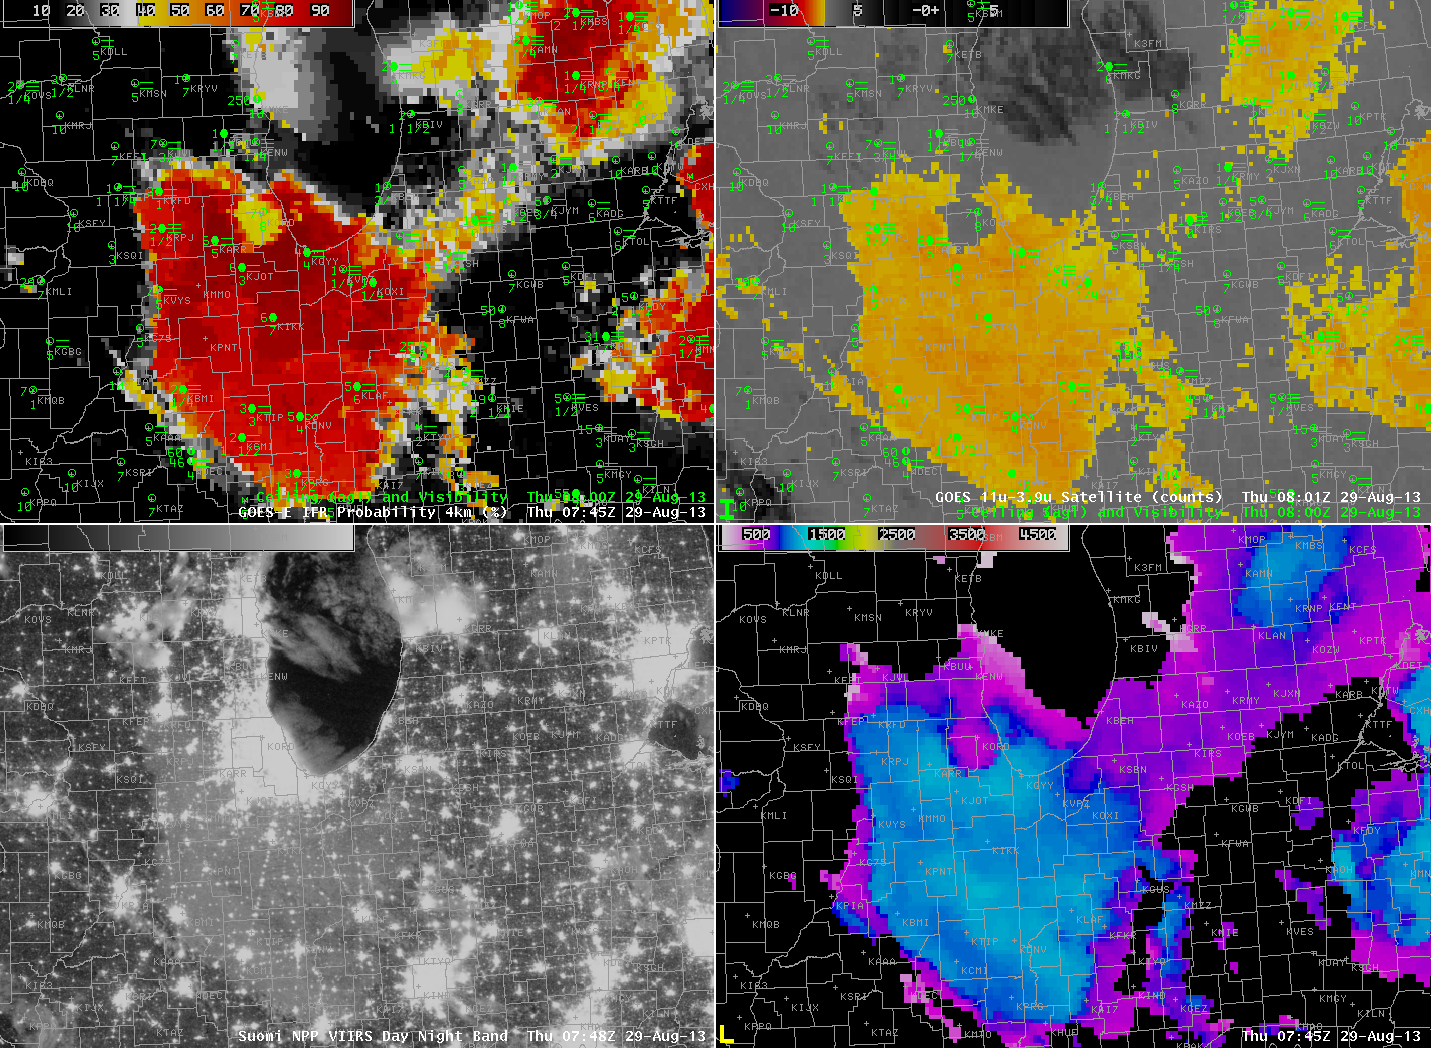
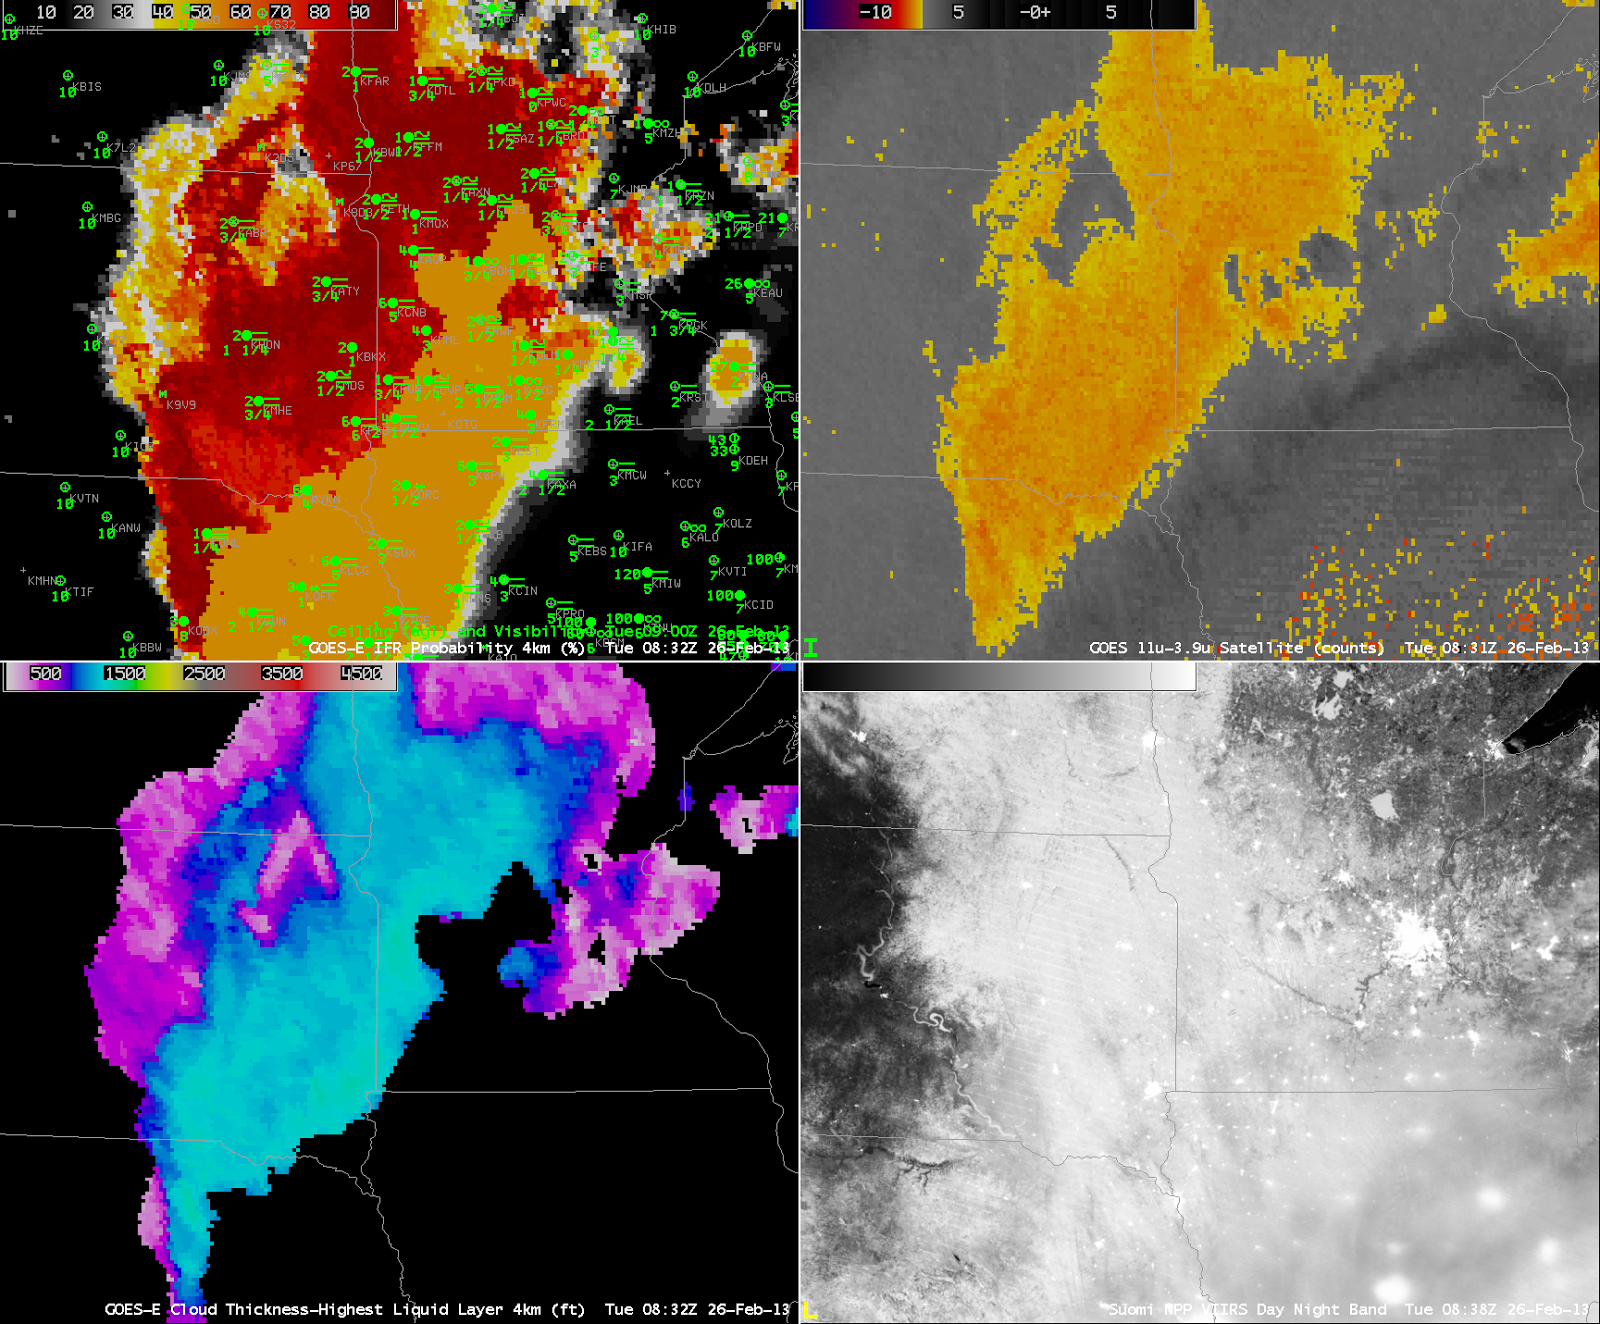
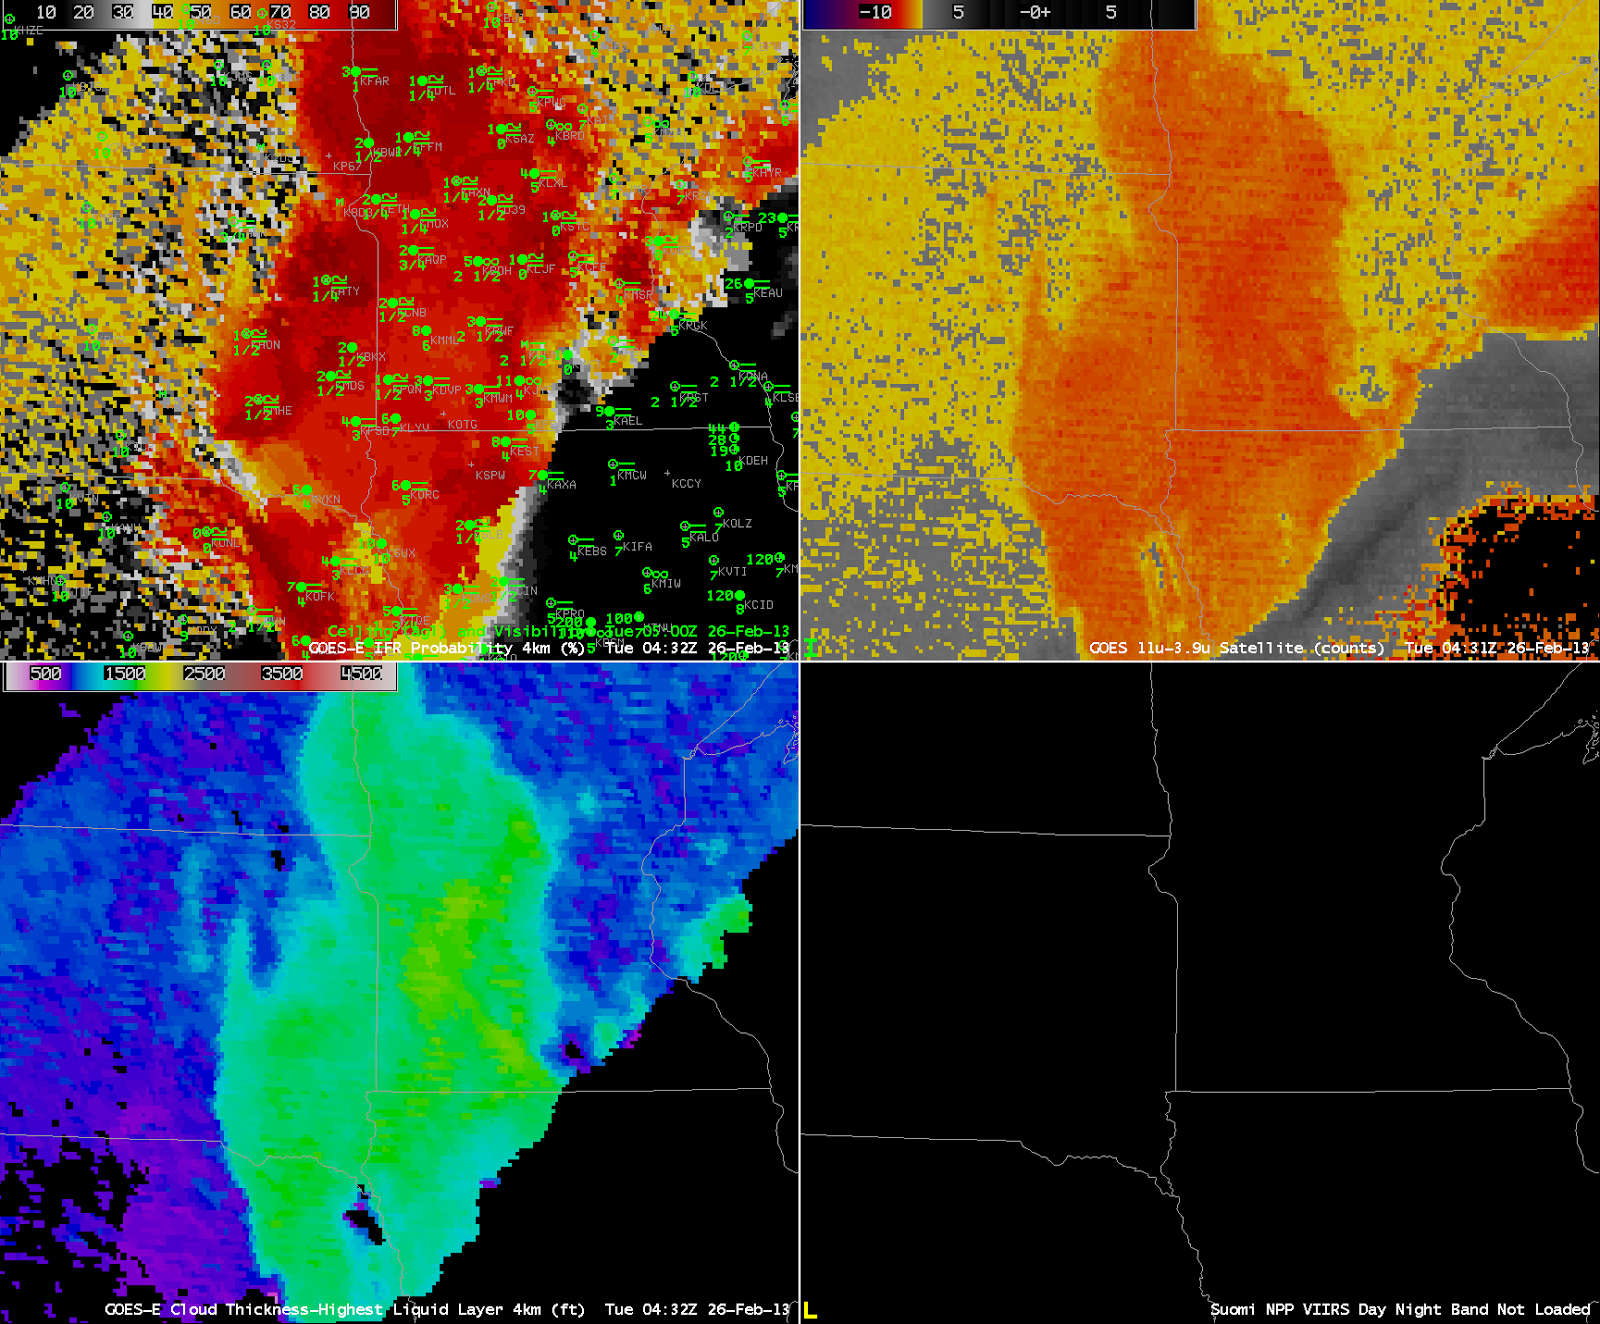
Dense fog developed overnight over NW Indiana and adjacent regions. The GOES-R IFR Probability Product highlighted the regions with the densest fog, refining somewhat the regions highlighted by the brightness temperature difference, the heritage fog-detection product. The image above shows the IFR Probability (Upper Left), Brightness Temperature Difference (Upper Right), Day/Night Imagery from Suomi/NPP (Lower Left) and GOES-R Cloud Thickness (Lower Right). Forecast offices were alert to the possibility of fog, as shown in AFDs from LOT (Chicago) and IWX (Northern Indiana)

000
FXUS63 KIWX 290619
AFDIWX

AREA FORECAST DISCUSSION
NATIONAL WEATHER SERVICE NORTHERN INDIANA
219 AM EDT THU AUG 29 2013

.SYNOPSIS…
ISSUED AT 137 AM EDT THU AUG 29 2013

AN UPPER LEVEL RIDGE WILL CONTINUE ACROSS THE MIDWEST…CAUSING
TEMPERATURES TO STAY MUCH ABOVE NORMAL WITH DRY CONDITIONS. HIGHS
TODAY AND FRIDAY WILL BE IN THE MID 80S TO LOWER 90S. LOWS TONIGHT
WILL BE AROUND 65 DEGREES.

&&

.UPDATE…
ISSUED AT 137 AM EDT THU AUG 29 2013

UPDATED THE GRIDS/FCST TO MENTION AREAS OF FOG DEVELOPING.
CLEARING SKIES OVER MUCH OF THE AREA COMBINED WITH RESIDUAL
MOISTURE AND LIGHT WINDS FAVOR FOG FORMATION. CURRENT THINKING IS
THE FOG EXPECTED TO BECOME WIDESPREAD BY LATE TONIGHT…AND WILL
PROBABLY BECOME DENSE IN AREAS. HAVE HELD OFF ON A DENSE FOG
ADVISORY TO TRY TO GET A BETTER IDEA WHERE THE FOG WILL FORM…
ESPECIALLY AS SOME CLOUDS LINGER OVER NRN INDIANA.

000
FXUS63 KLOT 290906
AFDLOT

AREA FORECAST DISCUSSION
NATIONAL WEATHER SERVICE CHICAGO/ROMEOVILLE IL
406 AM CDT THU AUG 29 2013

.DISCUSSION…
324 AM CDT

THE FORECAST CHALLENGES INCLUDE FOG IN THE NEAR TERM…THEN
INCREASING TEMPS AND THUNDERSTORM CHANCES FRIDAY…FOLLOWED BY A
COOL DOWN AND RETURN TO MORE SEASONABLE CONDITIONS TOWARD END OF THE
HOLIDAY WEEKEND.

GOES IMAGERY THIS MORNING SHOWS EXPANDING AREA OF STRATUS ACROSS
MUCH OF THE FORECAST AREA WITH SURFACE OBS AND WEBCAMS SHOWING A
SMATTERING OF DENSE FOG HERE AND THERE. ALL INDICATIONS ARE THAT THE
STRATUS IS THIN AND SHOULD BURN OFF QUICKLY THIS MORNING EXPECT NEAR
THE LAKE FRONT WHERE MARINE STRATUS AND POSSIBLY EVEN SOME FOG COULD
HOLD ON INTO THE AFTERNOON. ANOTHER COMPARATIVELY COOL DAY NEAR THE
LAKE WITH 70S RANGING QUICKLY UPWARD TO 80S INLAND JUST A FEW MILES
WITH UPPER 80S TO NEAR 90 EXPECTED SOUTHERN AND WESTERN PORTIONS OF
THE CWA.

GOES_IFR_PROB_20130829_0202.png

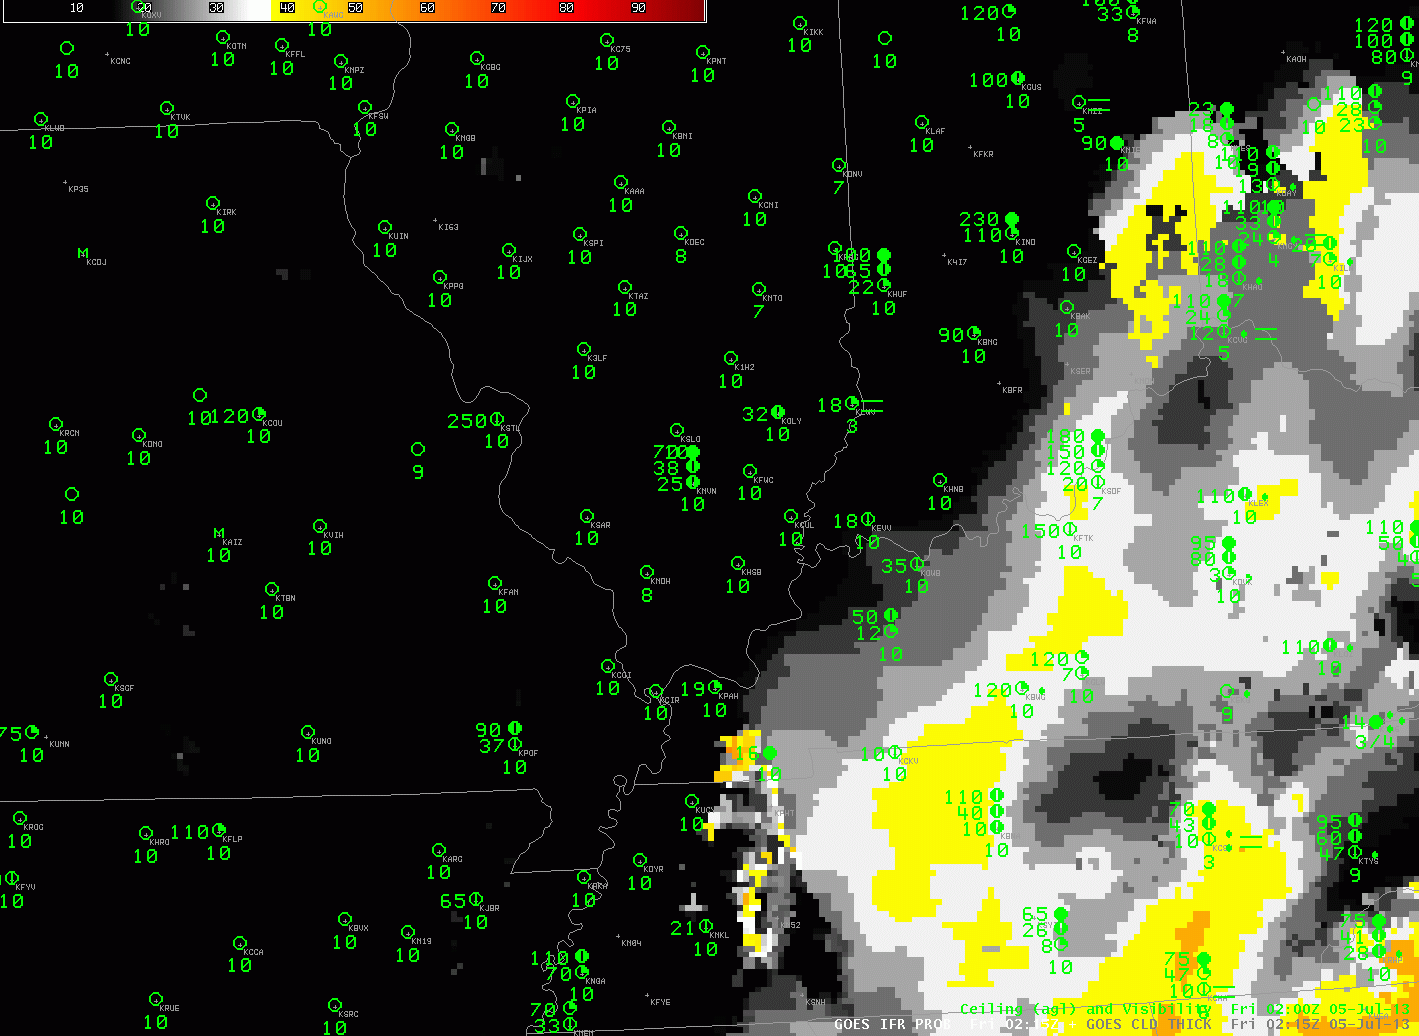
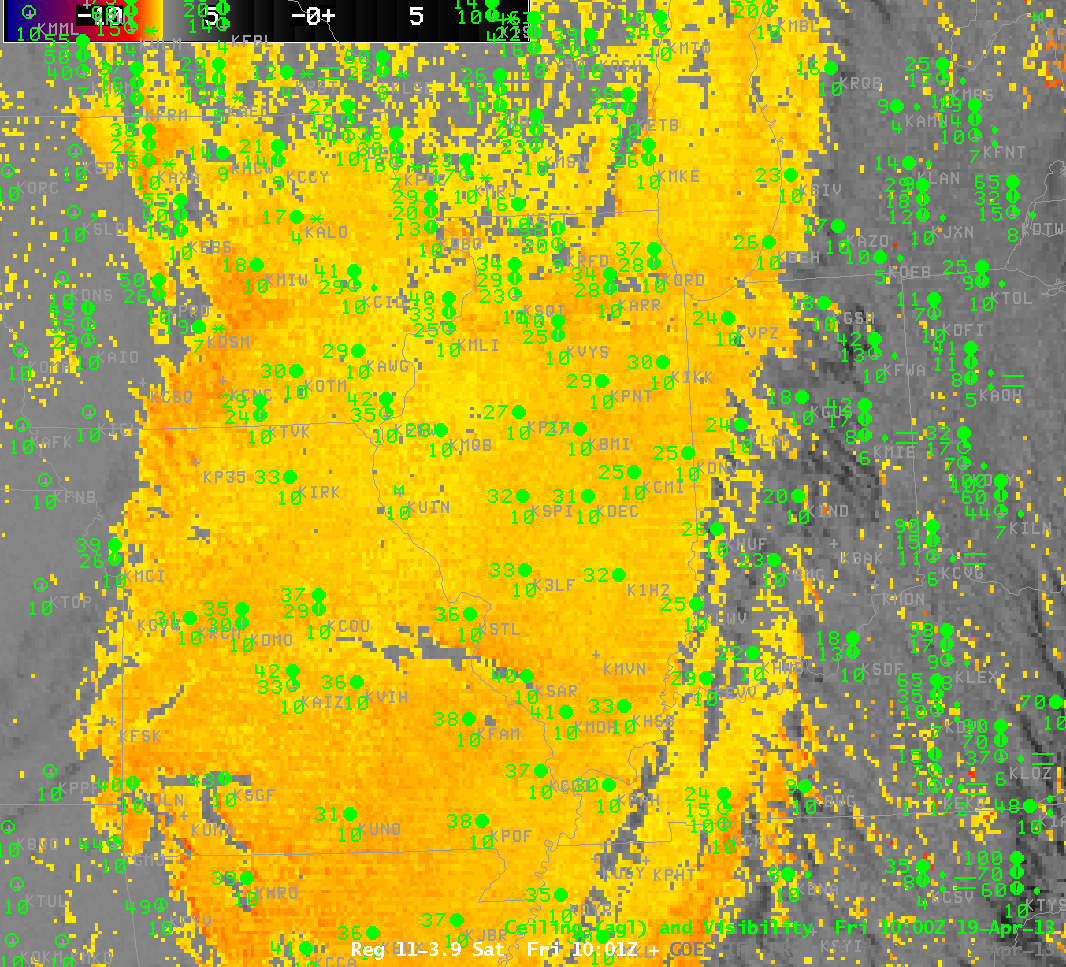
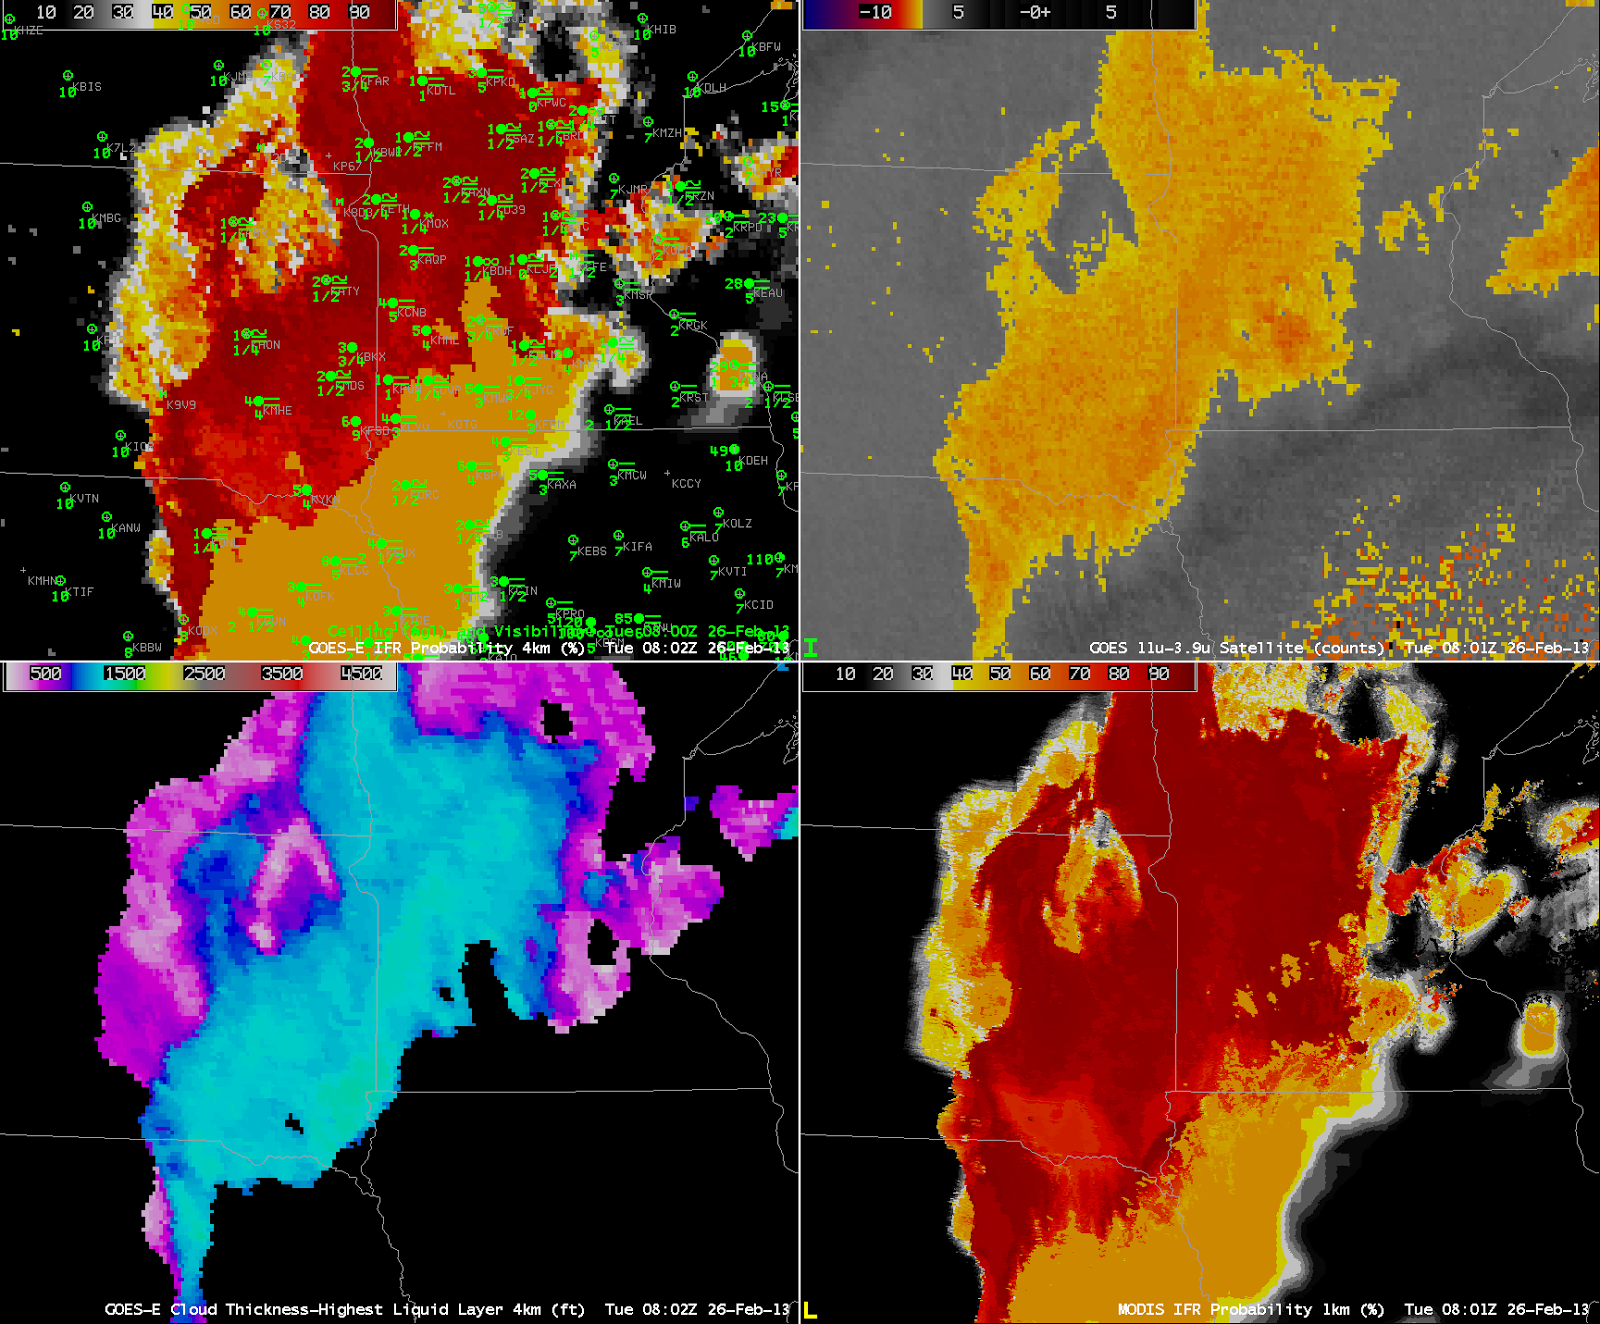
GOES-R IFR Probability (Upper Left), GOES-East Brightness Temperature Difference (Upper Right), Suomi/NPP Day/Night Band (Lower Left), GOES-R Cloud Thickness (Lower Right) (click image to play animation)

Aspects of the loop above require comment. Note that initially there is a region of enhanced brightness temperature difference over northern Indiana, between Fort Wayne (KFWA) and Muncie (KMIE), in a region where IFR conditions are not reported. The GOES-R IFR Probabilities in this region are very small (correctly), likely reflecting the influence of the Rapid Refresh model on the IFR Probability product. In other words, this is a region for which the model is not predicting low-level saturation, at least early in the evening. The Brightness Temperature Difference signal is likely a result of elevated stratus.

Later on in the animation, IFR probabilities start to increase between NW Indiana and Saginaw MI, a region where visibilities are decreasing but where the brightness temperature difference, initially, has little signal.

In this case, the IFR Probability Fields improved on the Brightness Temperature Difference predictions — suppressing a signal in regions of stratus, and developing a signal before a signal is present in the brightness temperature difference field alone. This is the power of a fused data product.

The IFR Probability field will also provide a consistent signal through sunrise.

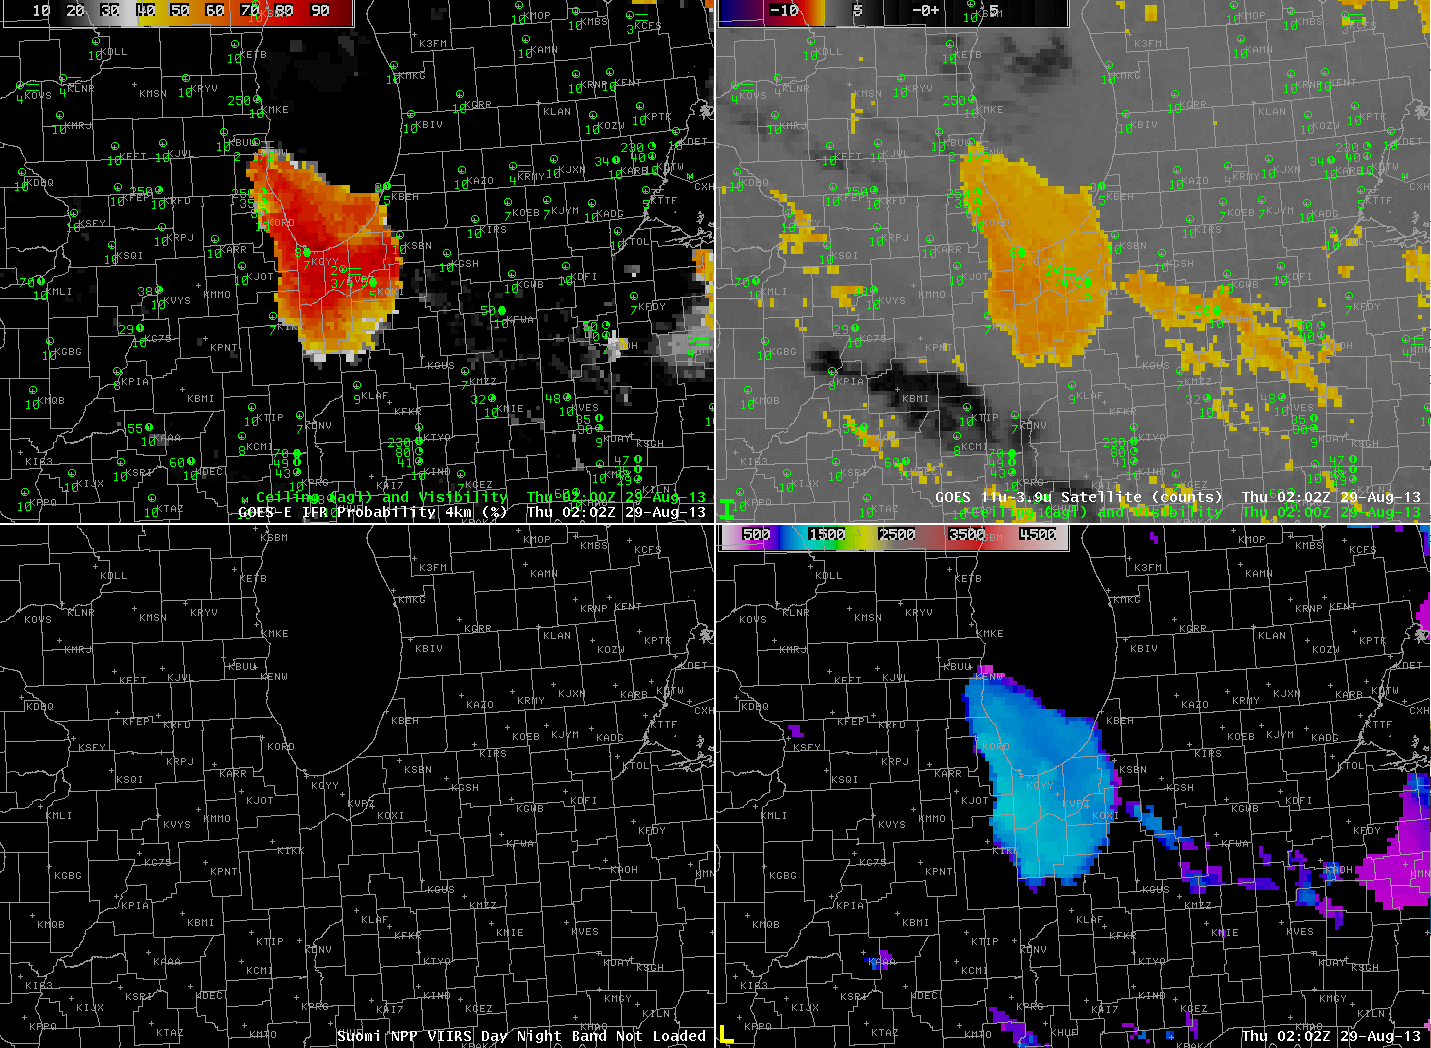
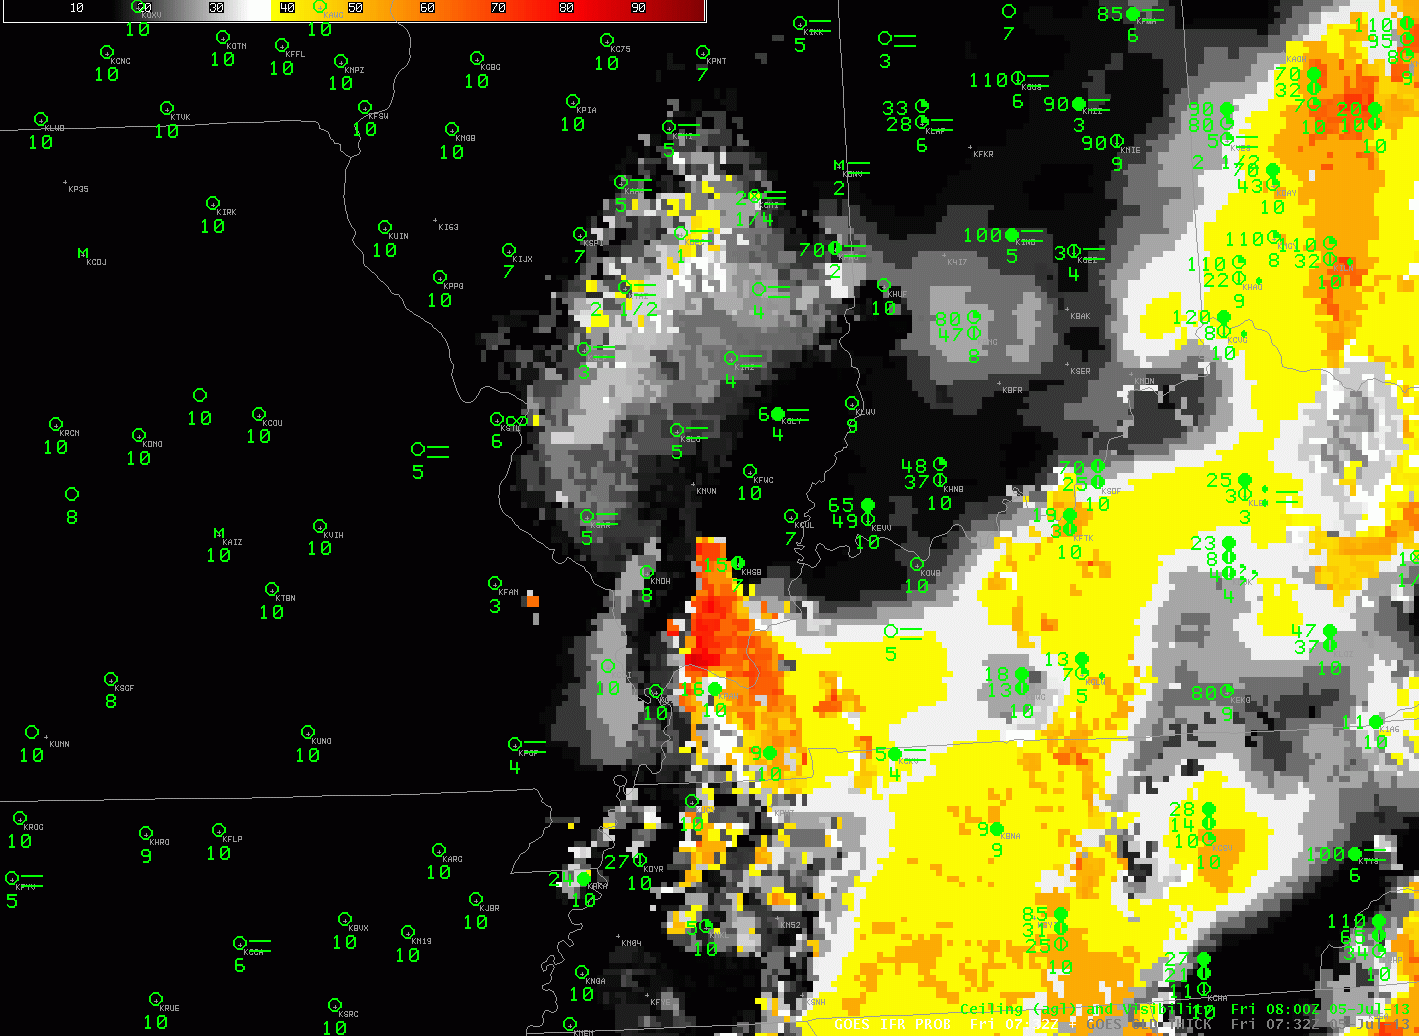
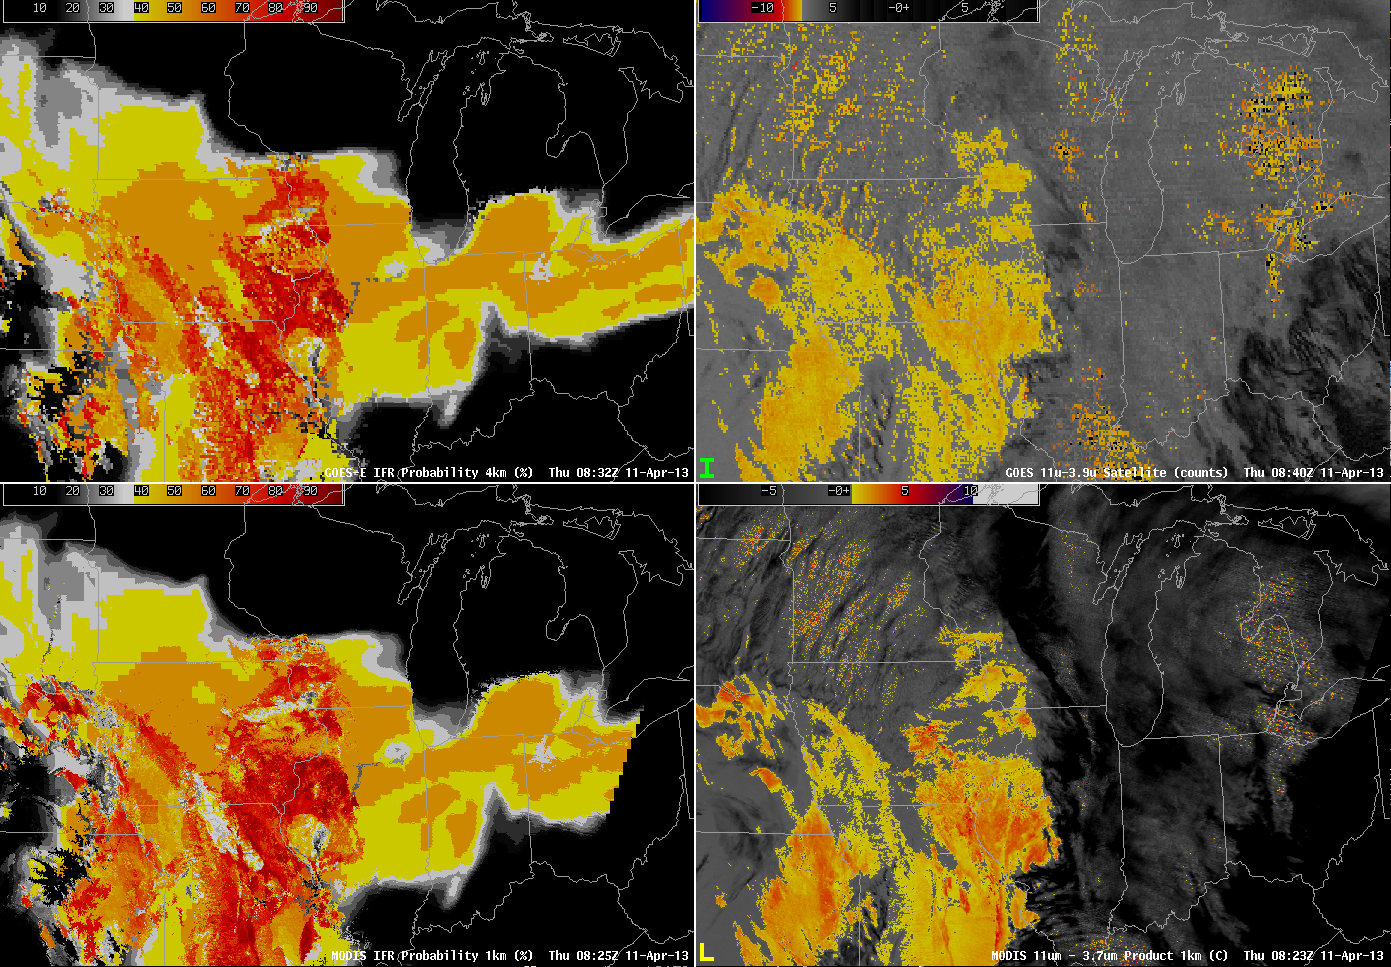
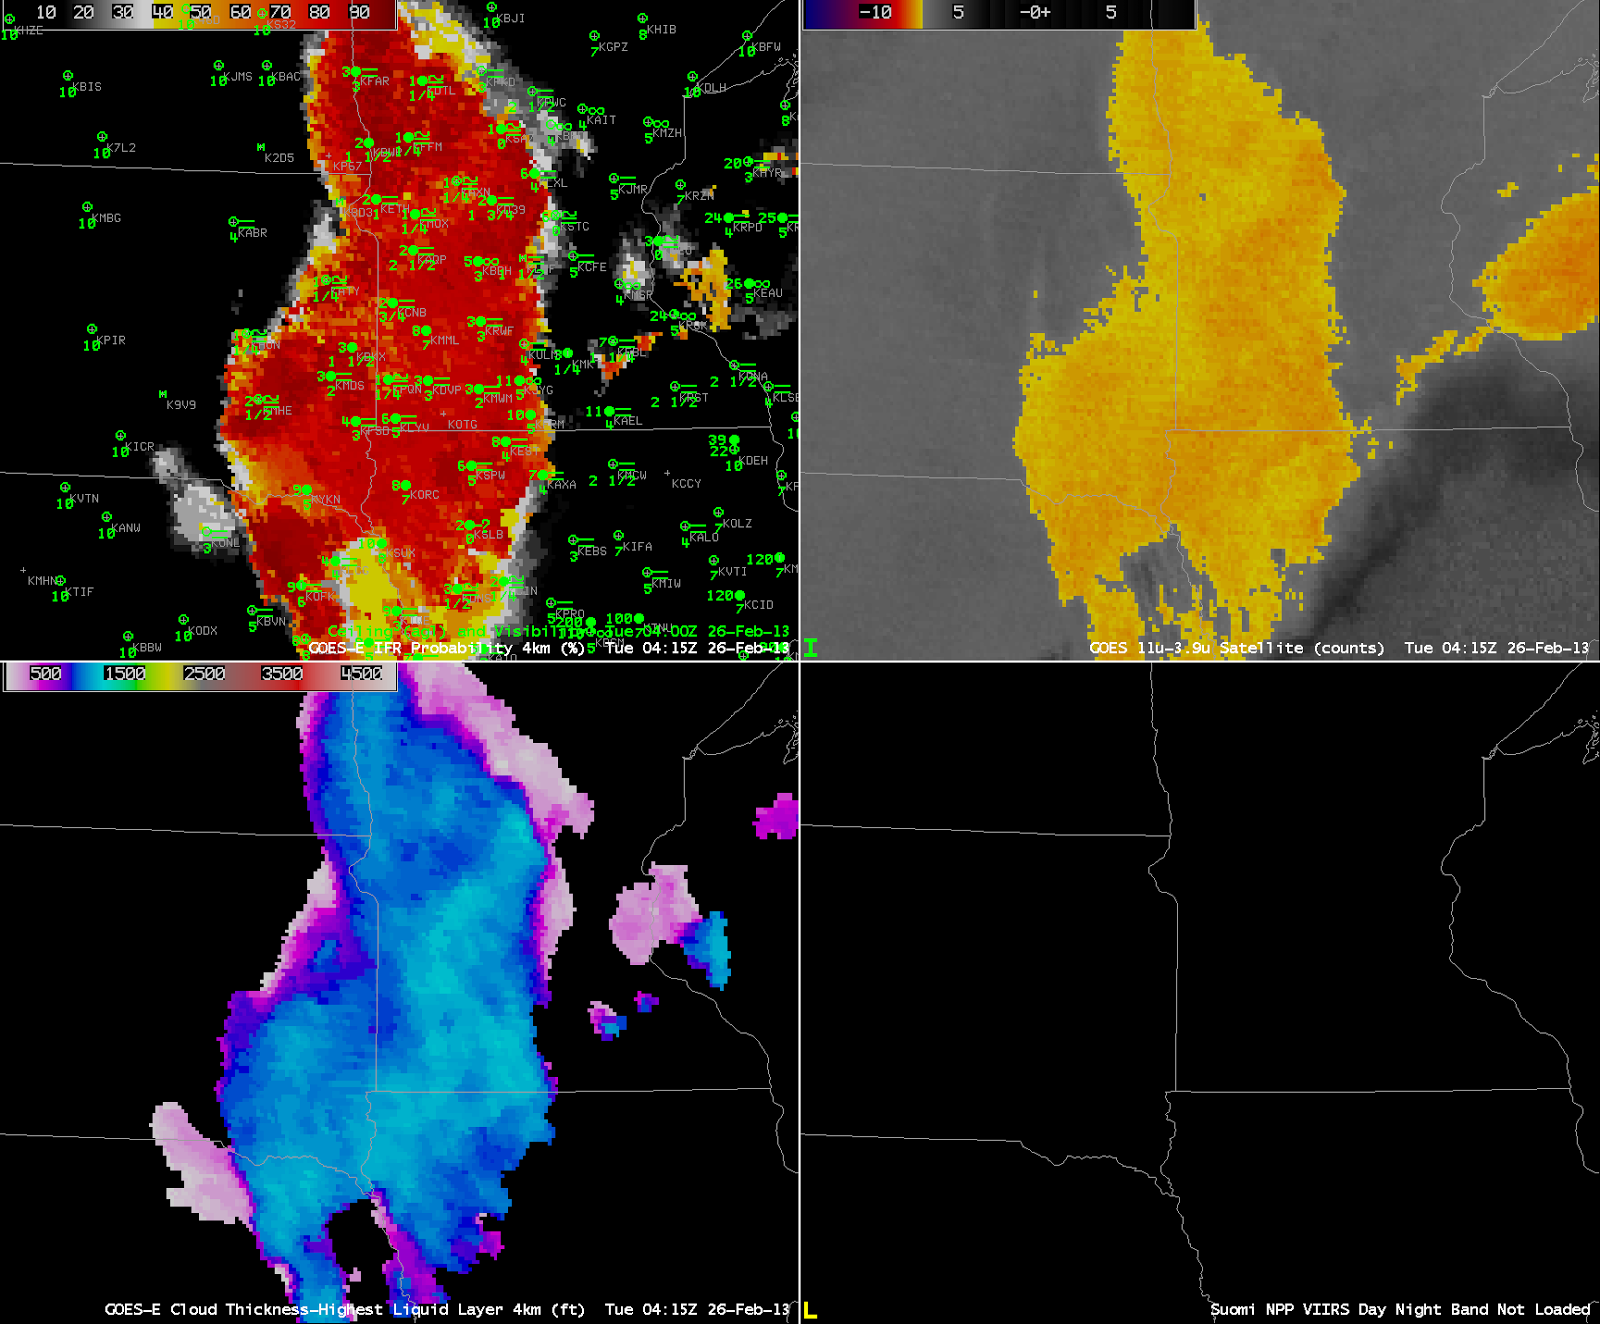
Fog dissipation is shown in the animation below (Click the image to start the animation). Cloud thickness is especially thick over central Illinois, and fog was slow to burn off there. Stratus also persisted over southern Lake Michigan.

NWINFOG_29AUGloop

Fog detection in the Upper Midwest

GOES-based GOES-R IFR Probabilities (Upper Left), GOES-East Brightness Temperature Difference (Upper Right, 10.7 µm - 3.9 µm), MODIS-based GOES-R IFR Probabilities (Lower Left), GOES-based GOES-R Cloud Thickness (Lower Right) (click image to play animation)

GOES-based GOES-R IFR Probabilities (Upper Left), GOES-East Brightness Temperature Difference (Upper Right, 10.7 µm – 3.9 µm), MODIS-based GOES-R IFR Probabilities (Lower Left), GOES-based GOES-R Cloud Thickness (Lower Right) (click image to play animation)

As nights lengthen in the upper Midwest in late Summer, the probability of fog development increases, especially on nights after light rainfall. The hourly animation, above, shows the gradual areal increase in high IFR probabilities that occurs as surface visibilities fall. Several aspects to the animation bear investigation. Note, for example, that at the start of the animation, the brightness temperature difference field, the traditional method used for fog detection, has a strong signal over eastern Illinois and western Indiana, a region where IFR conditions are not reported. This is a region of stratus clouds. Rapid Refresh model data that are incorporated into the GOES-R algorithm screens out these mid-level clouds; IFR probabilities in that region are correctly negligible. The end of the animation, 1215 UTC, occurs after sunrise, and reflected 3.9 µm solar radiation is affecting the brightness temperature difference field. The solar radiation complicates the use of the brightness temperature difference field as the sun rises. (Note also in that 1215 UTC image that GOES-R Cloud Thickness is not computed as it is during twilight conditions).

VIIRS_20130806toggle

The VIIRS instrument on board Suomi/NPP includes a day/night band that uses reflected Earth Glow and reflected lunar light to detect clouds. When the moon has set (or near times of the new moon — and the new moon occurs on August 6th, the date of these images), the scant illumination from Earthglow only makes low cloud detection a challenge. The brightness temperature difference product will still detect water-based cloudiness, however, as shown in the toggle above. However, the brightness temperature difference product does not include information on the cloud base, only on the cloud top. Incorporation of Suomi/NPP data into the GOES-R IFR Probability algorithm is ongoing.

Cloud thickness as a Predictor for dissipation time

GOES-R IFR Probabilities (Upper Left) computed from GOES-East data, Brightness temperature difference (GOES-East, 10.7 – 3.9 ), GOES-R Cloud Thickness (Lower Left), Suomi-NPP Day/Night Band (Lower Right).  All images hourly, 0515 UTC through 1115 UTC on 22 July 2013.

When fog forms overnight because of radiational cooling to the dewpoint, the thickness of the fog is related to the time it will take for the fog to dissipate.  In general, thick fog dissipates more slowly than thin, and because thick fog is generally surrounded by thinner fog, a region of fog/low stratus will generally erode from the outside in.  The animation above shows the gradual development and expansion of fog overnight over Iowa, Illinois and Missouri, with thicknesses over southeastern Iowa eventually reaching values of 1100 feet!

The relationship between time of dissipation and fog depth is shown on this chart, where the depth is the last pre-twilight image.  For 22 July 2013, that image is at 1045 UTC, shown below.  A value of 1100 feet corresponds to a dissipation time of 2-3 hours after sunrise.

As above, but for 1045 UTC 22 July 2013

The visible animation, below, shows dissipation between 1400 and 1500 UTC.

GOES-13 Visible imagery, 1215 through 1545 UTC 22 July 2013

Suomi/NPP data showed a snapshot of the fog development in this region at ~0800 UTC.

As above, but with a toggle of the Day/Night band and a Brightness Temperature Difference, all imagery at 0802 UTC 22 July 2013.

Lake Superior Plus High Dewpoints Means Fog

GOES-R IFR Probabilities computed from GOES-East, and surface observations of ceilings/visibilities (Upper Left), GOES-East Brightness Temperature Difference (10.7 µm – 3.9 µm) (Upper Right), GOES-R Cloud Thickness computed from GOES-East (Lower Left), GOES-R IFR Probabilities computed from MODIS (Lower Right)

The combination of cold Lake surface temperatures in the 40s and 50s over Lake Superior and mid-Summer dewpoints in the 60s to near 70 is a recipe for fog over the upper midwest. North winds behind a complex of thunderstorms fostered the development of fog and low stratus over the upper midwest early in the morning on July 8th, as shown in the imagery above.

The GOES-R IFR Probability fields seamlessly track the expansion of fog/low stratus in the region around western Lake Superior;  highest probabilities are confined to regions where IFR or near-IFR conditions are observed.  The IFR Probabilities also downplay regions where the brightness temperature difference field is showing a signal (northwest Minnesota) but where visibility obscurations are small.

IFR Probabilities are not as large over southern upper Michigan or over north-central Wisconsin, regions where multiple cloud layers mean that the satellite component does not contribute to IFR Probability computation, resulting in a smaller value.  Note that Cloud Thickness is not initially computed there either:  Cloud Thickness describes the thickness of the lowest water-based cloud layer in non-twilight conditions.  If there are multiple cloud layers that include mixed-phase of ice clouds, cloud thickness is not computed.  Note also that cloud thickness is not computed in the hours around sunrise (i.e., during twilight conditions).

By 1702 UTC, the final image, the Summer Sun has burned off much of the fog and low stratus, with the exception being along the shorline of Lake Superior.  MODIS-based IFR Probabilities have much sharper edges because of the higher resolution of the MODIS instrument compared to the GOES Imager.

Fog Development over central Illinois

GOES-R IFR Probabilities computed from GOES-East, hourly from 0215 UTC through 1115 UTC on July 5 2013

GOES-R IFR Probabilities show a characteristic increase over central Illinois as radiation fog develops in the early morning hours of July 5 2013.  Probabilities are initially low, but gradually increase, and spread, as the fog develops.  The IFR probability field over Tennessee, Indiana and Kentucky has the characteristic flat look of a field produced mainly from model fields:  the probability field is flat, and IFR probabilities are low.  There are regions — such as near Nashville at the end of the animation — where the field includes satellite data;  IFR Probabilities there are larger and the IFR Probability field has a more pixelated appearance.

If multiple cloud layers are present, you should not expect the GOES-R Cloud Thickness product to yield a value.  GOES-R Cloud Thickness diagnoses the thickness of the highest water-based cloud in non-twilight conditions.  If ice clouds (or mixed phase) clouds are present, cloud thickness will not be computed.  The toggle below shows cloud thickness, GOES-R IFR Probabilities, and the Brightness Temperature Difference (10.7 µm – 3.9 µm)

GOES-R IFR Probabilities, GOES-R Cloud Thickness, and GOES-East Brightness Temperature Difference, 0730 UTC on 5 July 2013

There a several things of note in the image above.  IFR Probability field in central Illinois have higher values south of the peak in the brightness temperature difference field, where the lowest visibilities and ceilings are reported.  GOES-R Cloud Thickness is unavailable in regions underneath the high clouds in the eastern part of the imagery — over Tennessee and Kentucky, except where there are holes in the clouds.  Note how these regions of diagnosed GOES-R Cloud Thickness overlap with regions of pixelated GOES-R IFR Probability fields.  In both fields, Satellite data are being used for the computation.

Small IFR Probabilities in clear regions: Why?

GOES-R IFR Probabilities over the Mississippi River Valley, 1045 and 1402 UTC 14 May 2013

GOES-R IFR Probabilities over the bootheel of Missouri and northeast Arkansas were erroneously high on Tuesday 14 May (and also on Monday 13 May).  This was a region of mostly clear skies.  Why, then did IFR probabilities have values exceeding zero?

Toggle between 10.7 µm imagery and GOES-R IFR Probabilities, 1402 UTC 14 May 2013

The 10.7 µm imagery does show a cool cloud overlaying the region of modest IFR probabilities.  This cloud has the appearance of a thin cirrus cloud through which radiation emitted from the surface is filtering.  Brightness temperatures at the outer edge of the cloud — where IFR probabilities are highest — are around 10 C.  This thin cloud might normally be screened out by the daytime visible cloud mask.  However, as shown below, the thin cirrus cloud is over a surface that is white enough that the cloud mask considers it to be cloud.

Always use the IFR probability in concert with other available data to ensure the computed probabilities are sensible.

Visible Imagery, 1402 UTC on 14 May 2013

Stratus over Missouri, low clouds over Ohio

Toggle between the traditional brightness temperature difference field from GOES-East and the GOES-R IFR Probabilities, 1000 UTC on 19 April 2013

A significant shortcoming to the traditional method of detecting fog, the brightness temperature difference between 10.7 and 3.9 microns, which difference arises because of differences in the emissivity properties of water-based clouds at the two wavelengths, is that stratus decks and fog banks look very similar when viewed from a satellite.  In this example from early morning on April 19th, low-level moisture trapped near the surface behind a significant rain-producing cyclone has allowed the formation of clouds over Missouri.  But the brightness temperature difference field cannot say if these clouds are an aviation hazard.  The surface observations of ceilings and visibilities show that ceilings are high and visibilities are unobstructed.  The GOES-R IFR probability field correctly minimized the influence of the satellite signal in this region, because the Rapid Refresh Model does not predict conditions consistent with fog and low stratus.

There are reduced visibilities and lowered ceilings near the cold front that at 1000 UTC was pushing into western Ohio, and these are correctly suggested by the IFR probability fields.  Multiple cloud layers there preclude the detection of low-level clouds by the traditional brightness temperature difference method.

In this case, the IFR Probabilities did a good job of eliminating the false positive from the brightness temperature difference over Missouri — where IFR conditions were absent — and of rectifying the false negative from the brightness temperature difference over Ohio — where IFR and near-IFR conditions were found.

IFR Conditions surround Chicago’s O’Hare Airport

GOES-R IFR Probabilities and Surface Observations of ceilings and visibilities, hourly from 1700 through 2100 UTC, 18 April 2013

Chicago O’Hare is a busy hub airport, and obstructions to visibility there have a great impact on air routing.  Thus, any tool that can give information about ceilings and visibilities — IFR conditions — can help.  In this animation from late afternoon on April 18, 2013, IFR Probabilities show a distinct minimum over northeast Illinois, and surface observations from airports in that region are consistent with the lack of low ceilings.  In contrast, higher IFR probabilities exist over Wisconsin, where IFR conditions are widespread.  IFR probabilities are high over Lake Michigan because high dewpoint air is moving over still-cold lake waters;  advection fog results.

IFR Probabilities with an Early Spring storm system

GOES-R IFR Probabilities (Left) and Brightness Temperature Differences (Right) Computed from GOES-East (Top) and MODIS (Bottom)

The multiple cloud layers that are common with an extratropical cyclone preclude identification of fog/low clouds by traditional brightness temperature difference methods because low clouds are overlain by mid-level and higher clouds. Thus, the satellite is unable to view them.  In the images above from early morning on 11 April over the midwest, both GOES and MODIS detect low clouds over southern Iowa and Missouri.  The GOES-R IFR Probability fields show enhanced probabilities over a larger region that stretches from northern Ohio westward to southwestern Minnesota, and southward from Iowa to Missouri.  Observed ceilings show IFR (or near-IFR) conditions from northwest Ohio westward to northern Iowa.  Regions of model-based enhanced IFR probabilities capture this region of IFR conditions.  IFR ceilings also exist under the region where the traditional brightness temperature difference field has a strong signal.  When interpreting the IFR probability fields, it is important to recognize the differences that arise due to differences in the predictors used (for example, between the higher IFR probabilities over southeast Iowa — where satellite and model data are used — and the lower probabilities over north central Iowa where only model data are used).

Observed Ceilings, in feet, over the midwest, 0900 UTC on 11 April 2013

IFR conditions over the upper Midwest

GOES-R IFR Probabilities from GOES-East (Upper Left) at 0832 UTC, along with 0900 UTC observations, Traditional GOES-East Brightness Temperature Difference (10.7  µm – 3.9  µm) at 0832 UTC (Upper Right), GOES-R Cloud Thickness computed from GOES-East (Lower Left), Suomi/NPP Day/Night Band Nighttime visible imagery, 0838 UTC (Lower Left)

Stratus and low clouds persisted over western Minnesota and the eastern Dakotas overnight on 25 to 26 February, and the GOES-R IFR Probability field ably captured the region of lowest visibility.  Note that the IFR probability field extends into northwest Iowa (albeit with relatively lower probabilities).  This is a region where high-level cirrus prevents the traditional brightness temperature difference product from giving useful information about the low levels.  In this region, Rapid Refresh data are used to fill in information and more accurately capture the region of IFR conditions.

As above, but for 0802 UTC for GOES-East Products, and with the MODIS-based IFR probability field at 0801 UTC in the lower left

GOES-R IFR Probabilities can be used with MODIS data as well, and the better resolution (1 km at nadir vs. 4 km at GOES nadir) means the MODIS fields have better small-scale detail.    Note, for exanple, the sharper edge to the IFR probability field in east-central Minnesota.

As at the beginning of the post, except for 0415 UTC (top), 0432 UTC (middle) and 0445 UTC(bottom)

Stray-light issues can influence the 3.9 µm imagery, and therefore the brightness temperature difference field, and therefore the GOES-R IFR Probability field.  In the three images above, Stray Light is noteable in the 3.9 µm at 0432 UTC, but that erroneous information can be de-emphasized in the GOES-R IFR probability field because the Rapid Refresh Data in regions where Stray Light is present may show dryer low levels.