Category Archives: Midwest

Fog in the Ohio Valley

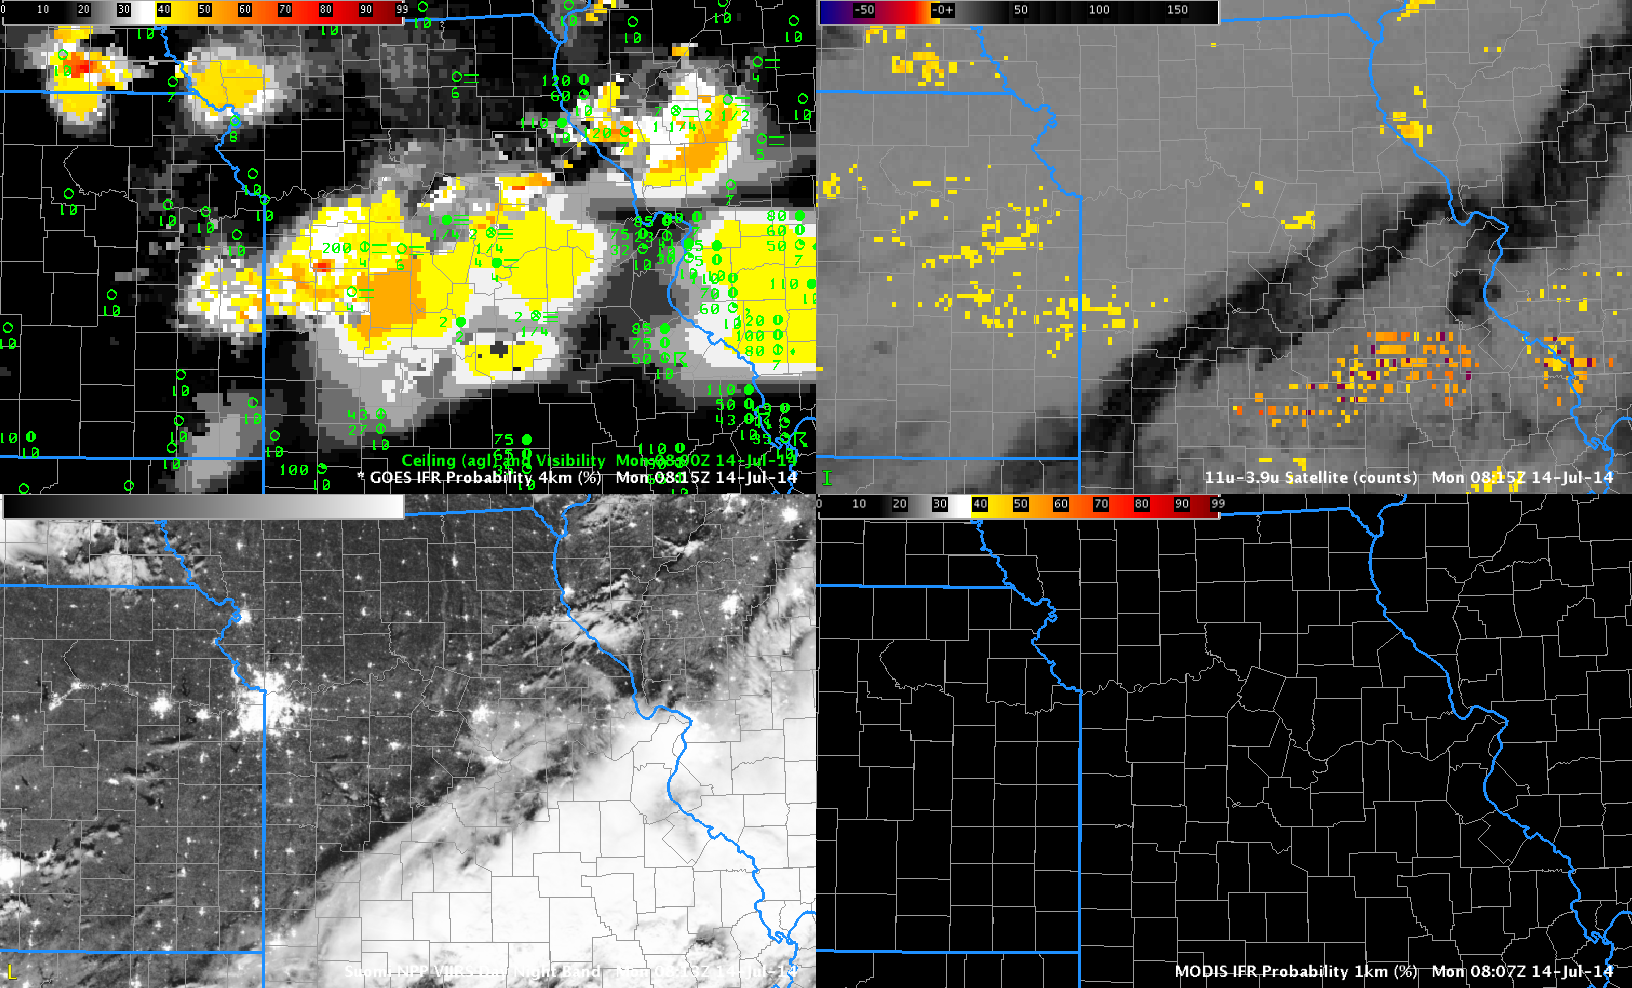
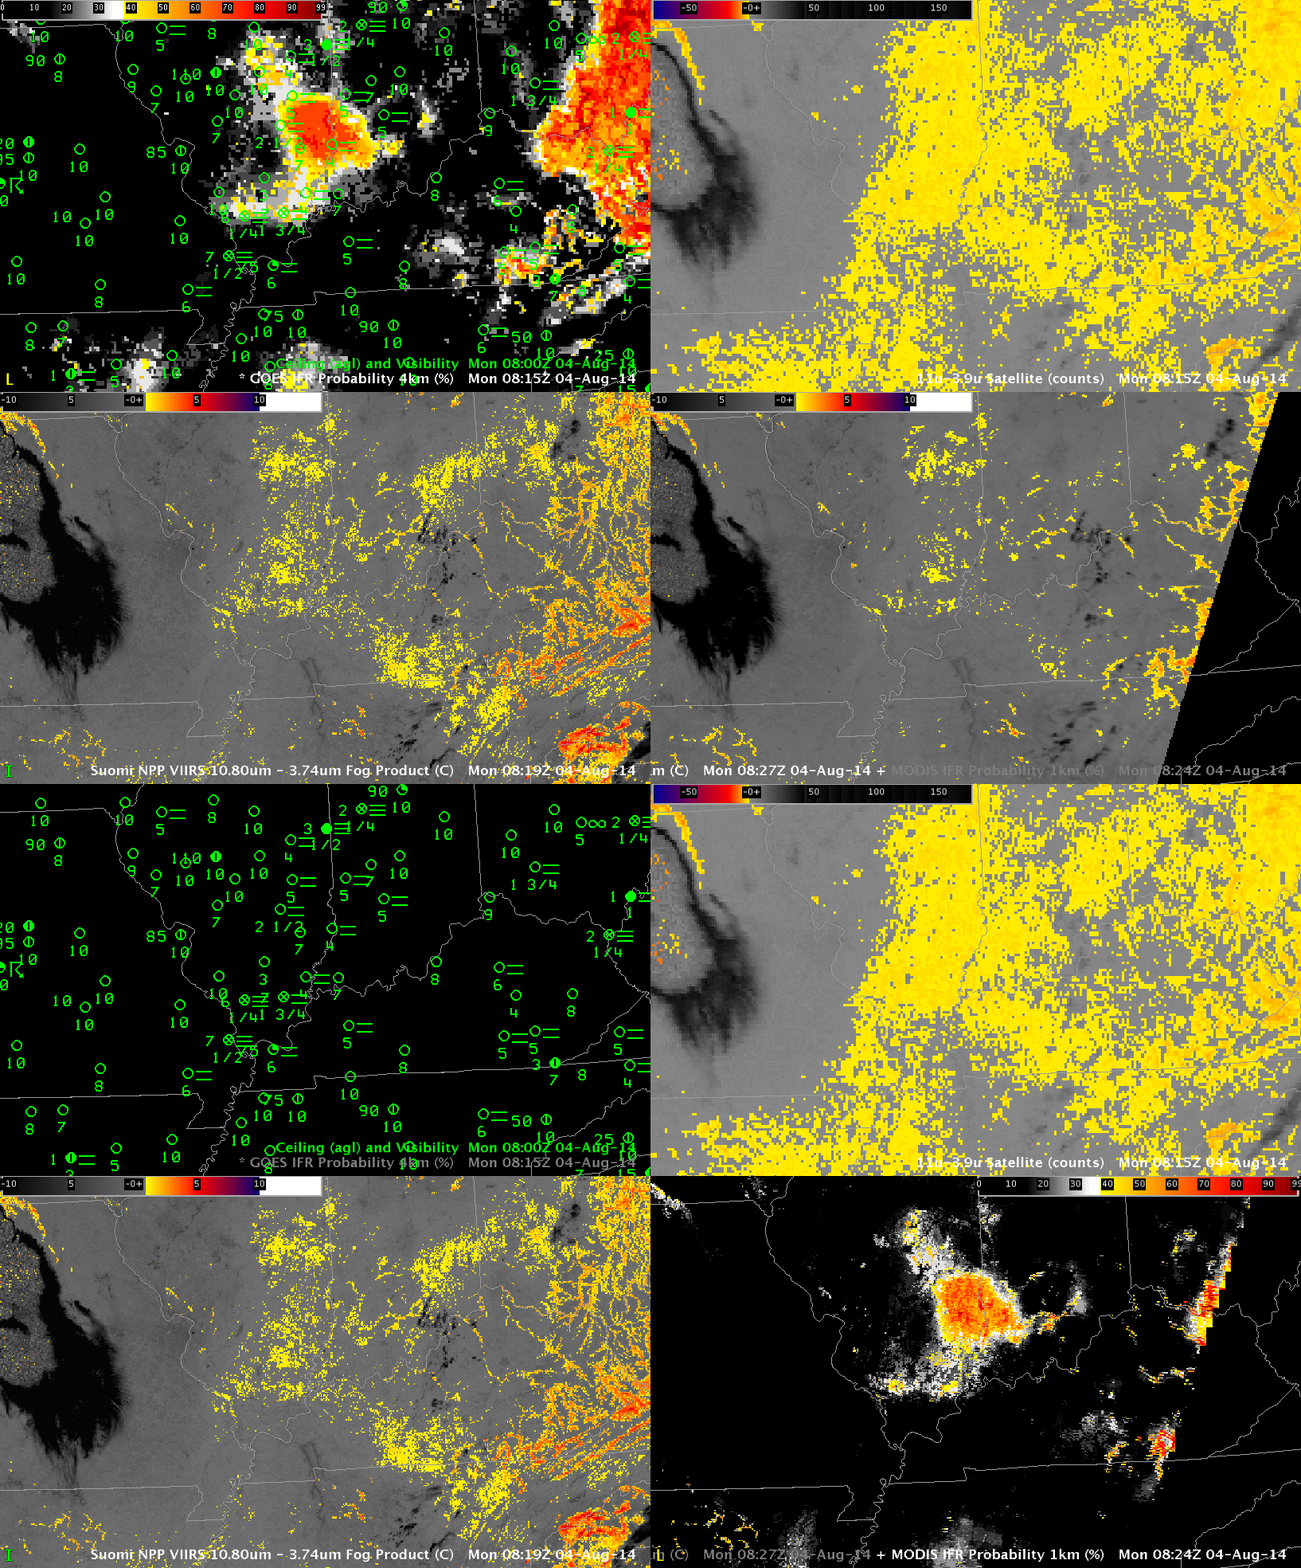
GOES_OBS_BTD_SNPPBTD_MODISIFR_04August2014_0815

GOES-R IFR Probabilities and Surface observations of Ceiling and Visibility (Upper Left), GOES-East Brightness Temperature Difference (10.7 µm – 3.9 µm) (Upper Right), Suomi-NPP Brightness Temperature Difference (11.35 µm – 3.74 µm) (Lower Left), MODIS-based IFR Probabilities and Brightness Temperature Difference (11.0 µm – 3.9 µm) (Lower Right), all times as indicated

There are different ways to alert a forecaster to the presence of a transporation hazard like low ceilings and reduced visibilities. The imagery above shows GOES-based (nominal 4-km resolution at nadir) products (top) and Suomi/NPP and MODIS-based products (nominal 1-km resolution — or better — at nadir). The Brightness Temperature Difference from GOES (upper right) overestimates the region with lowered ceilings; in contrast, the IFR Probability field (upper Left) is able to distinguish between elevated stratus and low stratus because it includes information from the Rapid Refresh model to identify regions with saturation in the lowest levels of the atmosphere. This allows the IFR Probability to screen out regions of mid-level stratus.

The Suomi NPP and MODIS Brightness Temperature Difference fields do not suggest widespread stratus as does the GOES-based Brightness Temperature Difference field. Rather, the data from the polar orbiters suggest regions of stratus or fog in river valleys over Kentucky, Indiana and Illinois. MODIS-based IFR Probability (Lower Right) agrees with the GOES-based IFR Probability field: a region of fog/low stratus is developing over southwestern Indiana and southeastern Illinois, near the Wabash River. In this case, the model data is helping to strengthen a weak signal in a region where fog is present. Model data is a key strength in the IFR Probability field.

Polar orbiters give excellent horizontal resolution, but only GOES provides the high temporal resolution necessary to monitor the development of fog/low stratus. The toggle between 0800 and 1100 UTC, below, for example, depicts an increase in fog. A single GOES satellite can (and does) monitor that increase. A suite of polar orbiters would be required to give similar temporal coverage in middle latitudes.

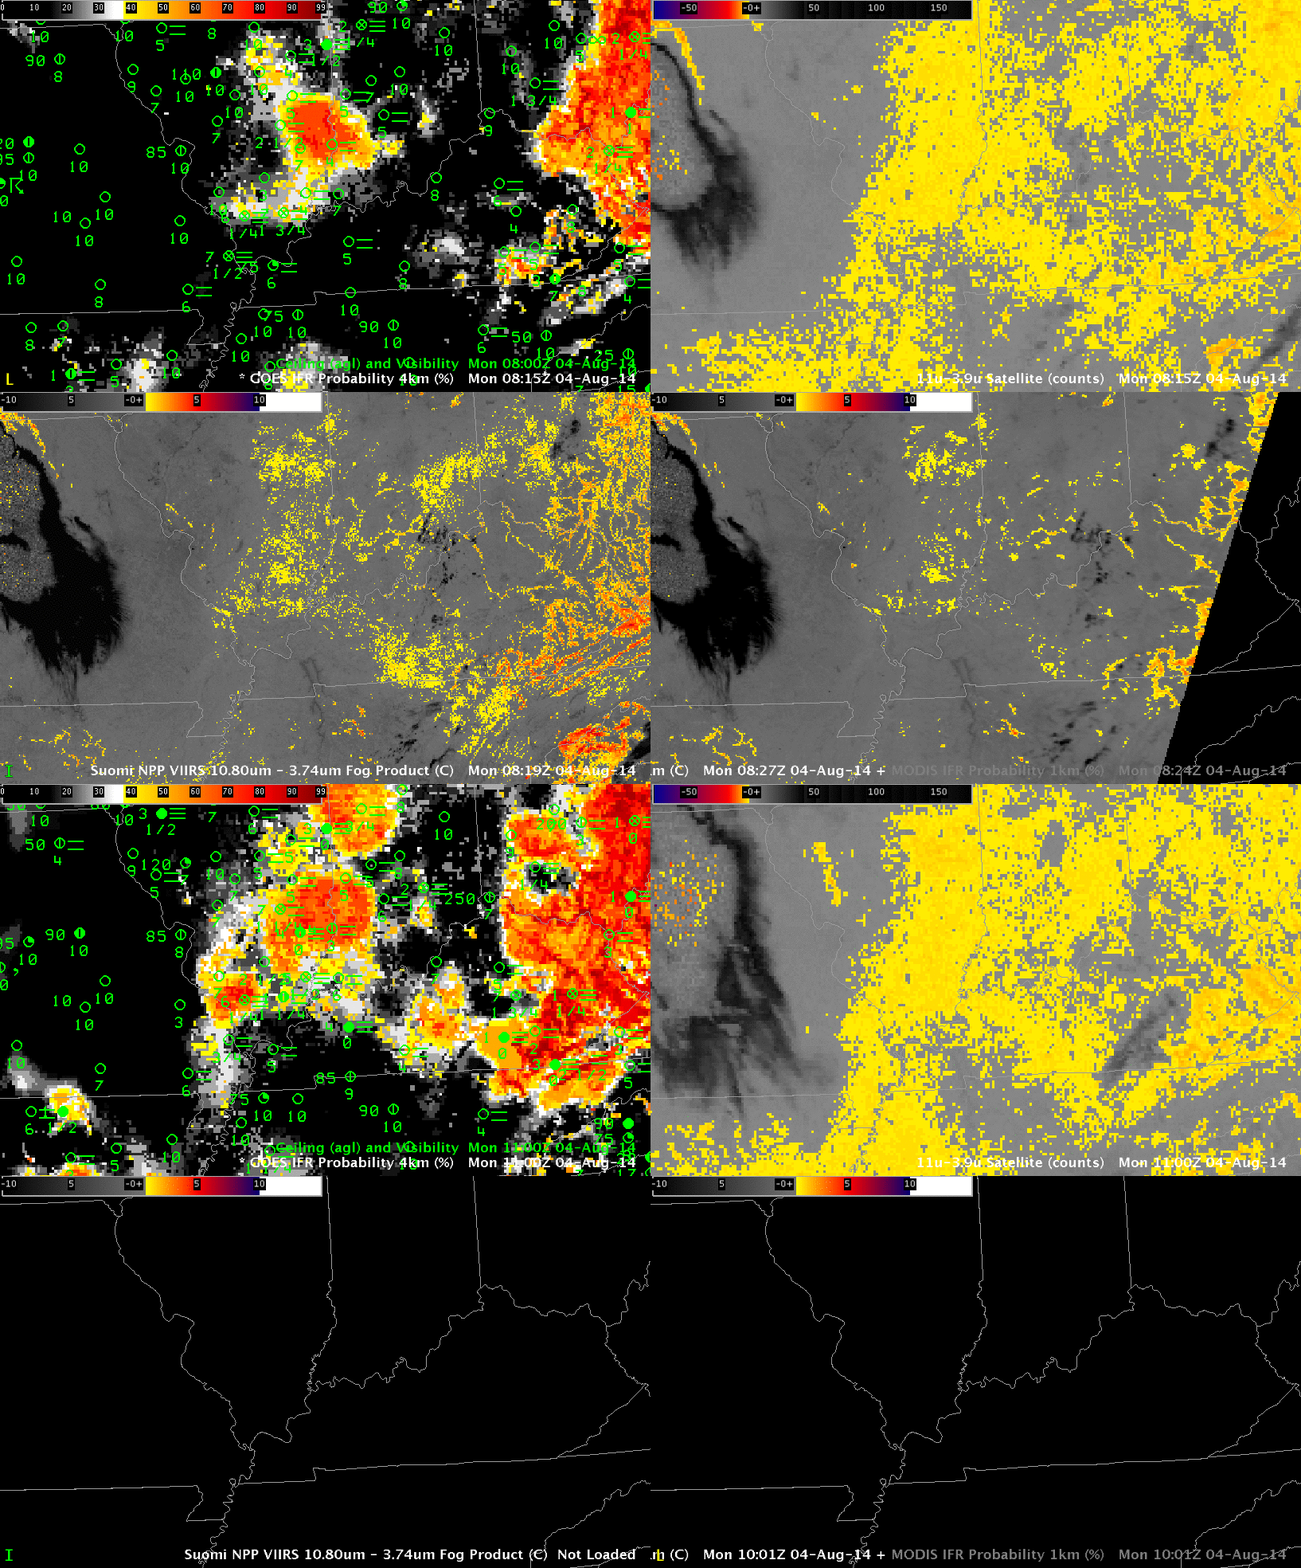
GOESIFR_BTD_04August2014_0815-1100

As above, times as indicated

Dense Fog Advisories over Missouri

CentralMissouri_14July2014loop

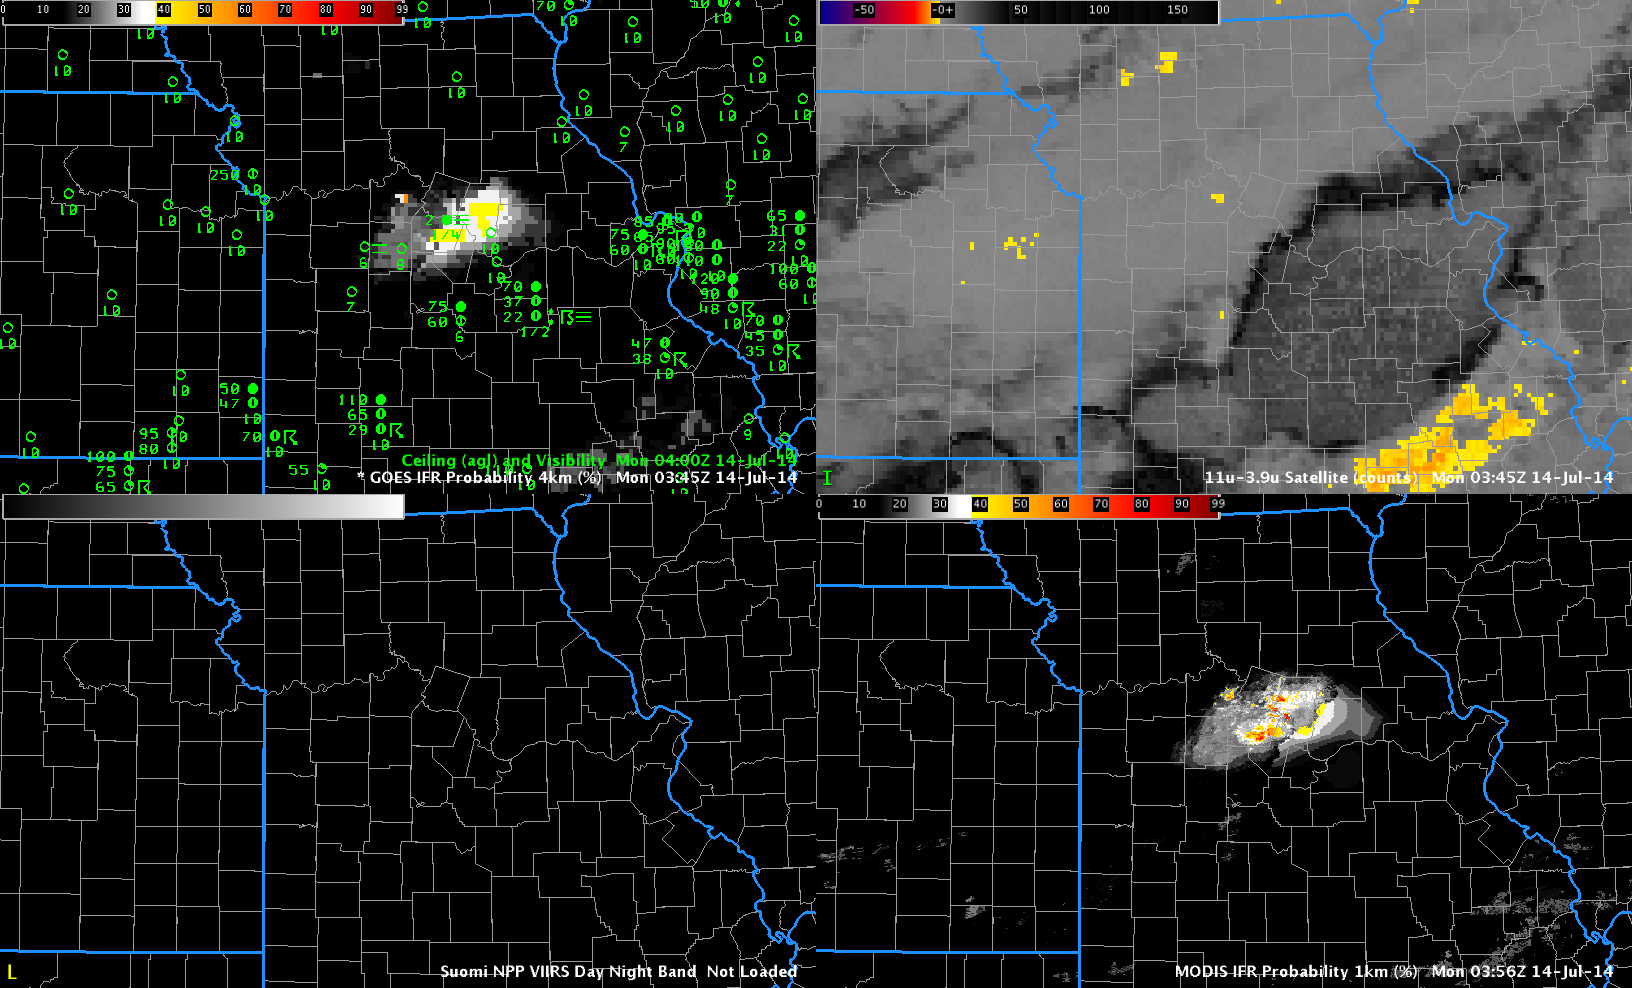
GOES-R IFR Probabilities (Upper Left), GOES-East Brightness Temperature Difference (10.7 µm – 3.9 µm) (Upper Right), Suomi/NPP Day/Night Band imagery (Lower Right), MODIS-based IFR Probabilitiy (Lower Left), times as indicated (Click to animate)

Moisture from departing late-day thunderstorms allowed for the development of dense fog over central Missouri overnight. The GOES-based IFR Probabilities, above, capture the low ceilings and reduced visibilities that developed. The traditional method of fog detection, the brightness temperature difference (BTD) between the 10.7 µm and 3.9 µm fields, was hampered by mid- and high-level clouds associated with the departing convection.

Polar-orbiting satellites such as Terra, Aqua and Suomi NPP can give high-resolution views of developing fog. In the present case, Terra overflew the region near 0400 UTC. The image below shows enhanced MODIS-based IFR Probabilities confined to central Missouri. An Aqua overpass at ~0800 UTC similarly gave a high spatial resolution view of the area. Of course, Terra and Aqua and Suomi NPP only give occasionaly snapshots. To see the ongoing development, temporal resolution as from GOES is key. But the polar orbiters can give an early alert if developing fog starts out at small scales that might be sub-pixel scale in GOES.

CentralMissouri_14July2014-18

As above, but at 0400 UTC 14 July 2014 (Click to enlarge)

From the National Weather Service in St. Louis:

URGENT – WEATHER MESSAGE
NATIONAL WEATHER SERVICE ST LOUIS MO
527 AM CDT MON JUL 14 2014

MOZ041-047>051-059-141400-
/O.NEW.KLSX.FG.Y.0002.140714T1027Z-140714T1400Z/
BOONE MO-CALLAWAY MO-COLE MO-GASCONADE MO-MONITEAU MO-
MONTGOMERY MO-OSAGE MO-
INCLUDING THE CITIES OF…COLUMBIA…JEFFERSON CITY
527 AM CDT MON JUL 14 2014

…DENSE FOG ADVISORY IN EFFECT UNTIL 9 AM CDT THIS MORNING…

THE NATIONAL WEATHER SERVICE IN ST LOUIS HAS ISSUED A DENSE FOG
ADVISORY…WHICH IS IN EFFECT UNTIL 9 AM CDT THIS MORNING.

* TIMING…DENSE FOG HAS DEVELOPED AND WILL CONTINUE THROUGH 900
AM.

* VISIBILITIES…ONE QUARTER MILE OR LESS AT TIMES.

* IMPACTS…SIGNIFICANTLY REDUCED VISIBILITIES WILL LEAD TO
HAZARDOUS DRIVING CONDITIONS.

PRECAUTIONARY/PREPAREDNESS ACTIONS…

A DENSE FOG ADVISORY IS ISSUED WHEN DENSE FOG WILL SUBSTANTIALLY
REDUCE VISIBILITIES…TO ONE-QUARTER MILE OR LESS…RESULTING IN
HAZARDOUS DRIVING CONDITIONS IN SOME AREAS. MOTORISTS ARE ADVISED
TO USE CAUTION AND SLOW DOWN…AS OBJECTS ON AND NEAR ROADWAYS
WILL BE SEEN ONLY AT CLOSE RANGE.

&&

$$

The aviation portion of the AFD from St. Louis mentioned the probability of fog at 0800 UTC; the 1129 UTC update discussed the fog that was present over central Missouri:

&&

.AVIATION: (For the 12z TAFs through 12z Tuesday Morning)
Issued at 609 AM CDT Mon Jul 14 2014

The first concern for this TAF package is that for low ceilings
and fog that have developed in the wake of precipitation that
exited the area overnight. In central MO and including KCOU, fairly
widespread dense fog has reduced visibilities to under 1/4SM for
much of the night. Further east and including metro area TAF sites,
trends indicate the potential for IFR cigs and MVFR visibility for
the first couple hours of the period. However, all sites affected
by fog should see an improvement through the morning hours as
ceilings lift and fog burns off. The second concern is that of a
second cold front, poised to move through the area today.
Currently, the cold front extends from roughly KDBQ southwestward
along the Missouri/Illinois border and just south of KAFK. While
showers may develop along the front as it moves through KUIN
during the late morning/early afternoon, greater instability
exists further south and east. Have currently continued VCSH
mention at KUIN and KCOU, and VCTS for metro TAF sites this
afternoon as the cold front moves through. Uncertainties regarding
coverage and exact timing preclude any TEMPO groups at this time.
The front should be south of all area TAF sites by 21Z, at which
time winds will have veered to the northwest and increased to
around 10-14KT. Winds will remain northwesterly through the end of
the period in the wake of the front, and while a mostly VFR
forecast is expected, reductions in ceilings/visibility may occur
with any storms that move over the terminals.

Fog over Chicago

Chicago_IFRBTD_0915_27June2014

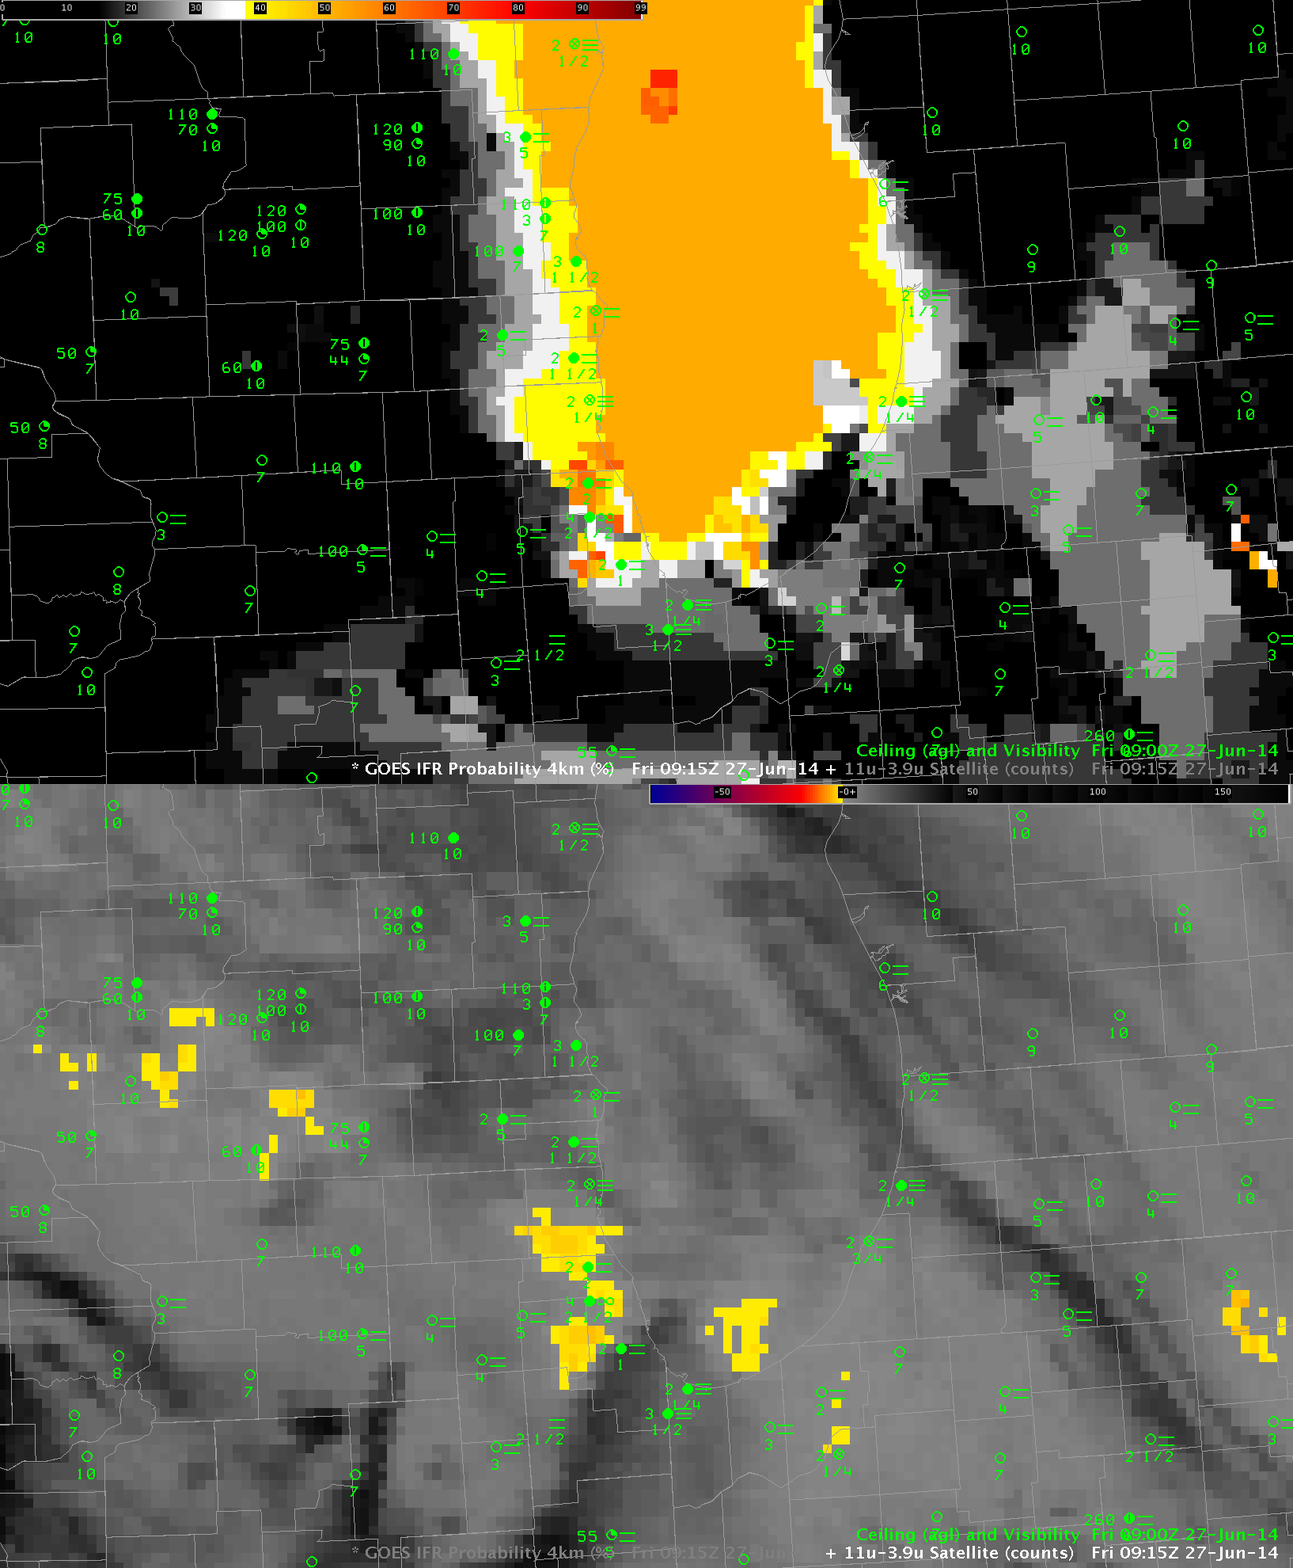
GOES-R IFR Probability and GOES-13 Brightness Temperature Difference, 0915 UTC on 27 June (Click to enlarge)

A cold winter and cool Spring have caused Lake Michigan to be much cooler than normal (Linked-to Figure is on this page). Colder-than-normal lake temperatures and warm summer dewpoints are a recipe for fog, and that fog has persisted over and near Lake Michigan this month. (Click here for a video of fog moving over Chicago on 26 June). The imagery above shows the GOES-R IFR Probability toggling with the GOES-13 Brightness Temperature Difference field (10.7µm – 3.9µm) at 0915 UTC. Abundant high clouds (cirrus from convection over the Plains) makes the brightness temperature difference method of detecting low clouds problematic. Because IFR Probability computation includes surface information, however, a useful signal near Lake Michigan that captures the extent of the fog is produced.

When high clouds prevent satellite predictors from being used, the IFR Probability field is typically fairly smooth. That is the case over most of Lake Michigan. Breaks in the high clouds at 0915 UTC over Chicago allow for satellite predictors to be used. Where that happens, IFR probabilities are larger, and the IFR Probability field is more pixelated.

Click here for a blog entry at the Washington Post on the fog.

Fog/Low Stratus and Stratus behind a late-season Snow Storm

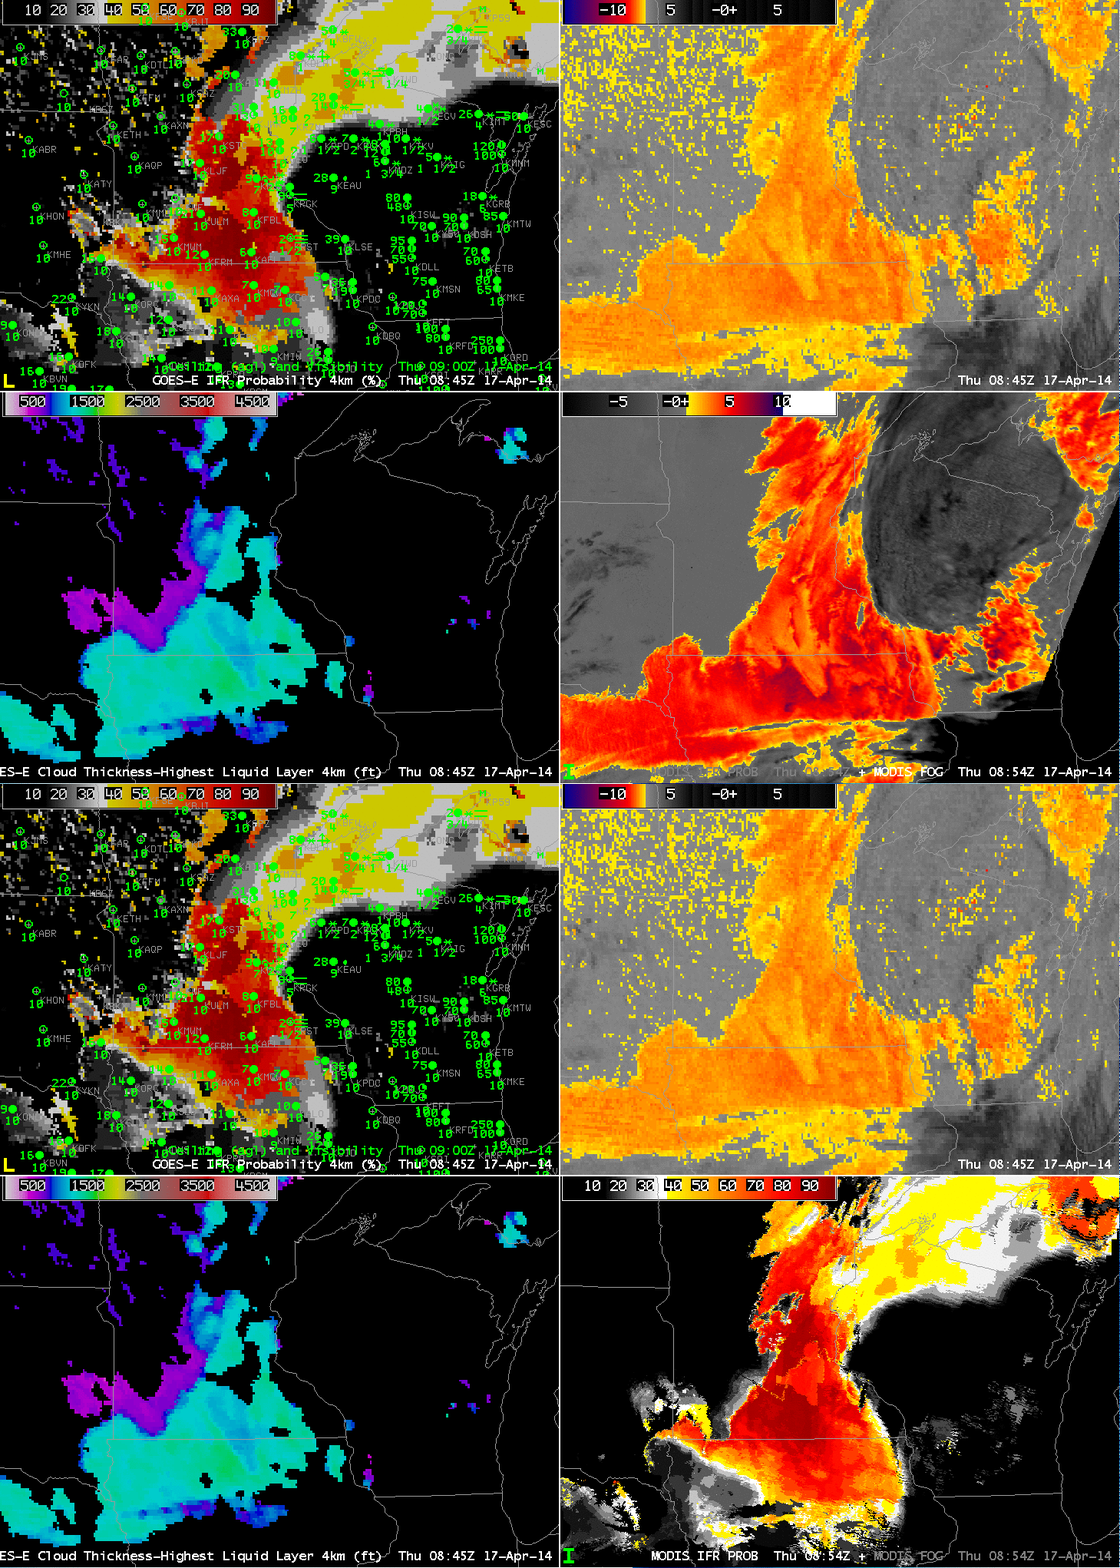
A late-season snowstorm moved through the upper midwest on the 16th/17th of April, dropping up to 18″ of snow over northern Minnesota and northern Wisconsin. The storm and its aftermath produced IFR conditions; how did the GOES-R IFR Probability field do?

MODIS_FOG_IFR_PROB_20140417_0442

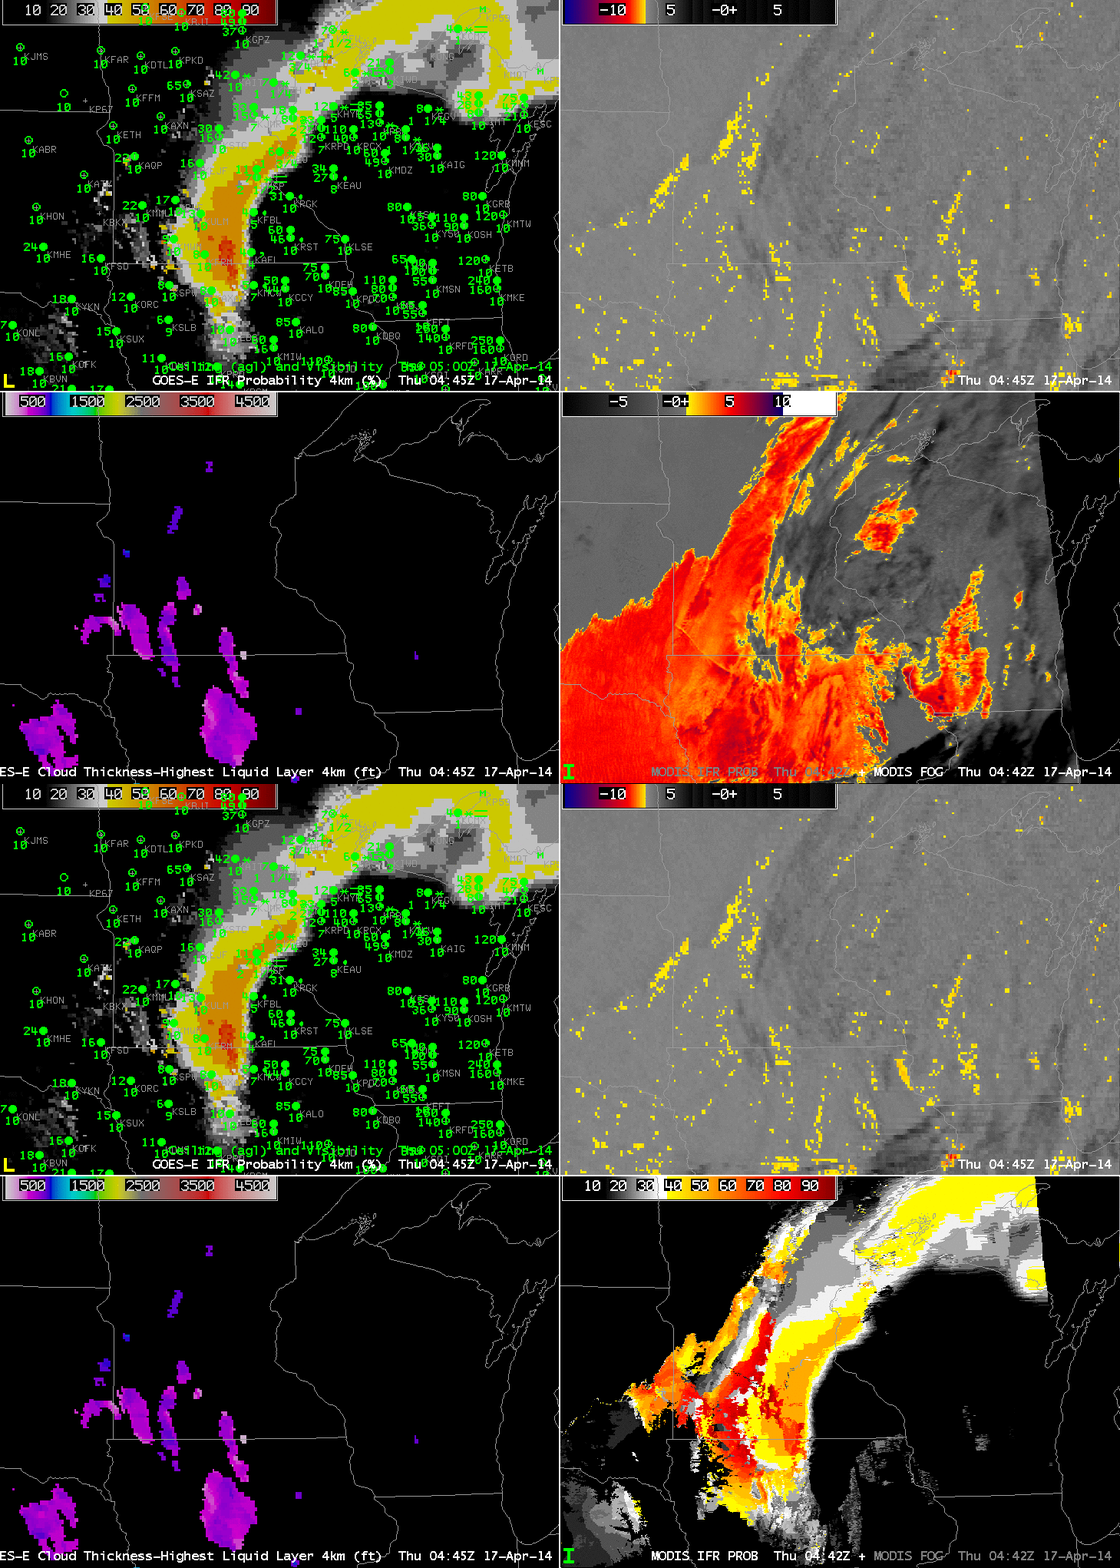
GOES-R IFR Probabilities computed from GOES-East (Upper Left), GOES-East Brightness Temperature Differences (10.7 µm – 3.9 µm) (Upper Right), GOES-R Cloud Thickness (Lower Left), Toggle between GOES-R IFR Probabilities computed from MODIS and MODIS Brightness Temperature Difference Fields (Lower Right), times as indicated (click to enlarge)

The toggle above shows data from ~0445 UTC on 17 April. The MODIS Brightness Temperature Difference field suggests stratus over a large region where IFR conditions are not observed; the IFR Probability fields better approximate the regions of low ceilings/reduced visibilities. The inclusion of Rapid Refresh model data better defines regions of low-level saturation so that the IFR Probability Fields (compared to the brightness temperature difference fields) are better aligned with low ceilings/reduced visibilities. Imagery at ~0900 UTC, below, shows an expansion of the IFR conditions over southern Minnesota as the storm moves away. Note also how IFR Probabiilties are enhanced over northern Wisconsin, where multiple cloud layers make the traditional fog/low cloud detection mechanism, the brightness temperature difference field, difficult. Probabilities are smaller there because the satellite predictors cannot be used in the algorithm that computes IFR Probabilities, and the variability of the values is less, reflecting the smoother fields present in the model (compared to the pixels of the satellite data).

MODIS_FOG_IFR_PROB_20140417_0854

GOES-R IFR Probabilities computed from GOES-East (Upper Left), GOES-East Brightness Temperature Differences (10.7 µm – 3.9 µm) (Upper Right), GOES-R Cloud Thickness (Lower Left), Toggle between GOES-R IFR Probabilities computed from MODIS and MODIS Brightness Temperature Difference Fields (Lower Right), times as indicated (click to enlarge)

Stratus vs. Fog in the upper Midwest

GOES_IFR_PROB_20140320_0202

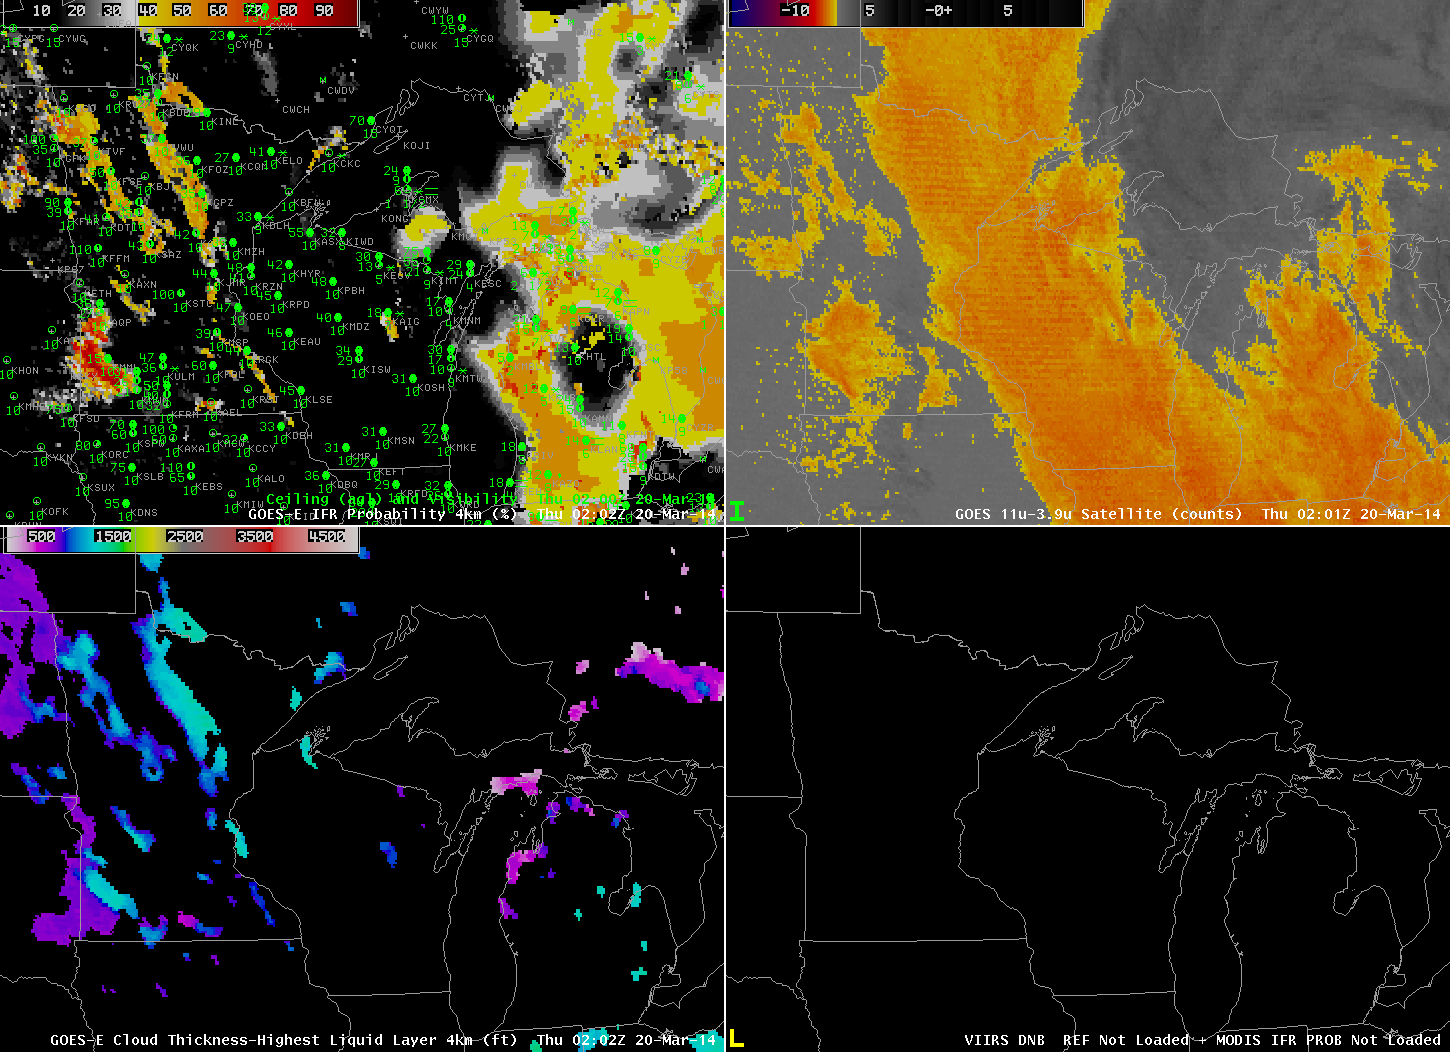
GOES-R IFR Probabilities computed from GOES-13 (Upper Left), GOES-East Brightness Temperature Differences (10.7 µm – 3.9 µm) (Upper Right), GOES-R Cloud Thickness (Lower Left), Suomi-NPP Brightness Temperature (Lower Right), all near 0200 UTC on 20 March 2014 (click to enlarge)

Low clouds lingered over the upper midwest behind a departing low pressure system late on Wednesday the 19th. A strong signal was evident in the brightness temperature difference field from GOES-East, above, from 0200 UTC, extending northwest to southeast over eastern Minnesota into northern Indiana. Note, however, that ceilings in this region were indicative of mid-level stratus rather than fog. IFR Probabilities are correctly very small underneath this stratus.

GOES_IFR_PROB_20140320loop

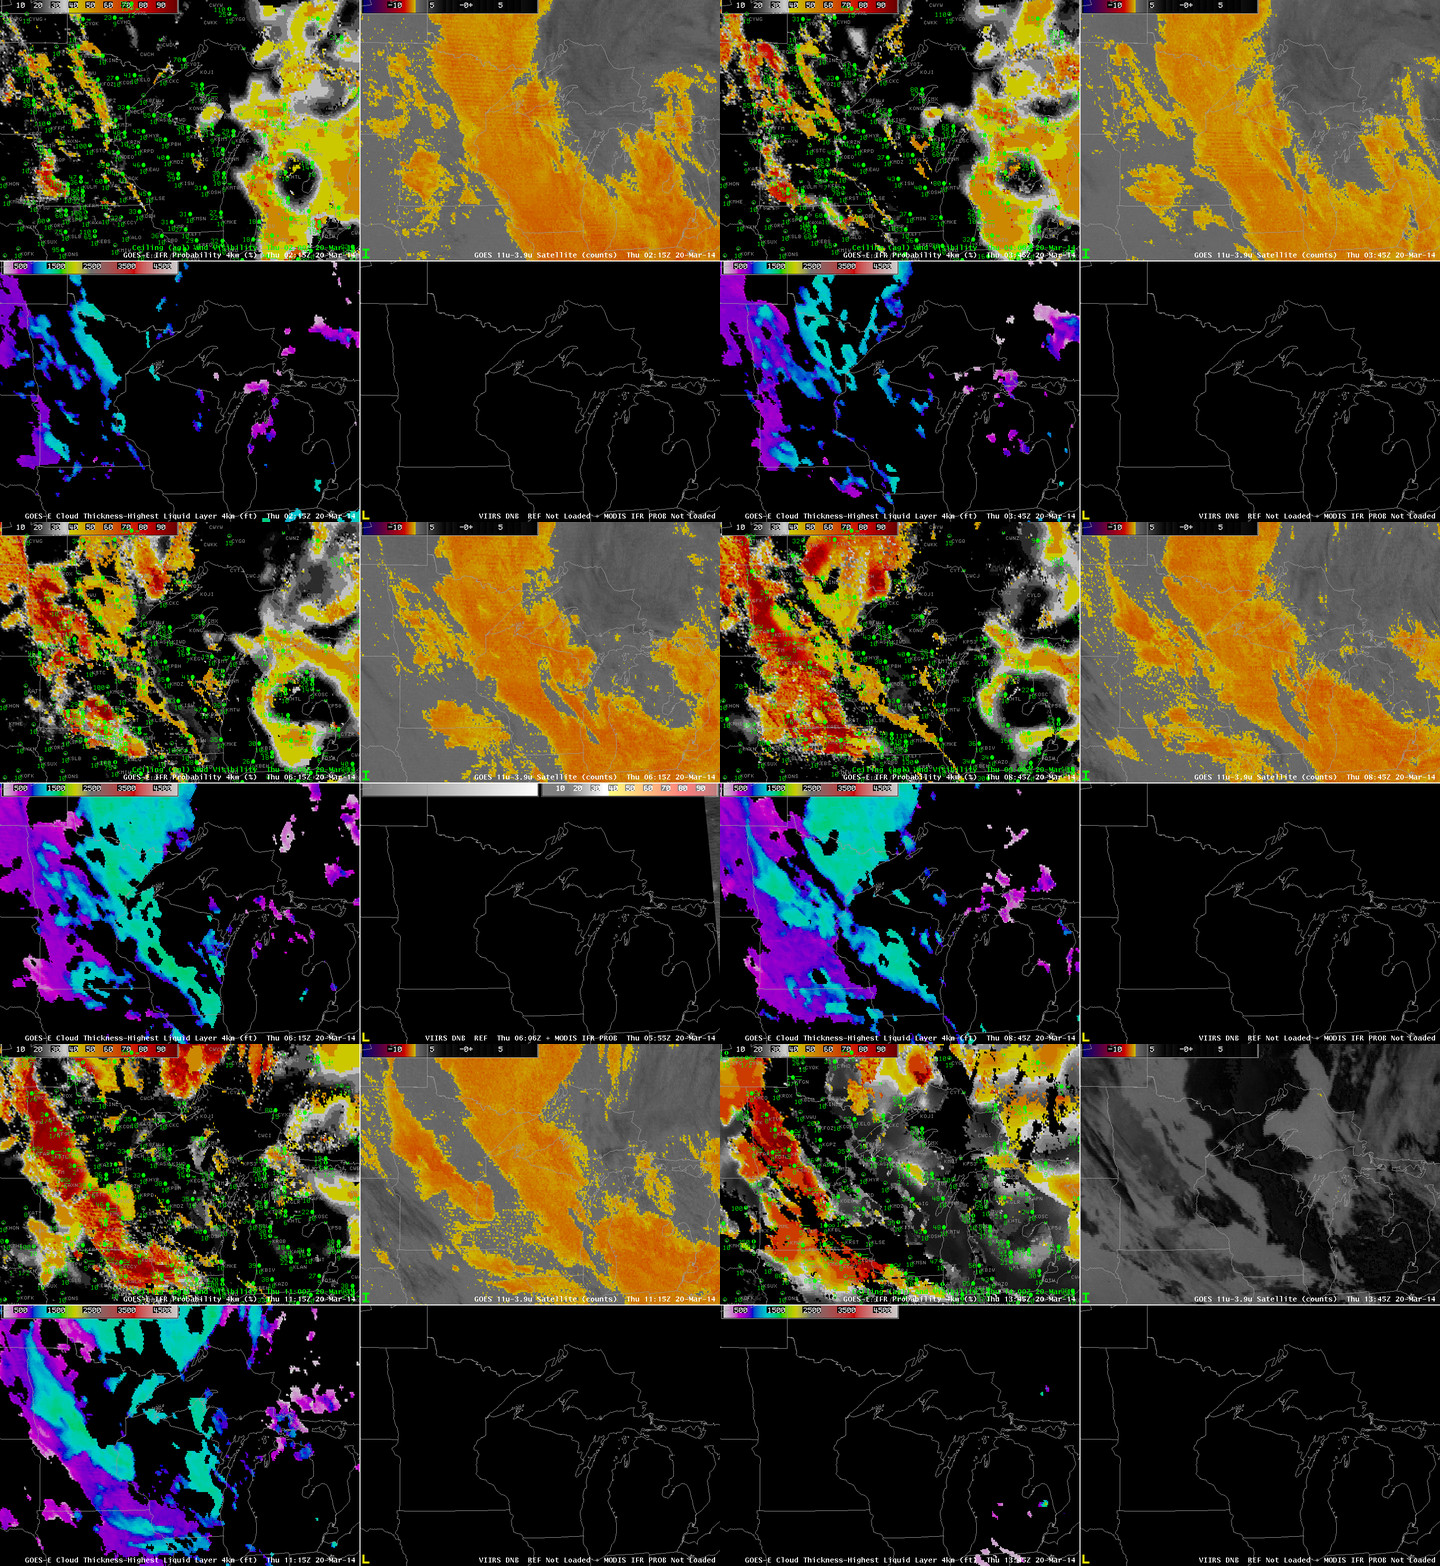
GOES-R IFR Probabilities computed from GOES-13 (Upper Left), GOES-East Brightness Temperature Differences (10.7 µm – 3.9 µm) (Upper Right), GOES-R Cloud Thickness (Lower Left), MODIS-based IFR Probabilities and Suomi-NPP Day/Night Band (Lower Right), times as indicated (click to enlarge)

An animation of the fields, above, shows the development of a low IFR conditions over western Minnesota. The brightness temperature difference fields also show their development, and the combination of satellite predictors and model predictors lead to very high IFR Probabilities in that region, both in the GOES-based fields, shown half-hourly, and in the MODIS-based fields, shown when available.

GOESVIIRS_FOG_20140320_0745

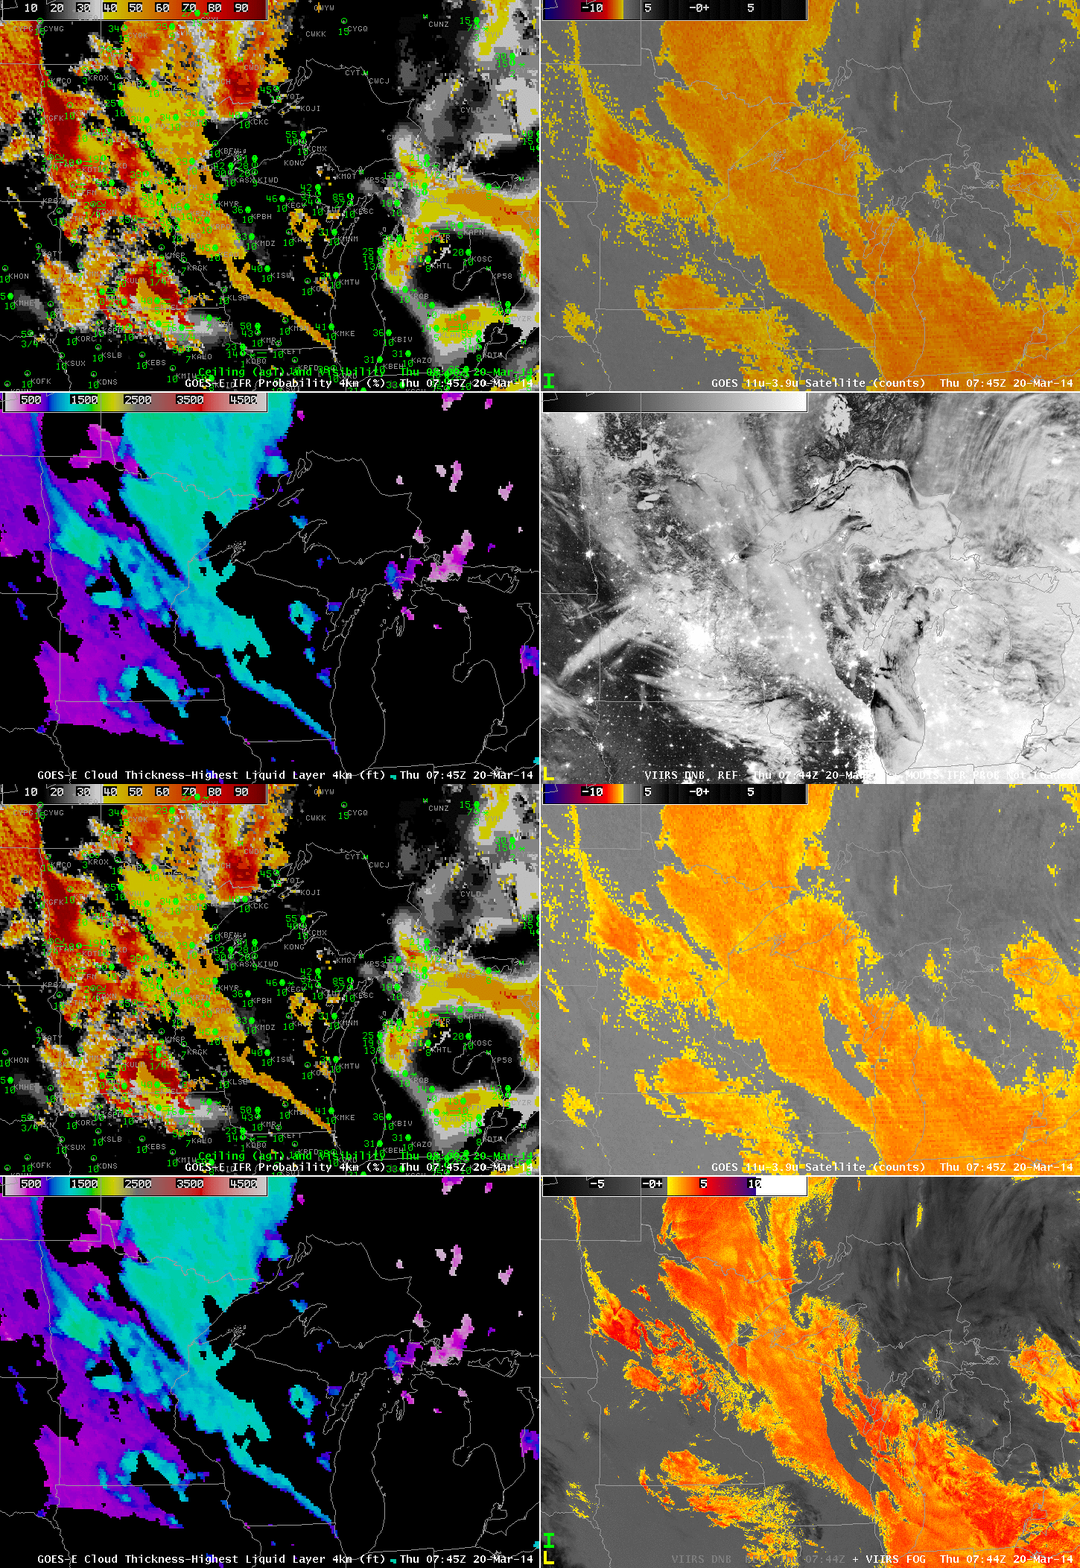
Suomi/NPP Day/Night band and brightness temperature difference field, 0744 UTC on 20 March 2014 (click to enlarge)

The near-full Moon provided ample illumination for the clouds, and the day/night band reveals the extensive cloud cover over the upper midwest, but as it only shows the top of the clouds, it is difficult to determine if visibility restrictions are also present. The Brightness temperature difference produce is also shown, which field is helpful in screening out snow cover and city lights.

Widespread Advection Fog over the Midwest

GOES_IFR_PROB_20140110loop

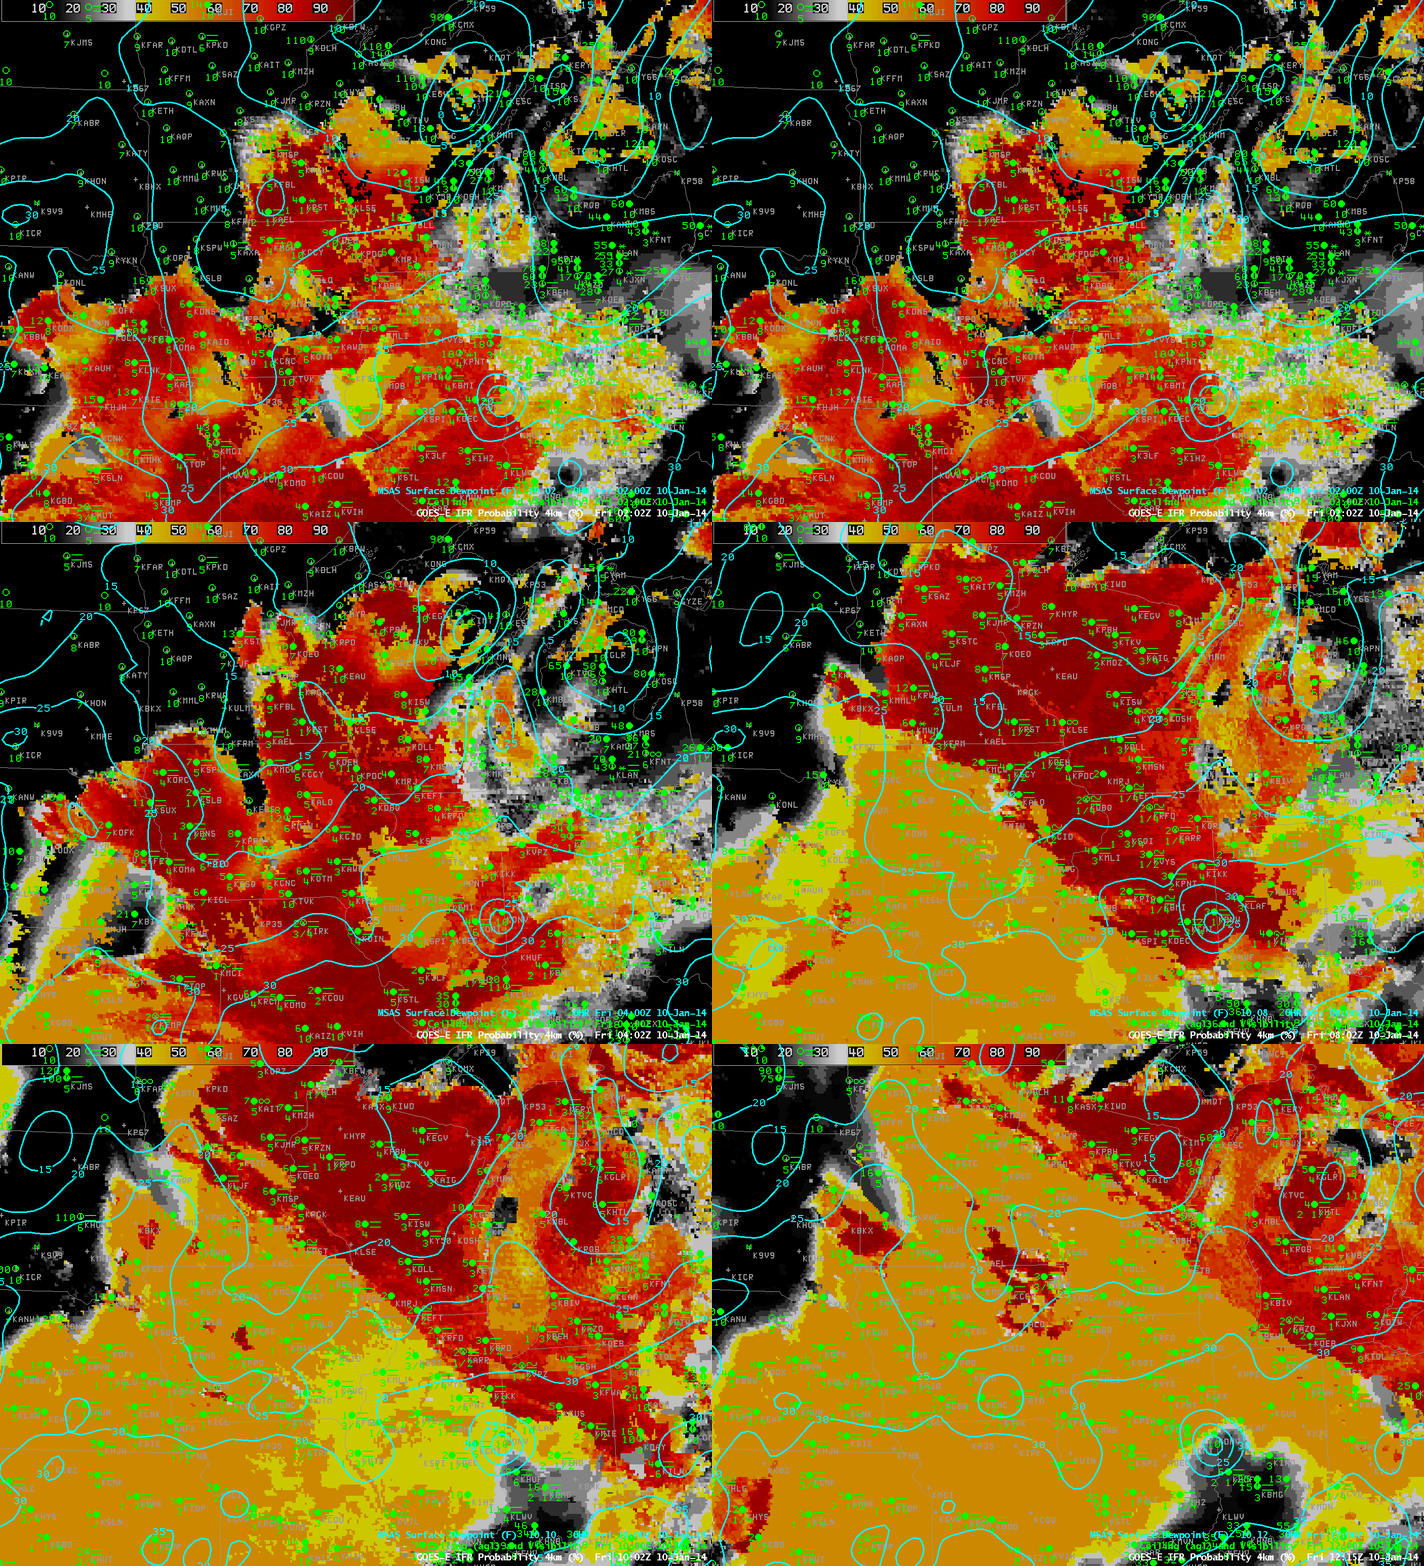
GOES-East IFR Probabilities and surface plots of visibilities/ceilings and surface analysis of dewpoint at 0202, 0402, 0615, 0802, 1002 and 1215 UTC on 10 January 2014 (click image to enlarge)

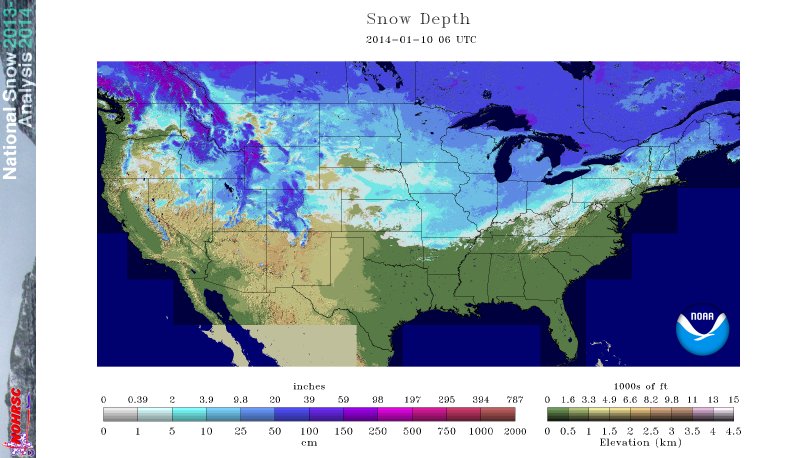
The northward movement of moist air over a snow-covered surface allowed for widespread advection fog in the midwest overnight from January 9th to 10th. The animation, above, shows GOES-R IFR Probabilities at 2-hour time steps. Included in the plots are surface observations and cloud ceilings (documenting the widespread region of IFR conditions) and the RTMA Dewpoint analysis that shows the slow northward movement of dewpoints at the surface. As this moist air moves over the cold snow-covered surface (the snow analysis from the National Operational Hydrological Remote Sensing Center is below), advection fog is a result. The GOES-R IFR Probability fields do a fine job of outlining where the IFR conditions are observed.

nsm_depth_2014011005_National

Analysis of snow depth from NOHRSC, 0600 UTC, 10 January 2014 (click image to enlarge)

Note in the animation above how the presence of higher clouds moving up from the southwest affects the IFR Probability fields. As high clouds overspread the advection fog, satellite data can no longer be incorporated into the GOES-R IFR probability algorithm, and IFR Probabilities drop, in this case from values near 90% to values near 55%.

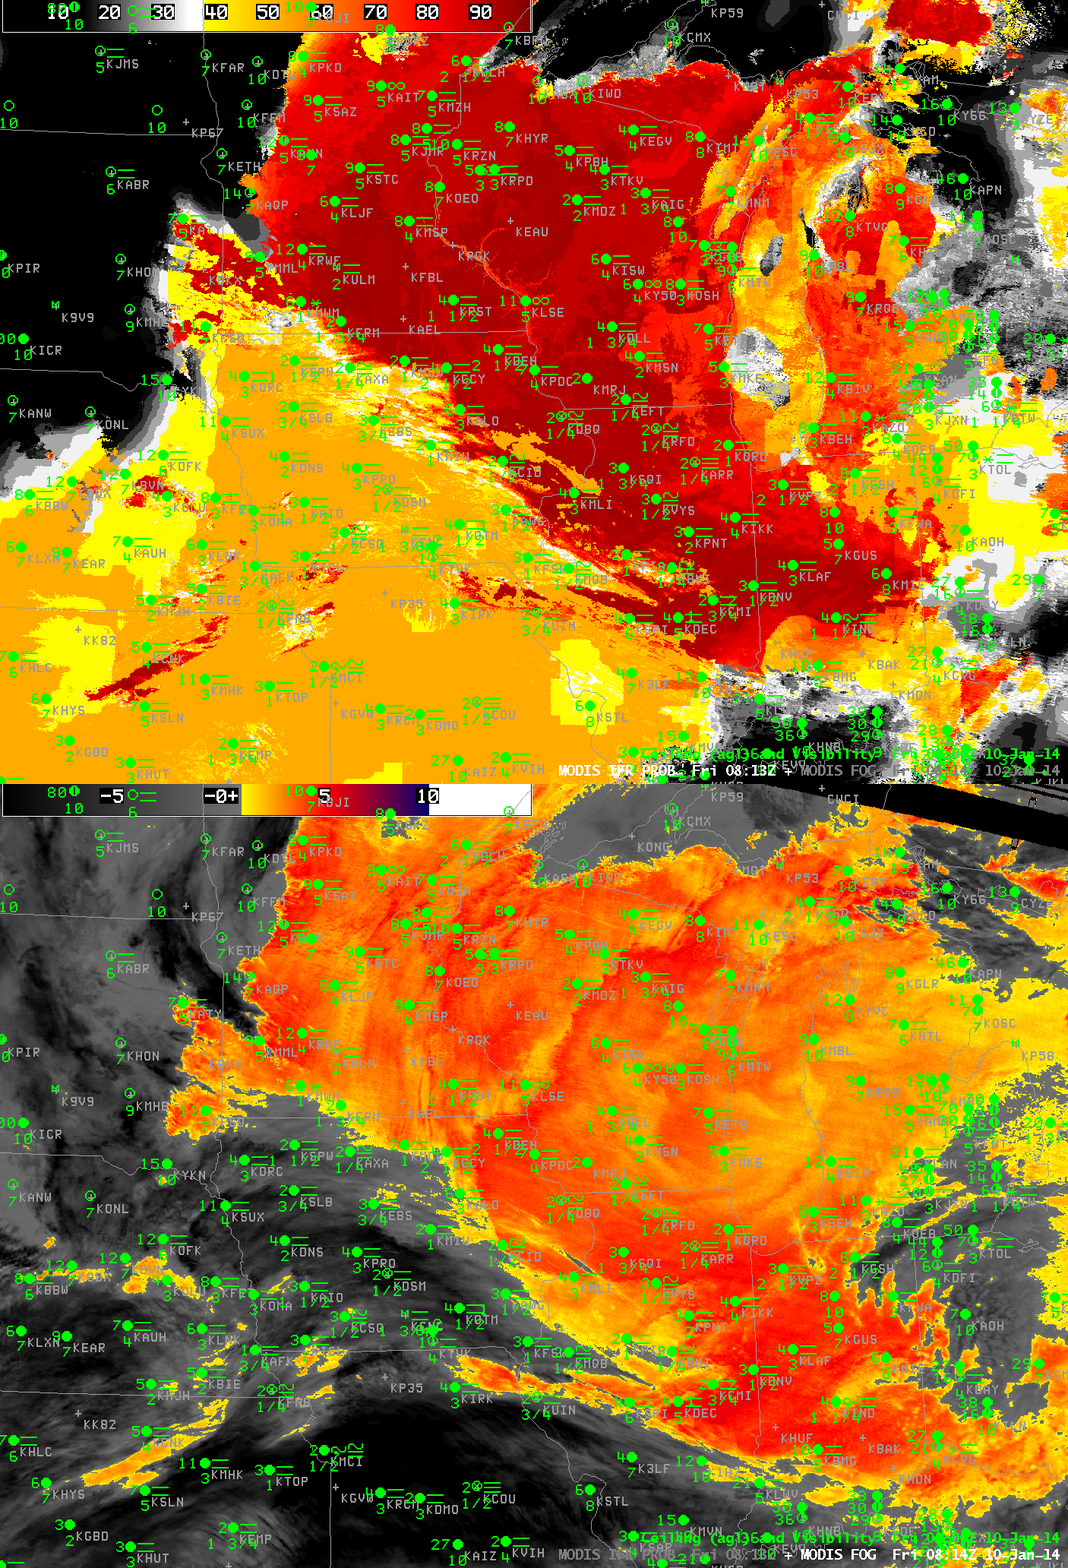
Polar-orbiting data can also give information about low clouds and fog. Temporal resolution is far superior to geostationary, as shown below. In cases of small-scale fog, polar orbiter data can give important information by identifying the first region of a developing fog. In large-scale cases such as this, high-resolution data can better identify edges to the fields. The MODIS data in this case does show high probabilities over the midwest; the brightness temperature difference field shows evidence of high clouds from central Iowa southwestward. As with the GOES data, the presence of high clouds results in lower IFR Probabilities.

MODIS_FOG_IFR_20140110_0814

Toggle between MODIS-based IFR Probabilities and Brightness Temperature Difference at 0814 UTC 10 January 2014 (click image to enlarge)

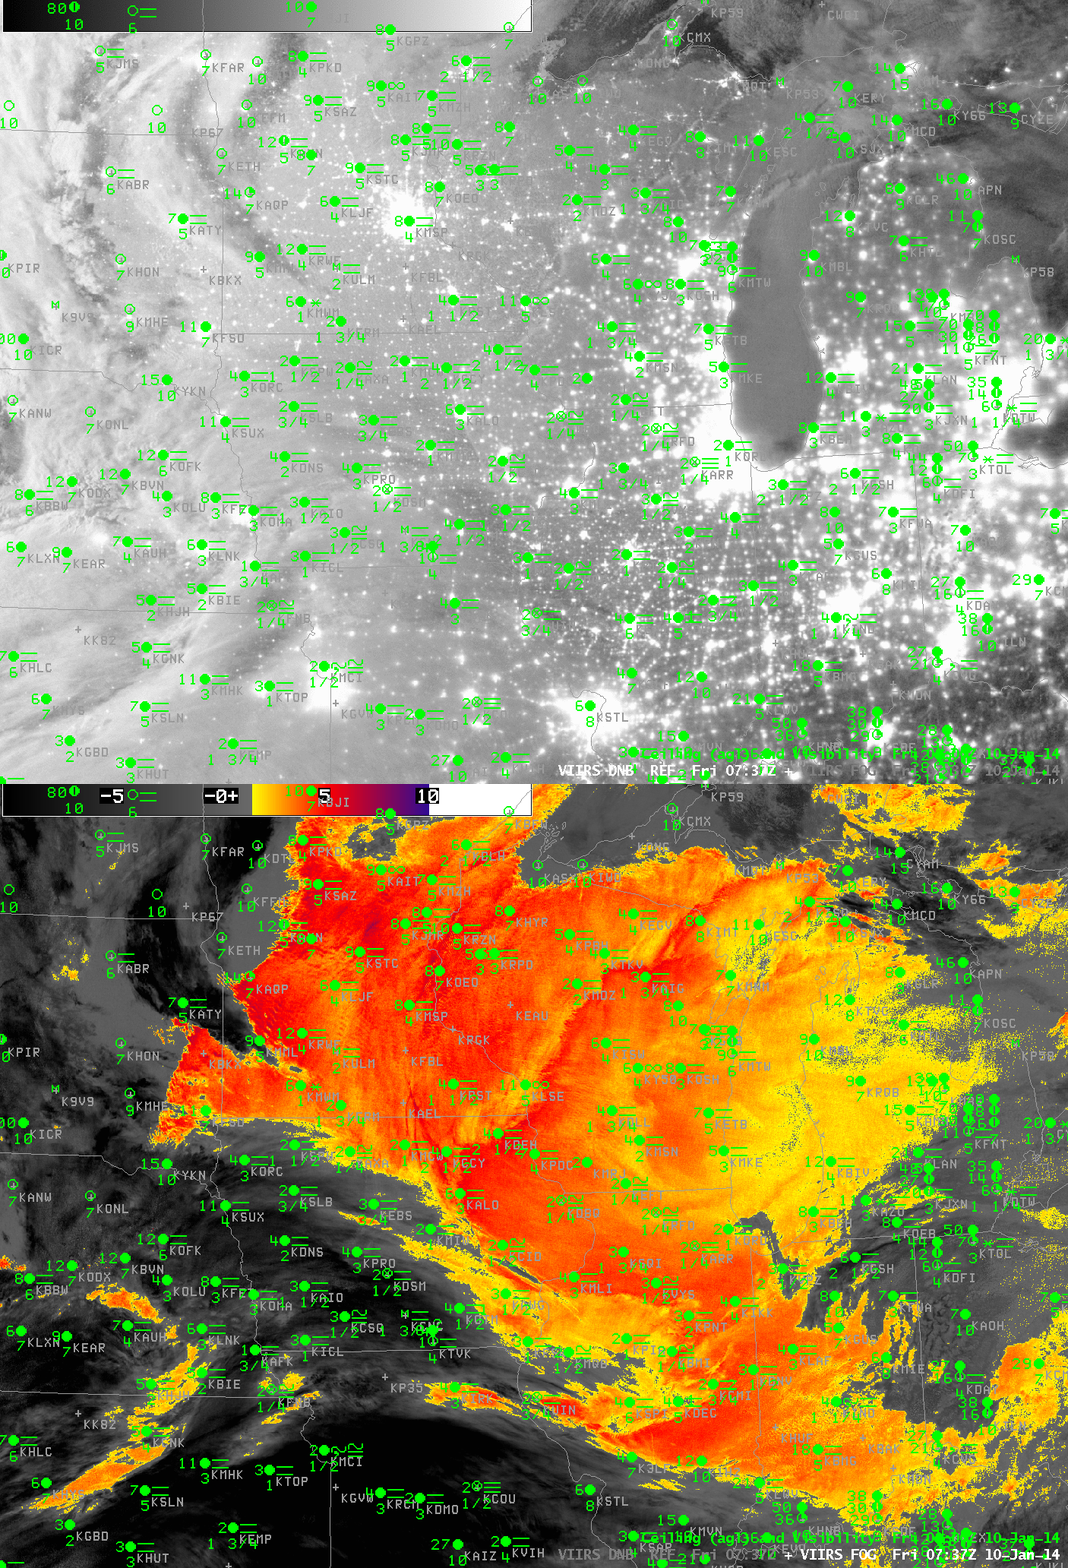
Suomi/NPP data, below, from the Day/Night band shows widespread cloudiness over the midwest. The clouds are illuminated by the moon, nearly full, setting at this time in the west. Shadows are being cast by high clouds on the lower clouds over western Minnesota. The brightness temperature difference fields from Suomi/NPP are very similar to the MODIS data. In contrast to MODIS, the VIIRS instrument does not have a water vapor sensor, so the IFR Probability algorithms are not directly transferable to Suomi/NPP VIIRS data.

VIIRS_FOG_DNB_20140110_0737

Toggle between Suomi/NPP Day/Night band and Brightness Temperature Difference at 0737 UTC 10 January 2014 (click image to enlarge)

Fog over snow in the upper midwest

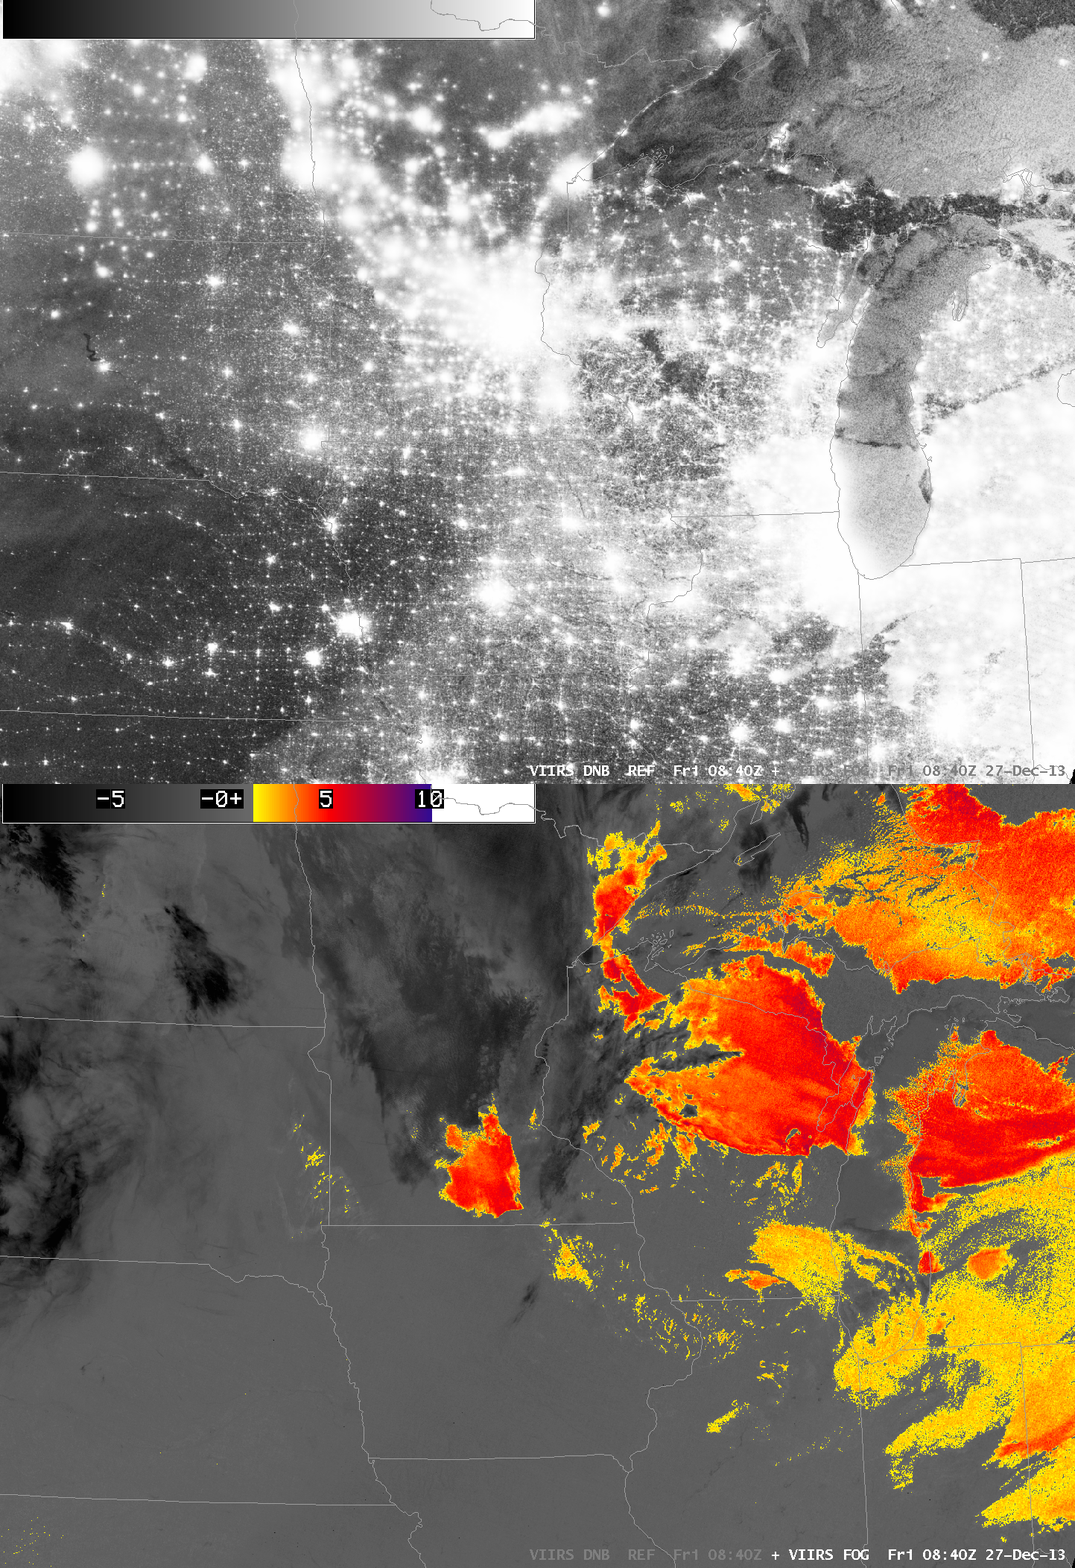
VIIRS_DNB_FOG_20131227_0840

Suomi/NPP Brightness Temperature Difference (11.35 µm – 3.74 µm) Brightness Temperature Difference and Day/Night Band, 0840 UTC 27 December 2013 (click image to enlarge)

At times of low lunar illumination, it can become increasingly difficult to discern regions of clouds and snow in the Suomi/NPP day/night band, shown above, toggling with the brightness temperature difference. Nevertheless, careful perusal of the image reveals cloud edges over northeastern Wisconsin and through central lower Michigan that are confirmed by the brightness temperature difference field. In contrast, the whiter region that stretches southwestward from Des Moines towards extreme northeastern Kansas has no signal in the brightness temperature difference field. This is snow on the ground (vs. little snow to the northwest).

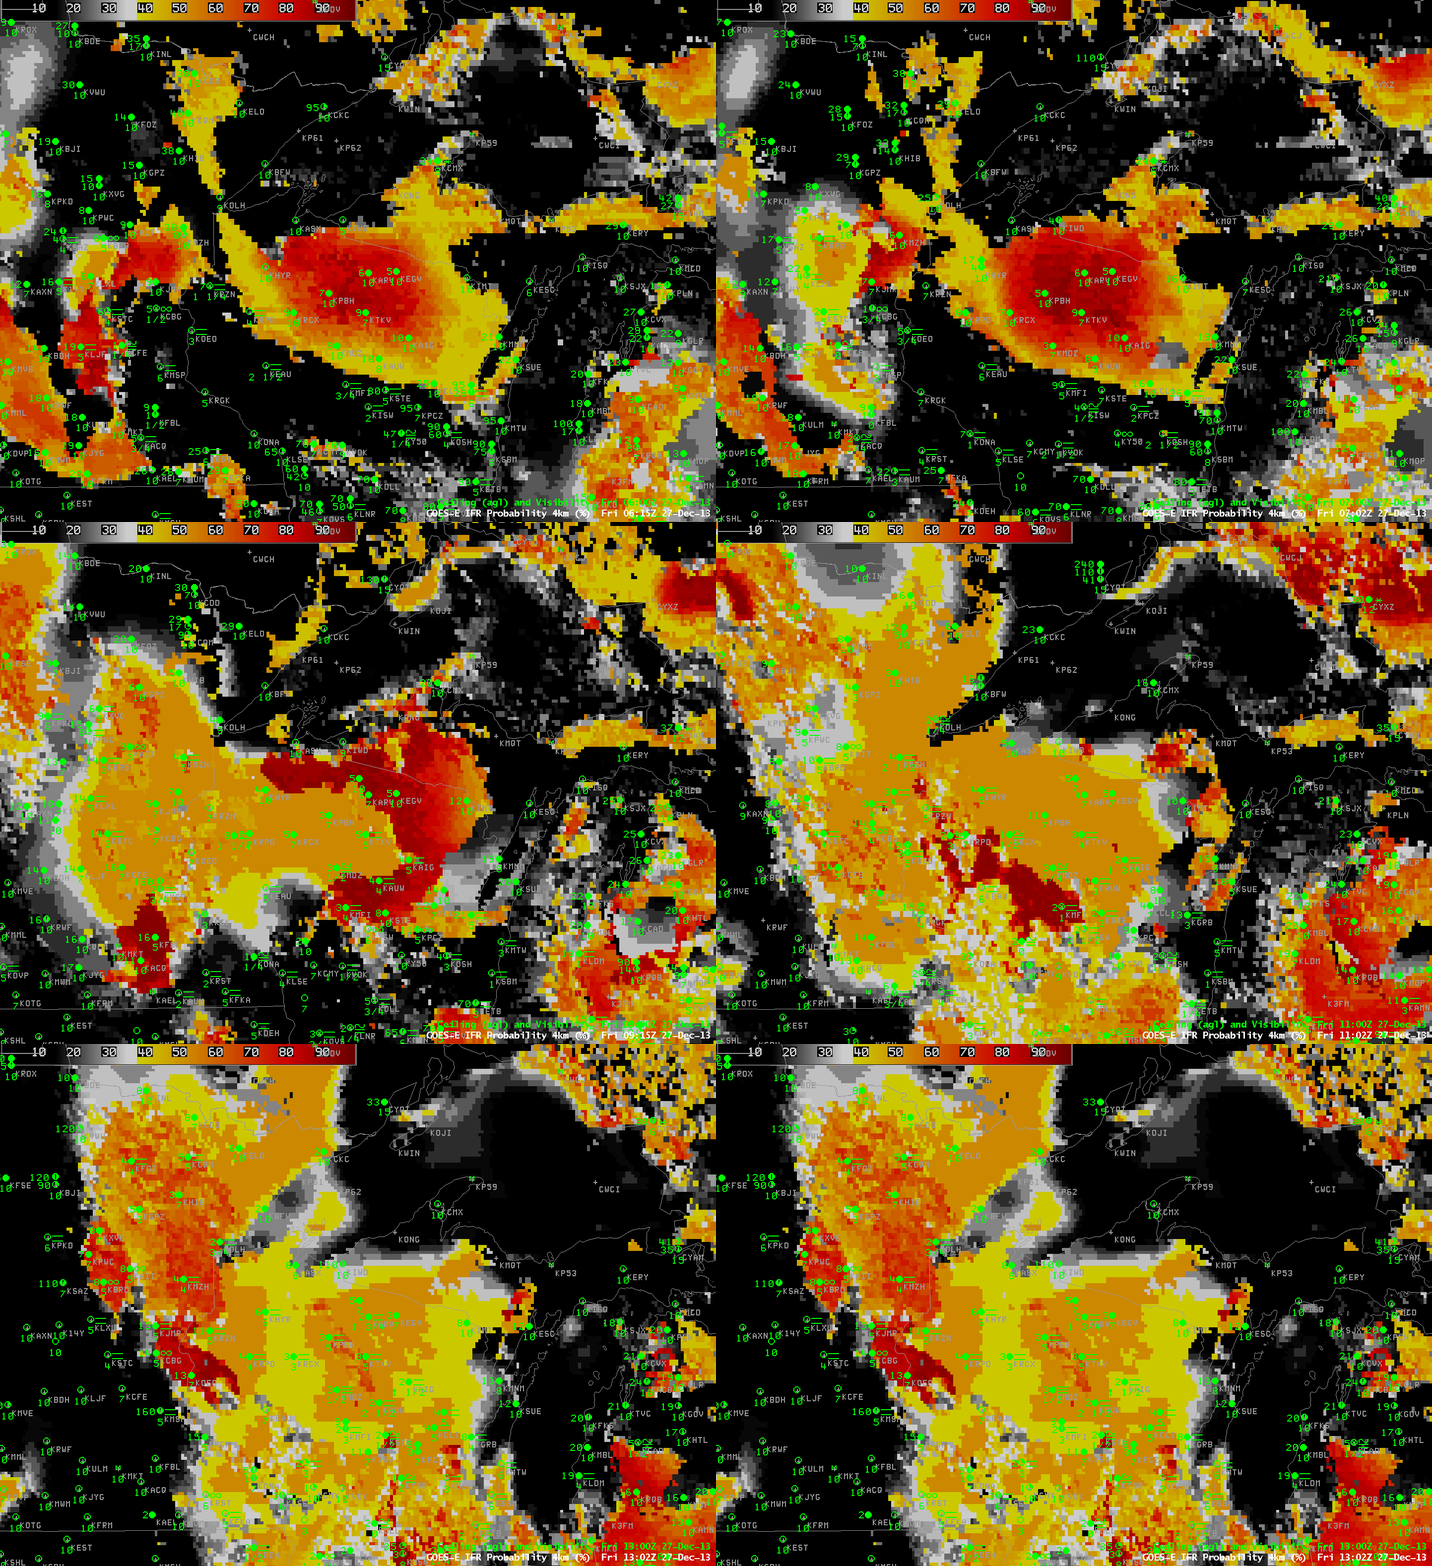
GOES_IFR_PROB_20131227loop

GOES IFR Probabilities computed with GOES-13 data, hourly from 0615 UTC through 1302 UTC, 27 December 2013 (click image to enlarge)

IFR Probability fields and GOES-Based brightness temperature difference fields are produced to aid in the detection of low clouds. In the animation above, higher IFR probabilities are centered on north-central Wisconsin where, intially, IFR conditions are not quite met (according to the plotted observations of ceiling and visibilities). However, as the night progresses, ceilings lower and visibilities decrease as IFR conditions do develop in regions where IFR Probabilities are high. The IFR probabilities roughly overlap the region where IFR conditions exist.

Note that encroachment of higher clouds in from the west, starting around 0800 UTC, means that satellite data cannot be used in the IFR Probability algorithm. Because only model data are used, IFR probabilities drop from values at/above 80% to values between 50 and 60% even as IFR conditions come to be more widespread. For this reason, it is important when interpreting IFR Probabilities to be alert to the presence of high clouds.

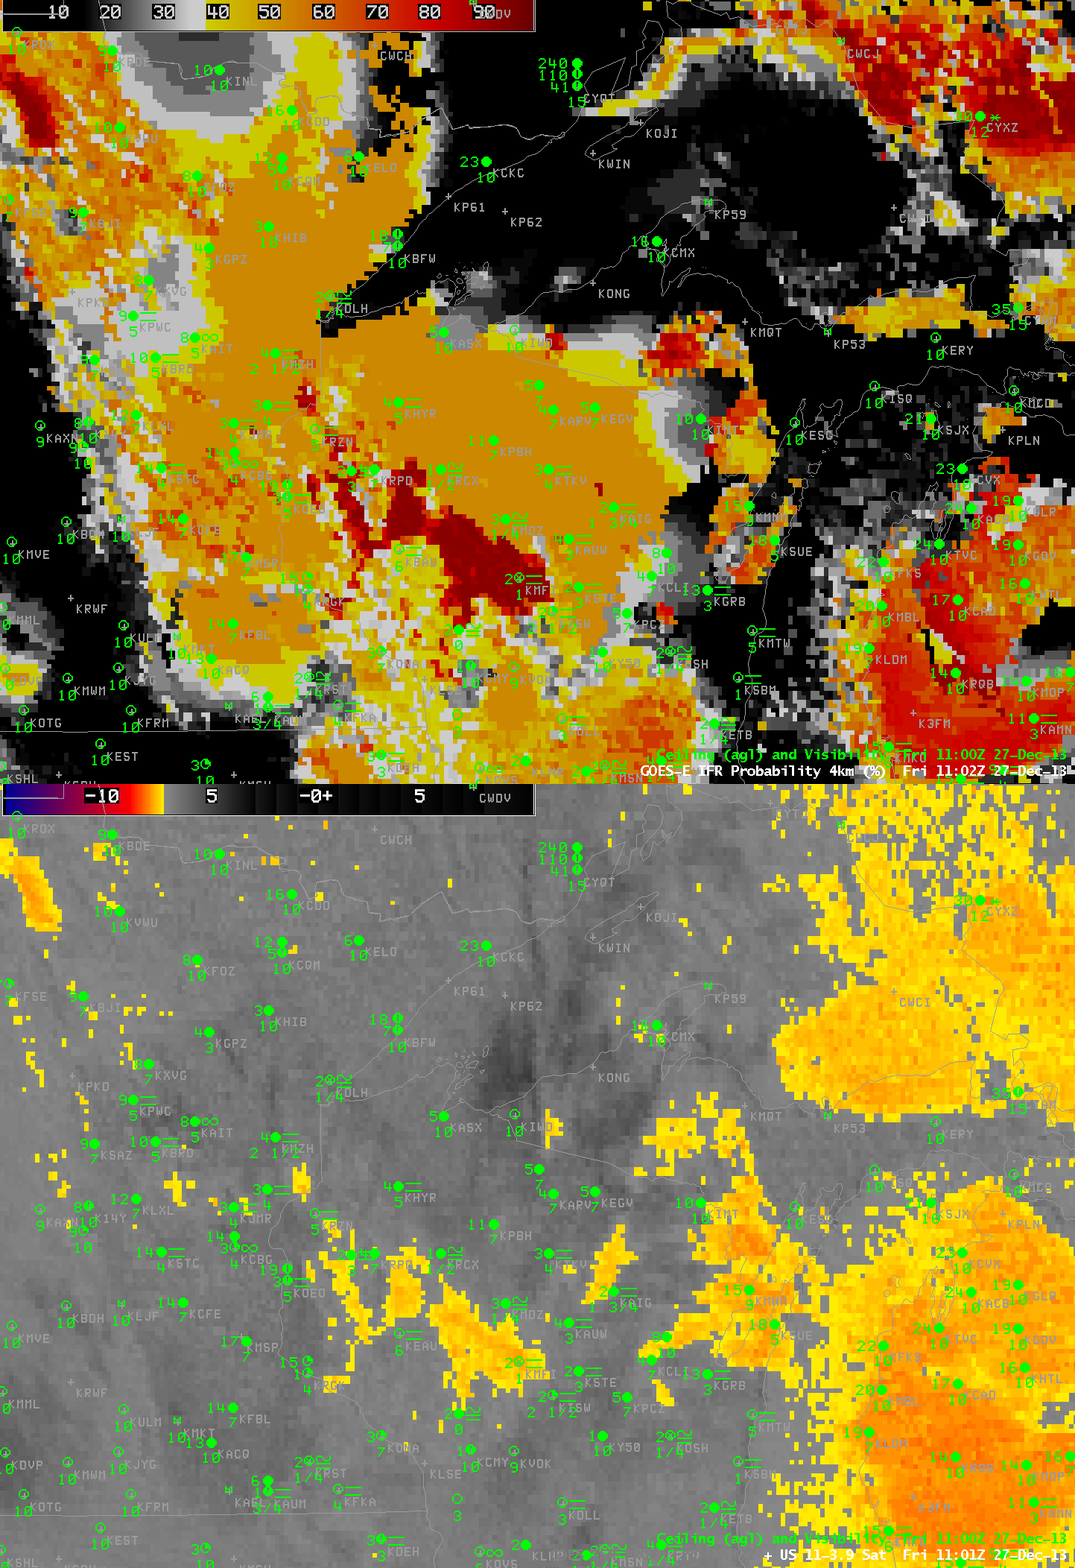
IFR Probabilities give a much more better approximation of where fog/low stratus may be occurring than a simple brightness temperature difference field. The toggle between the GOES-R IFR Probabilities and the GOES-13 Brightness Temperature Difference, below, gives testimony to this.

GOES_IFR_PROB_US_11-3.9_Sat_20131227_11toggle

Advection Fog over the Upper Midwest

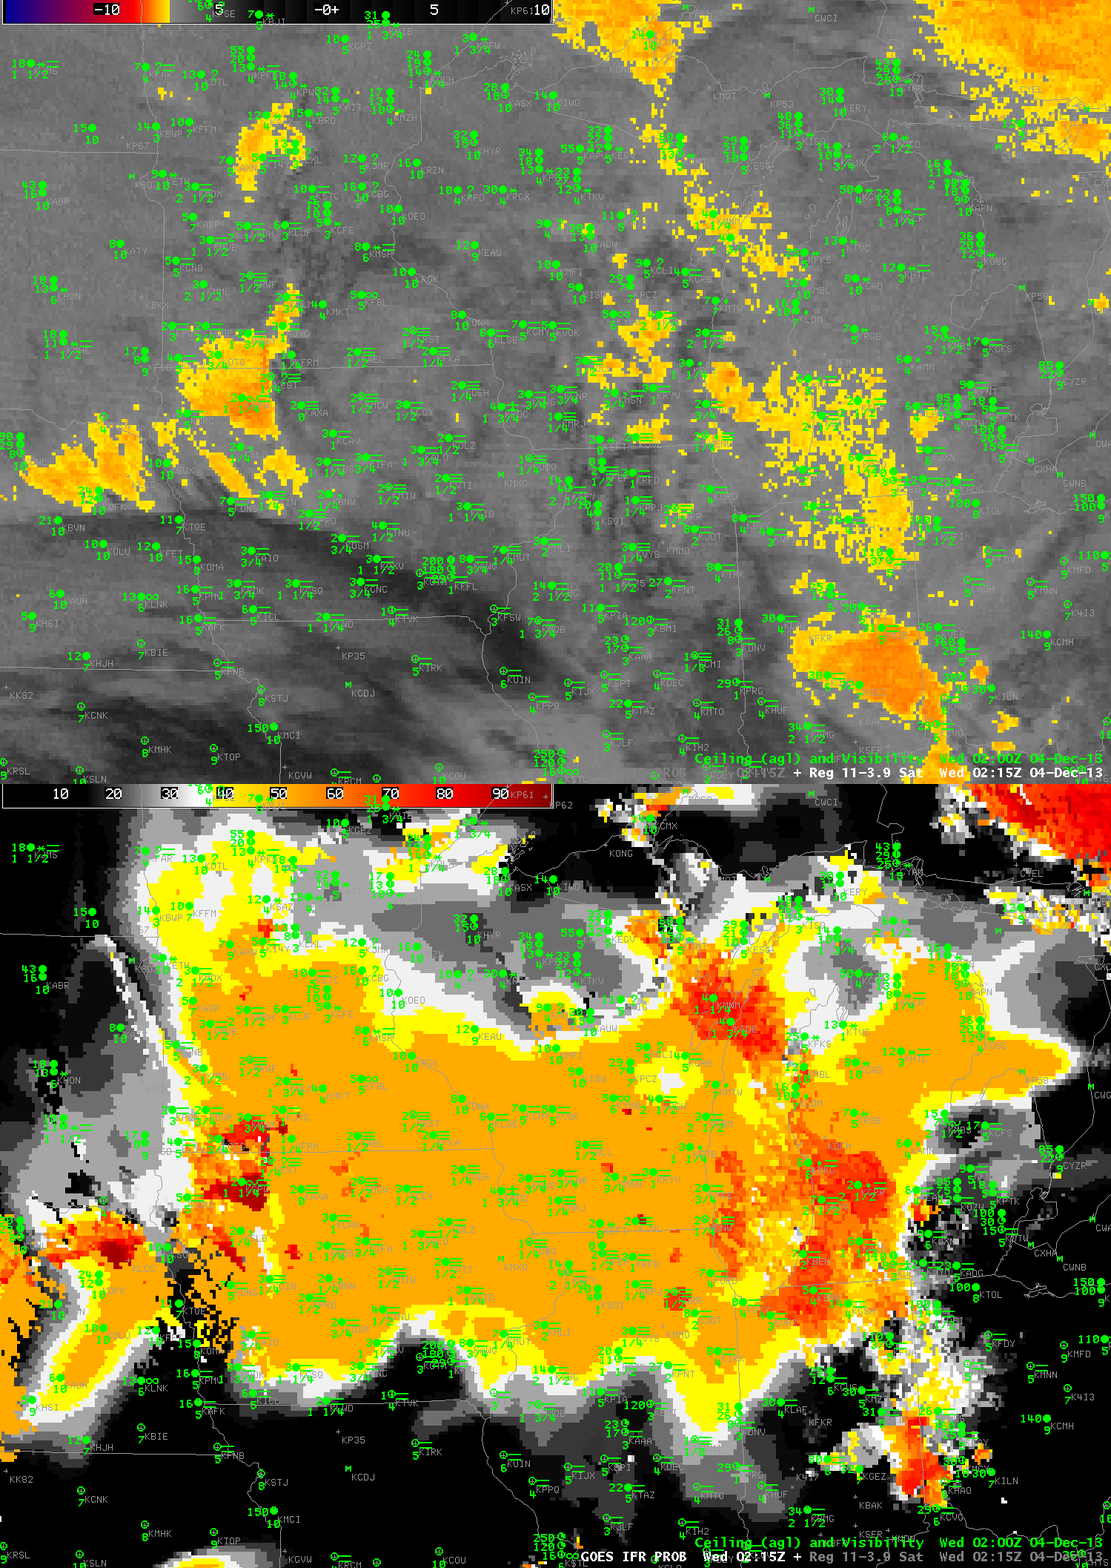
GOES_BTD_IFR_PROB_20131204_0215

Toggle between nighttime GOES-R IFR Probabilities from GOES-13 and GOES-13 Brightness Temperature Differences (10.7 µm – 3.9 µm) at 0215 UTC on 4 December 2013 (click image to enlarge)

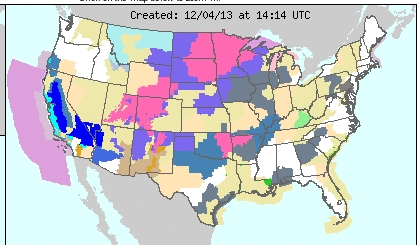
Dense advection fog developed in the upper midwest on Tuesday 3 December 2013 and persisted into December 4th as a Colorado Cyclone moved into central Wisconsin, drawing moist air over cold ground. The IFR Probability Product, a product that fuses together the 3.9 µm pseudo-emissivity (nighttime only) from satellites (a signal similar to the 3.9-11 µm brightness temperature difference field, which gives little information on low clouds in this situation) with model data from the Rapid Refresh (which suggests widespread fog), accurately depicts the large region of advection fog that led to dense fog advisories over parts of Wisconsin and Iowa and surrounding states (see below).

crh_crop

Cropped Screenshot from http://www.crh.noaa.gov at 1414 UTC on 4 December 2013 that shows widespread Dense Fog Advisories over the Upper Midwest

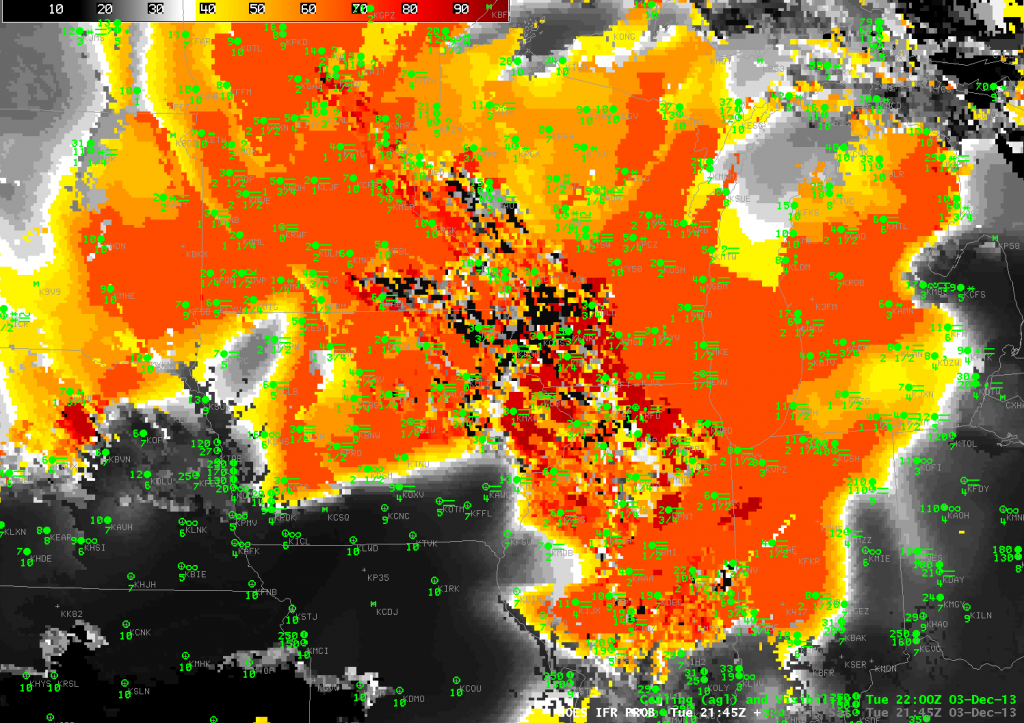
GOES_IFR_PROB_20131203_2145

Daytime GOES-R IFR Probabilities computed from GOES-13, 2145 UTC on 3 December 2013 (click image to enlarge)

The dense fog was present late in the day on December 3rd, 2013, and the IFR Probability fields reflected that. However, in the image above, there are isolated pixels with very low probabilities mixed in with the high probabilities over Wisconsin and surrounding states where advection fog was widespread. Why?

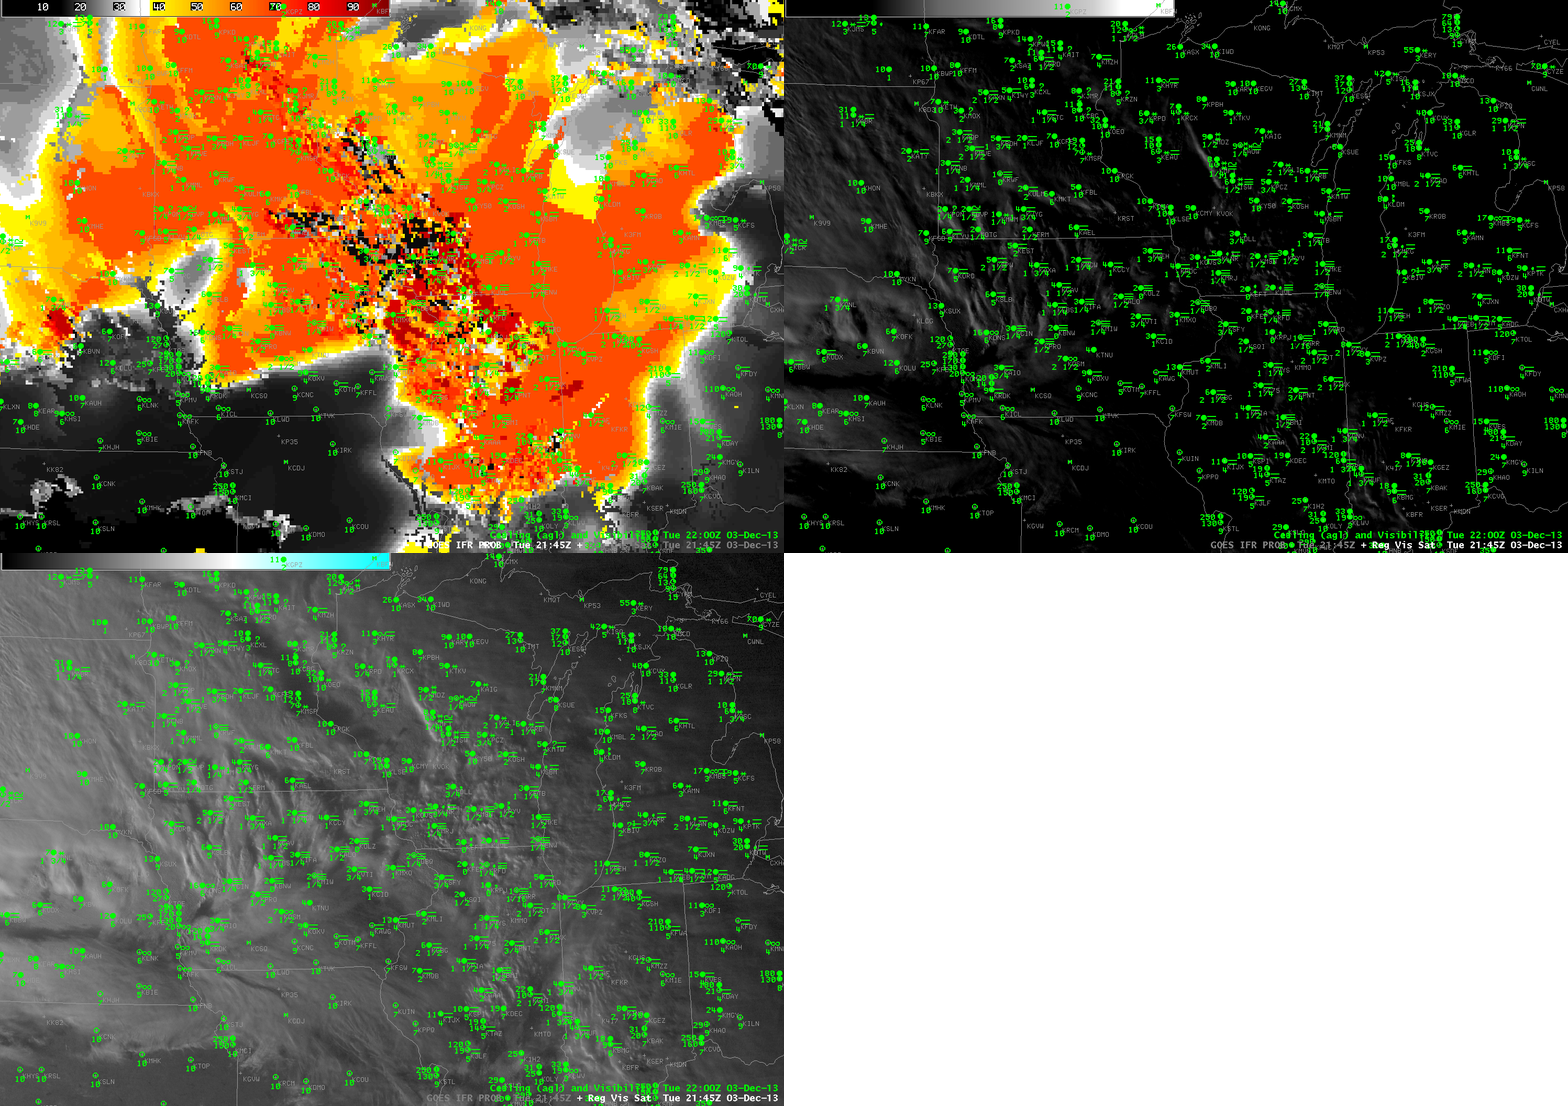
This storm had multiple cloud layers, which can make detection of low cloud difficult from satellite (above) when sun angles are low (sunrise/sunset). The IFR Probability image above is at 3:45 PM local time, and the sun is low in the sky. Deep shadows are being cast and the dark shadowed regions in the visible are misinterpreted by the cloud-clearing algorithm as clear skies. During the day the GOES-R fog/low stratus algorithm relies on the cloud mask to determine where clouds are. Where clear skies are detected (erroneously, in this case), IFR Probabilities are not calculated because fog/low stratus are not expected to be present. Thus, if you see pixelated fields such as the one above, and the sun is low in the sky, this likely means cloud shadows are causing the cloud mask to erroneously return clear sky, which in turn leads to very low IFR probabilities. The animation below cycles through IFR Probability and visible imagery (with a regular enhancement and with a low-light enhancement). After sunset, the cloud shadows are gone and the probability field fills in (as can be seen in the 0215 UTC imagery at the top of this post).

GOES_IFR_PROB_and_Vis_Sat_20131203_2145

Daytime GOES-R IFR Probabilities computed from GOES-13 at 2145 UTC on 3 December 2013 and the corresponding Visible Imagery  (click image to enlarge)

Fog Development near Lake Michigan

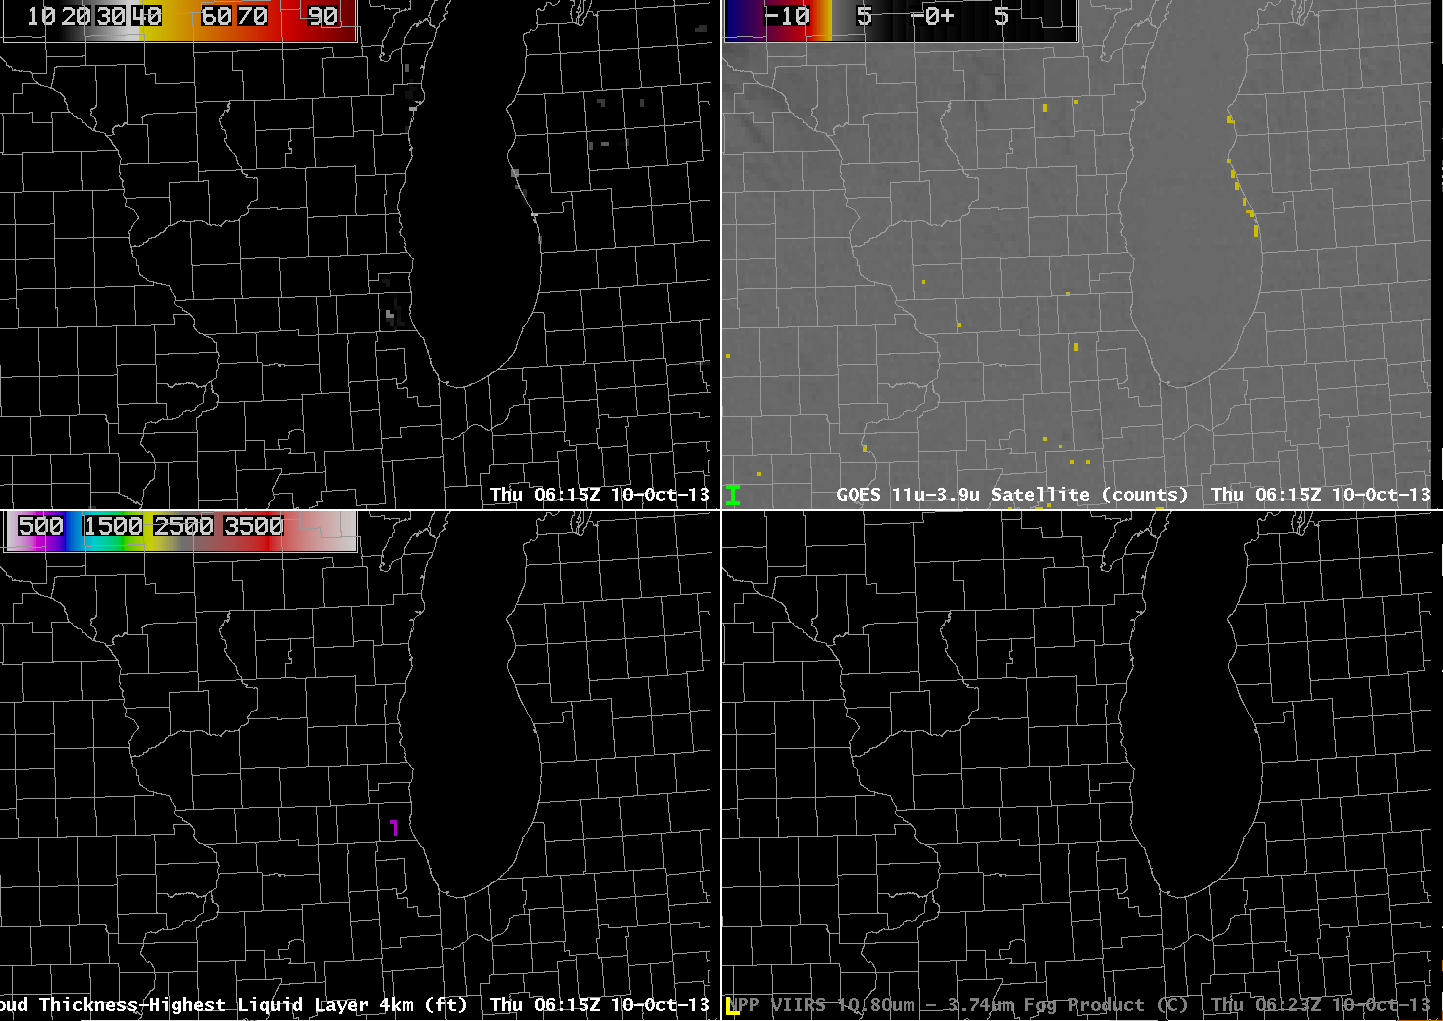
GOES_IFR_PROB_20131010_0615

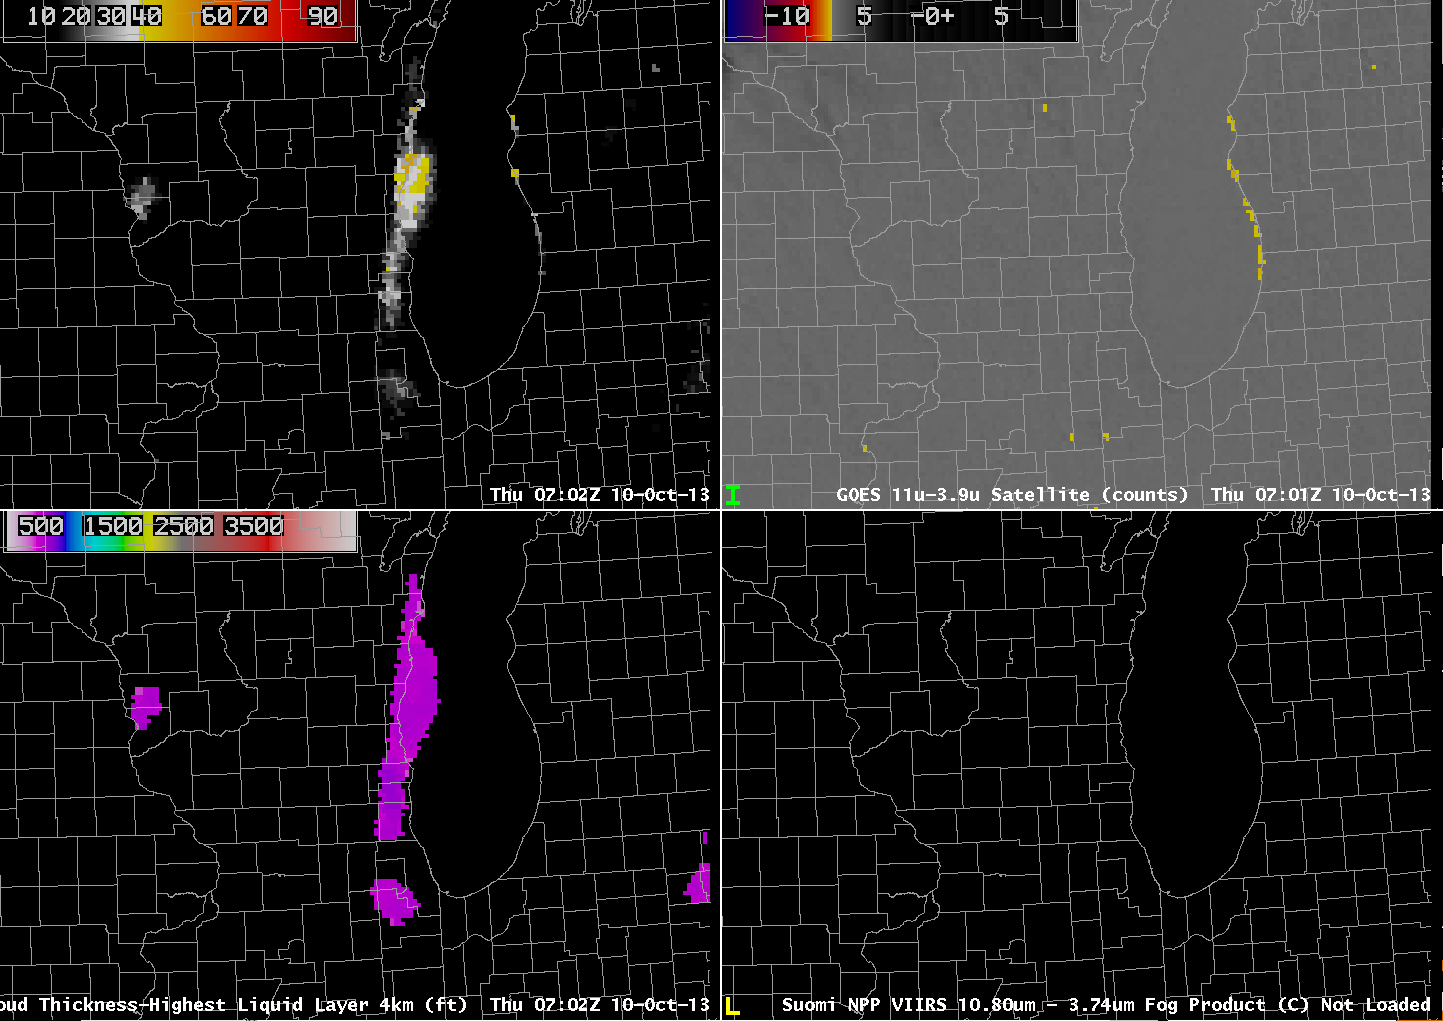
GOES-13-based GOES-R IFR Probabilities (Upper Left), GOES-13 Brightness Temperature Difference Product (10.7 µm – 3.9 µm) (Upper Right), GOES-13-based GOES-R Cloud Thickness (Lower Left), Suomi/NPP Brightness Temperature Difference (Lower Right), all near 0615 UTC on 10 October (click image to enlarge)

The GOES-R IFR Probability product gave useful advance warning to the development of fog near Lake Michigan’s eastern shore overnight. The image above, from 0615 UTC, shows a flat brightness temperature difference field over the lakeshore counties in Wisconsin and Illinois (values are from -7.1 to -7.3); there are two regions of high values in the IFR Probability field, however: Near Manitowoc WI (values up to 29%) and over southeast WI and northeast IL (values near 20%). So by 0615 UTC on 10 October, IFR Probabilities are suggestive of a nascent fog development.

GOES_IFR_PROB_20131010_0702

As above, but for 0702 UTC on 10 October (click image to enlarge)

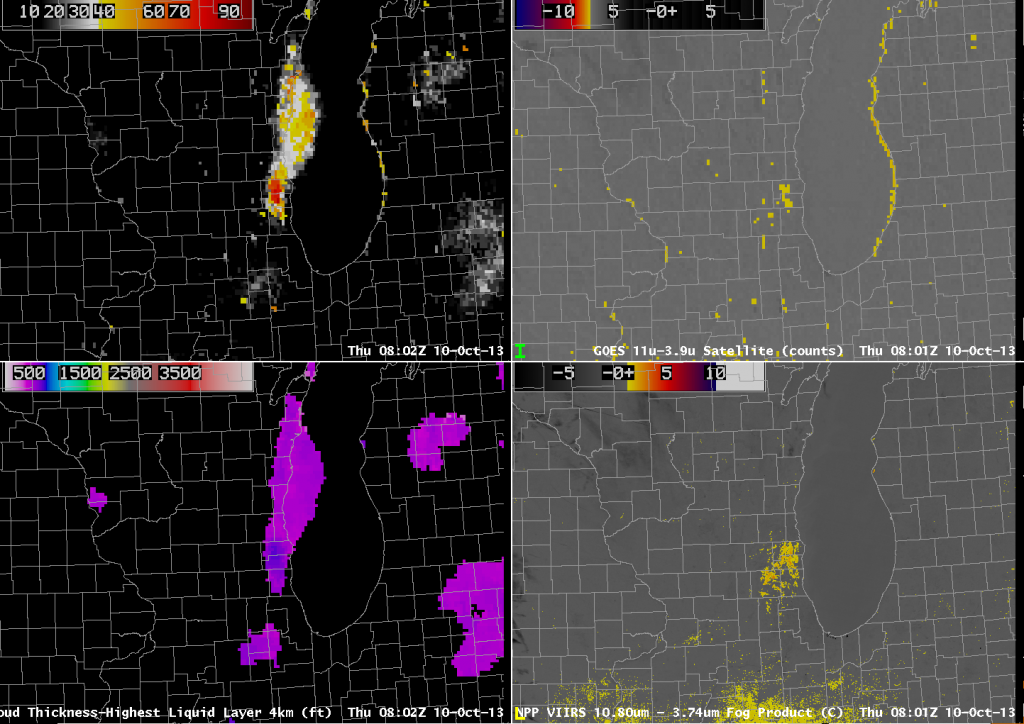
Forty-five minutes later, at 0702 UTC (above), IFR Probabilities have increased dramatically in eastern WI even as the brightness temperature difference field remains flat. Thus, the Rapid Refresh Data is accurately capturing the development of low-level saturation in the atmosphere, and that is influencing the IFR probability field. In addition, the GOES-R Cloud Thickness field is suggesting that the cloud bank is 500-600 feet thick. The strip of enhanced brightness temperature difference paralleling the Lake Michigan shore in lower Michigan is an artifact of the co-registration error between the 10.7 µm and 3.9 µm band detectors on GOES-13. Between 0656 UTC and 0734 UTC, visibility at Manitowoc, WI (KMTW), dropped from 5 to 3/4 statute miles. The visibility at Burlington WI (KBUU) dropped from 4 to 1 statute miles between 0600 and 0700 UTC, and Waukegan, IL (KUGN) reported a visibility of 1/4 mile at 0552 UTC and 0652 UTC.

GOES_IFR_PROB_20131010_0802

As above, but for 0802 UTC on 10 October (click image to enlarge)

At 0802 UTC, the GOES-East brightness temperature difference field shows greater differences over the region of SE Wisconsin where the fog is developing. Accordingly, the IFR probability increases past 80% IFR Probabilities are near 70% in Manitowoc County (and Manitowoc reported 1/2-mile visibility at 0834 UTC). Compare the GOES-East and Suomi/NPP Brightness Temperature Difference Fields; note the lack of a signal in the Suomi/NPP field along the western shore of Lake Michigan, confirming the co-registration error present in GOES-13.

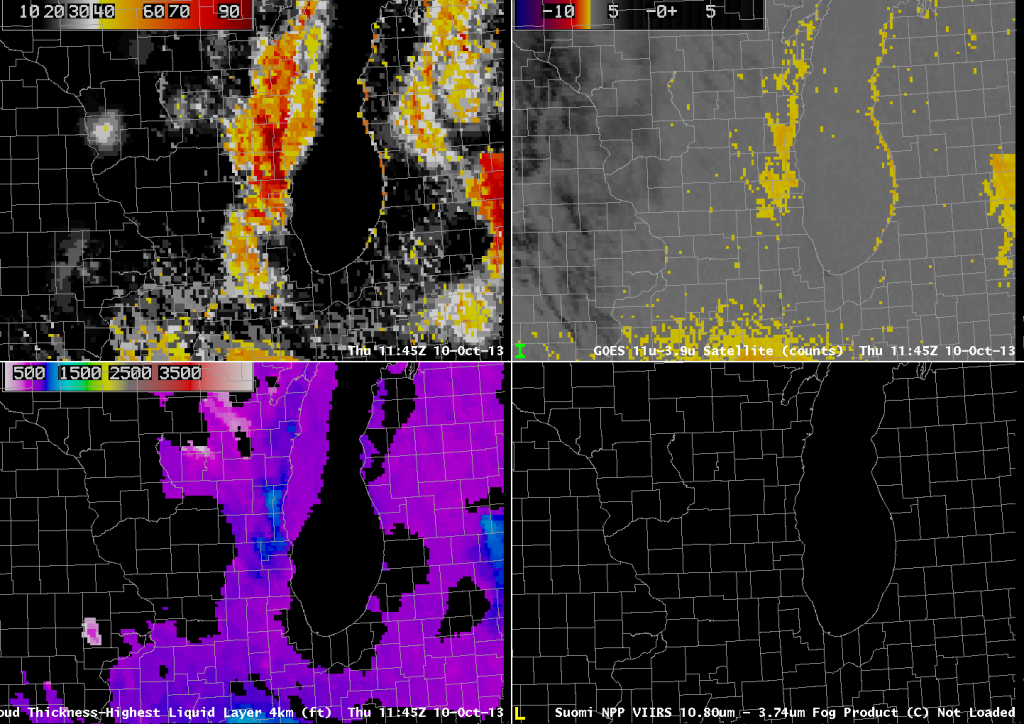
GOES_IFR_PROB_20131010_1145

As above, but for 1145 UTC on 10 October (click image to enlarge)

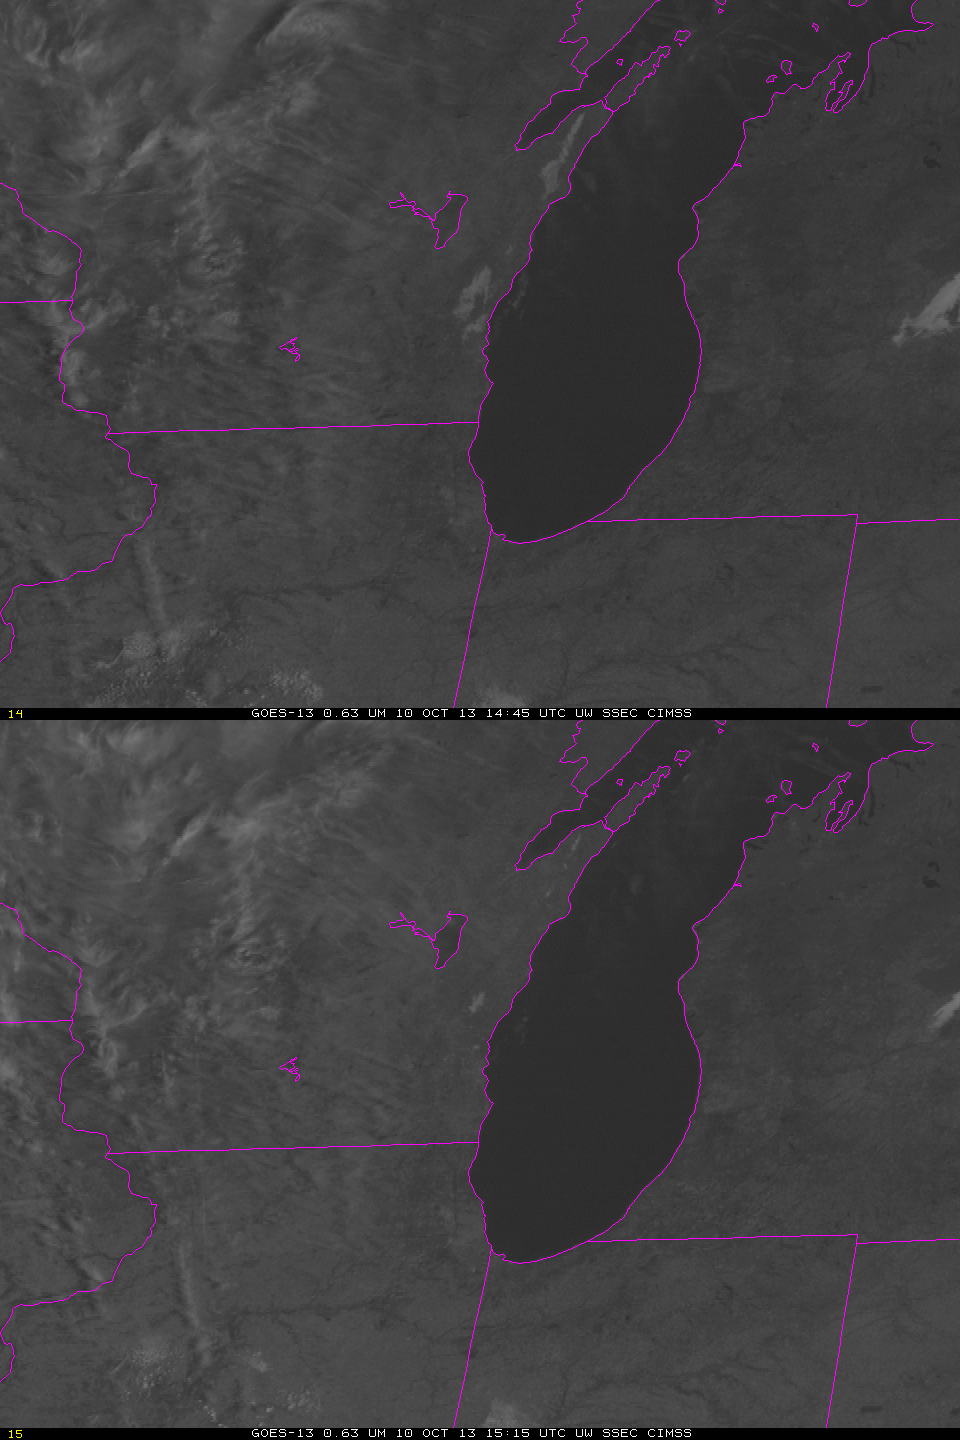
The last pre-sunrise image, 1145 UTC, shows a definite signal of fog/low stratus in both the IFR Probability field and in the Brightness Temperature Difference field. However, the early detection in the IFR Probability field gives a nice head’s up to the forecaster. Note also in this image how the strong signal in the brightness temperature difference field that arises because of the co-registration error can contaminate the IFR Probability field. The Cloud Thickness in this field has been related to dissipation time, as shown in this chart. The maximum thickness of 1000 feet predicts a dissipation time around 1500 UTC. The 1445 and 1515 UTC GOES-13 visible images are shown below.

GOES13_VIS_10Oct2013loop

GOES-13 Visible Imagery at 1445 UTC and 1515 UTC on 10 October (click image to enlarge)

Day/Night Band Imagery of Fog near Lake Superior

VIIRS_DNB__REF_20130923loop

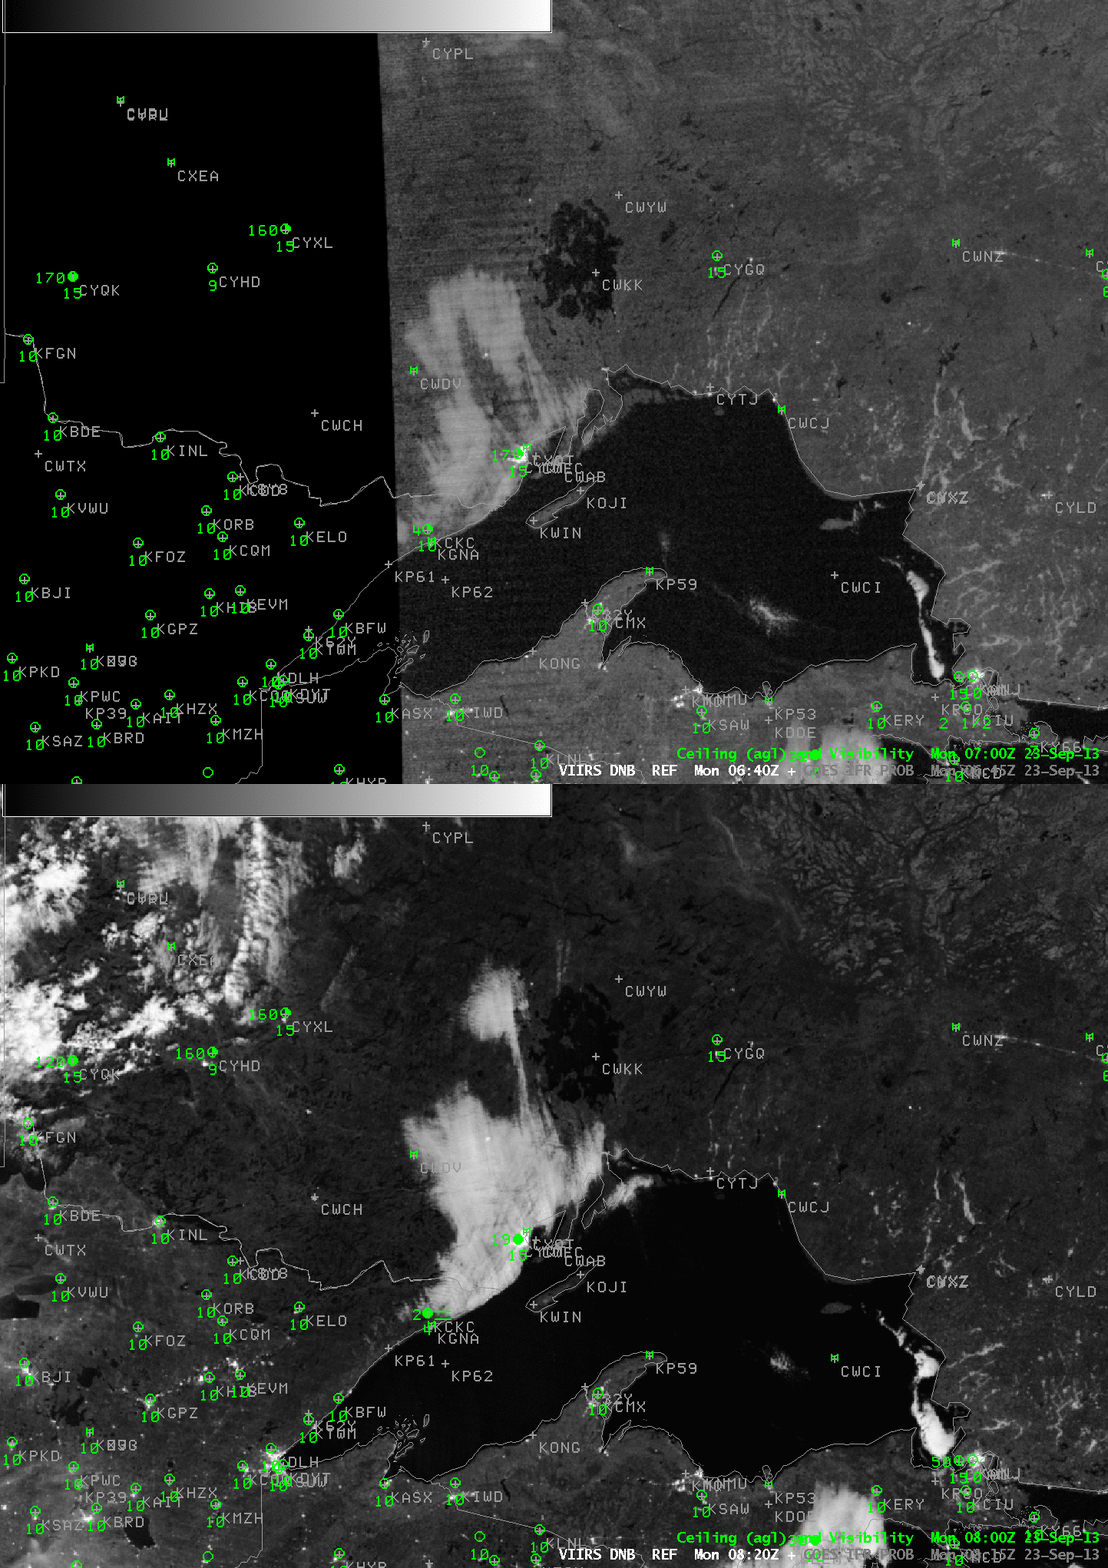
Suomi/NPP VIIRS Day/Night Band Visible Imagery, 0640 and 0820 UTC 23 September 2013 (click image to enlarge)

The orbital geometry of Suomi/NPP is such that one geographic region will be scanned on two successive polar passes, about 90 minutes apart. The likelihood that this will happen increases as you approach the Poles. On the morning of 23 September, 2013, western Lake Superior was thus viewed twice as fog developed. This was also a night shortly after a Full Moon so ample lunar illumination allowed for a distinct view of the evolution of the fog. The 0645 UTC Day/Night band imagery shows what appears to be a much thinner cloud bank over the far northeast Minnesota Arrowhead. By 0820 UTC the cloud bank has a thicker look. Note the corresponding changes in sky/visibility at Thunder Bay (CYQT) and Grand Marais (KCKC).

VIIRS_FOG_20130923loop

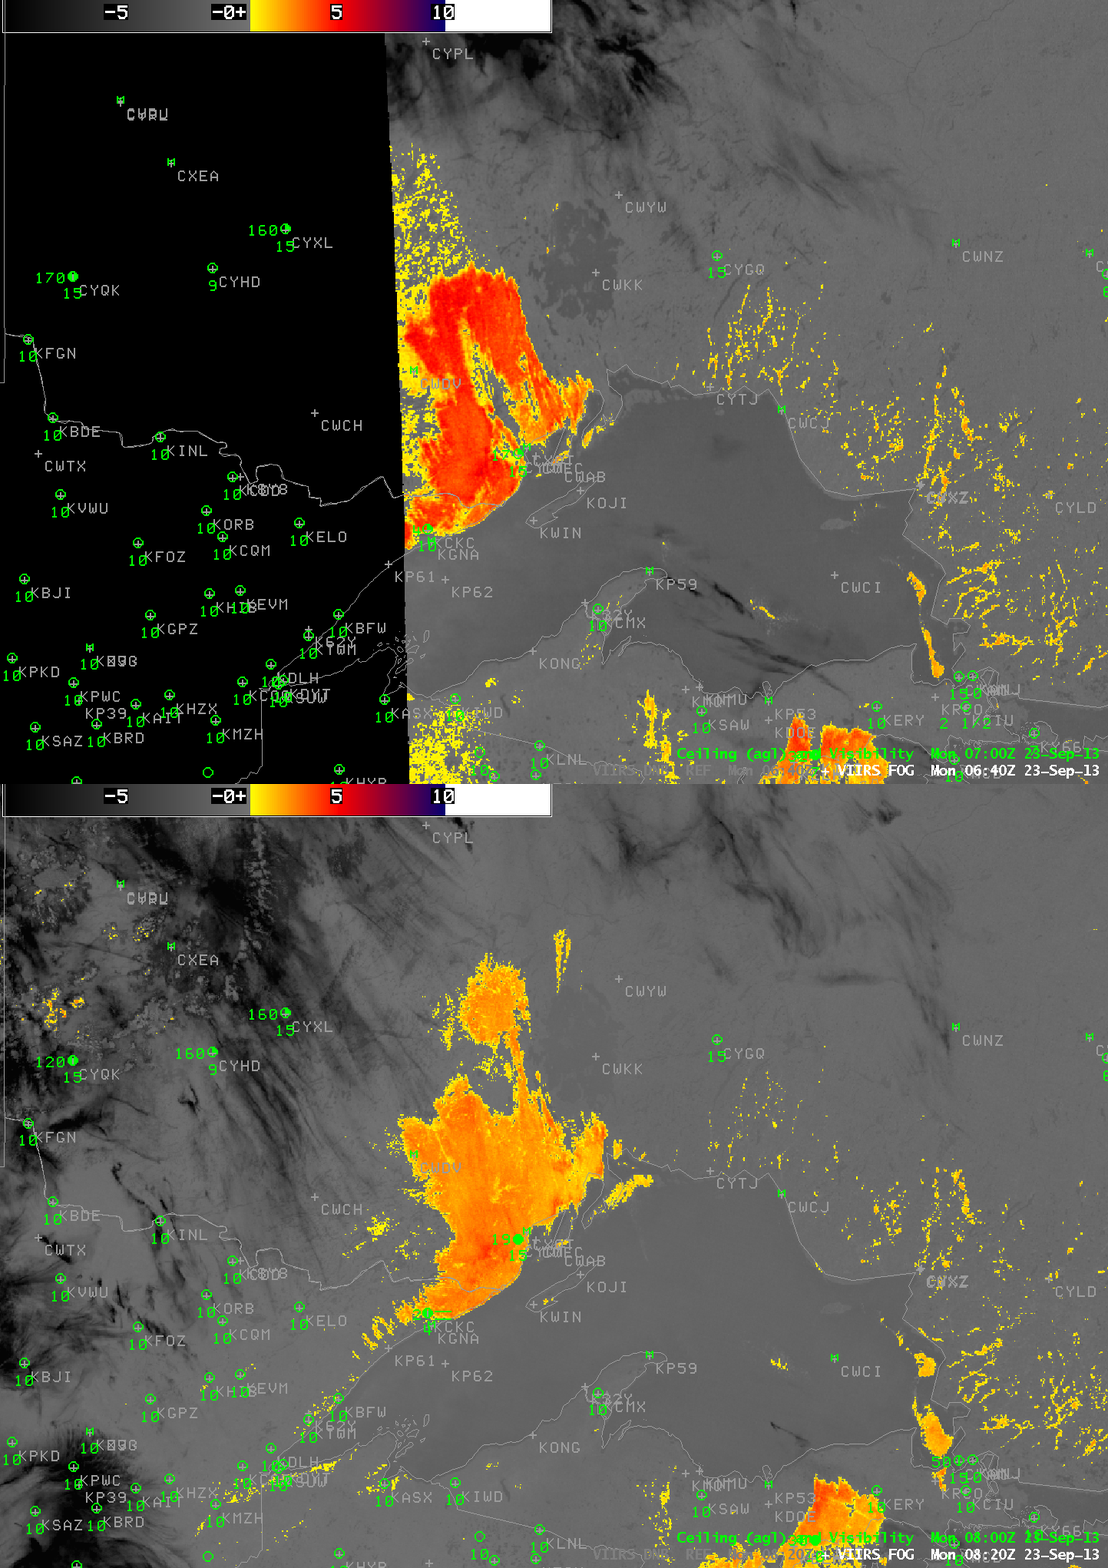
Suomi/NPP Brightness Temperature Difference (11.35 µm – 3.74 µm) at 0640 and 0820 UTC, 23 September 2013 (click image to enlarge)

The Brightness Temperature Difference product can be used to identify regions of fog/low clouds. Clouds comprised of water droplets have different emissivity properties at short and long infrared wavelengths. That is, clouds do not emit as a blackbody at wavelengths around 3.74 µm; they do emit more like a blackbody at wavelengths near 11.35 µm. Thus, a brightness temperature difference from Suomi/NPP, 11.35 µm – 3.74 µm, will be warm in regions where clouds comprised of water droplets exist. In the example above, note that the brightness temperature difference is much warmer (a maximum of 5.5 K) at 0640 UTC than at 0820 UTC (where the maximum is only 4K). Why is there a difference in the two scenes?

The view at 0640 UTC is along the edge of the Suomi/NPP scan, and therefore the scan traverses a longer stretch of atmosphere, allowing for more signal absorption. Both the 3.74 µm and 11.35 µm I-Bands (the purple lines in the linked-to images) on VIIRS are broad, meaning they sense photons over a relatively large part of the electromagnetic spectrum (compared to the M-bands and to MODIS). Note that the relative response suggests that a longer pathlength through the atmosphere will cause more attenuation for the 11.35 µm channel, meaning a colder temperature. This would likely diminish the difference between the longwave and shortwave IR imagery. The opposite effect is occurring here — the brightness temperature difference is smaller in the 0820 UTC image. Why? The answer can be found in the cirrus shield impinging upon western Lake Superior in the second image. Even though the cirrus is thin, it’s radiative effect is such that the brightness temperature difference decreases.

GOES_VIIRSloop_20130923

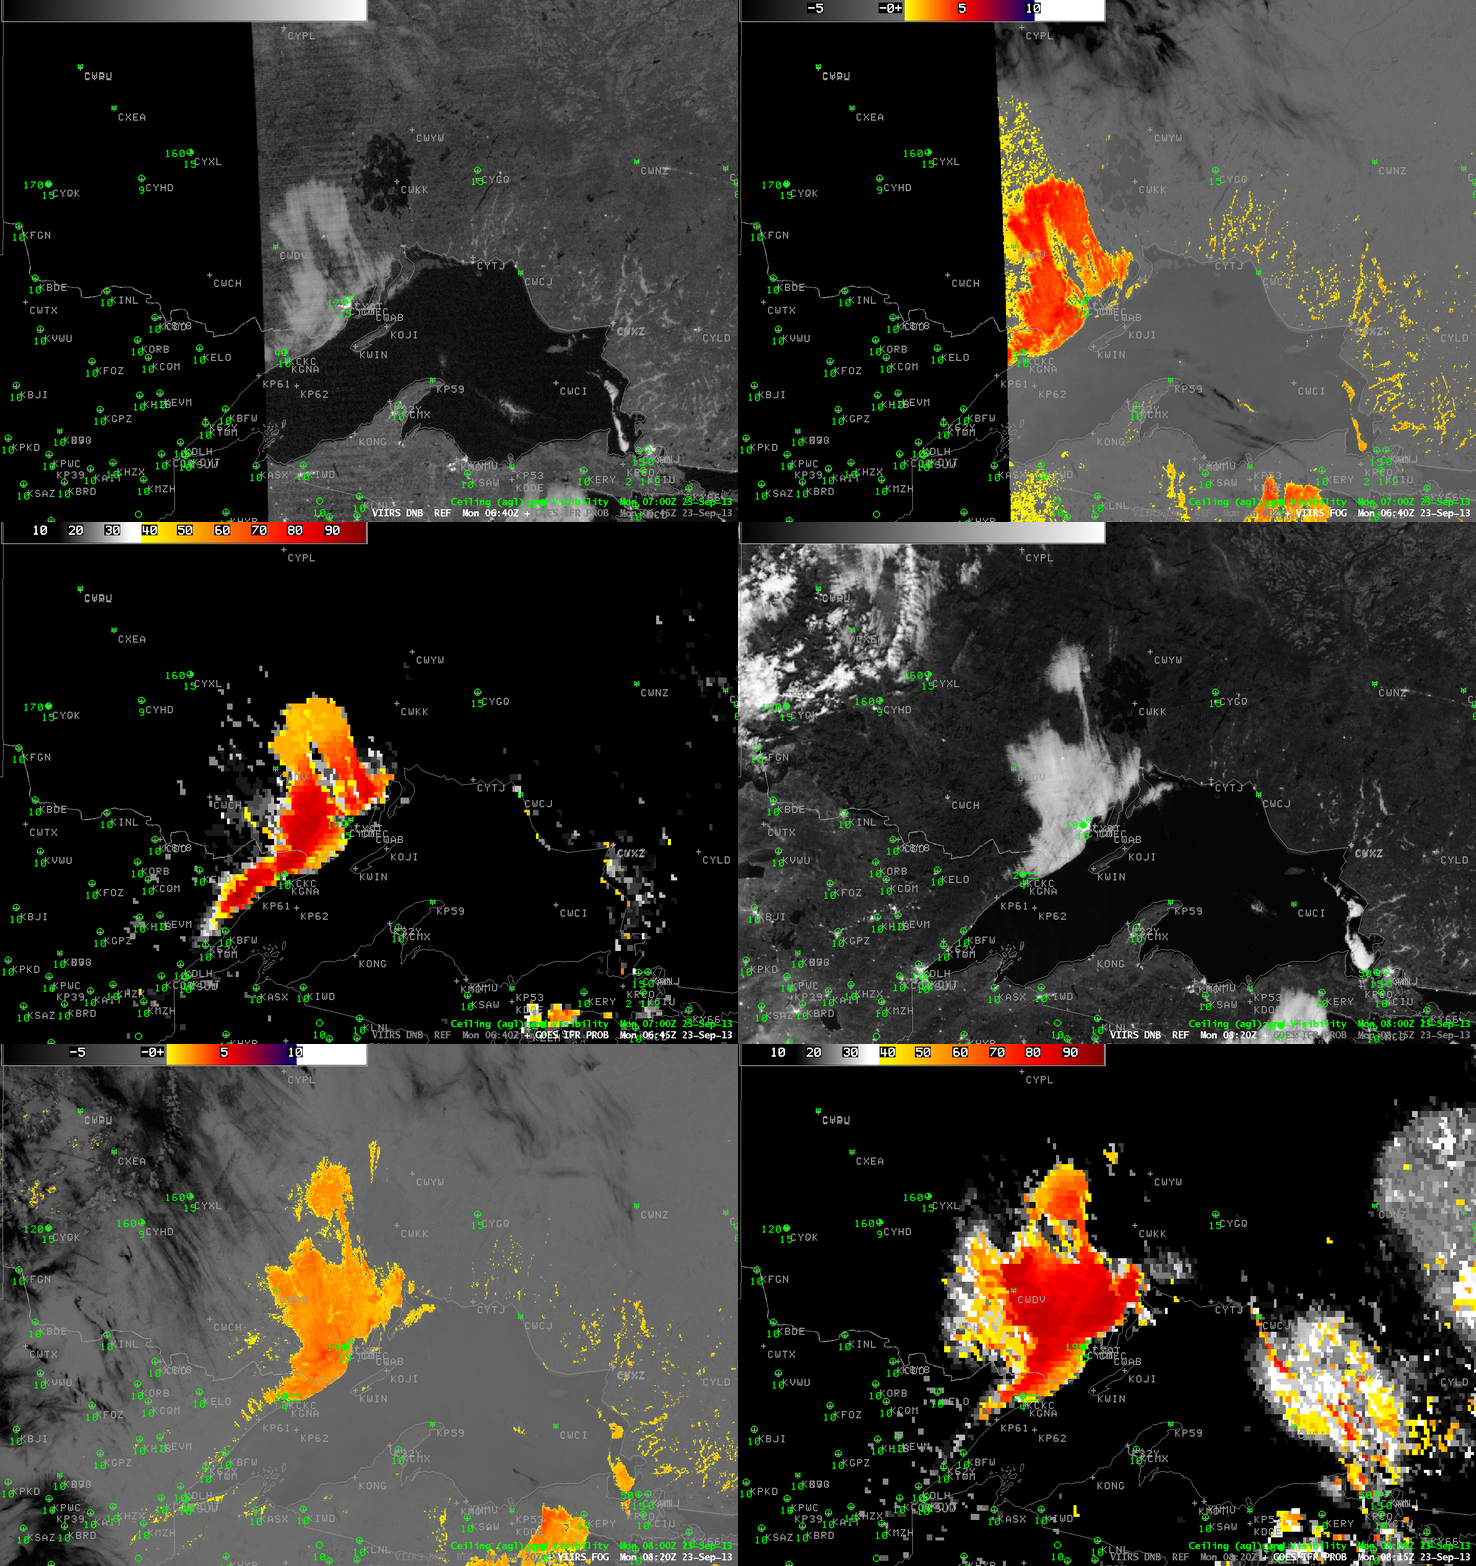
Loop of Suomi/NPP VIIRS Day/Night Band, VIIRS Brightness Temperature Difference (11.35 µm – 3.74 µm) and GOES-East-based GOES-R IFR Probability from ~0640 and ~0820 UTC on 23 September (click image to enlarge)

How does the GOES-R IFR Probability change in the time between the two Suomi/NPP overpasses? The loop above cycles between the Day/Night Band and the Brightness Temperature Difference (from VIIRS) and the GOES-Based IFR Probability at 0645 and 0815 UTC. Highest IFR Probabilities do exist in regions where VIIRS Day/Night Band imagery and Brightness temperature difference suggest the presence of fog — between Grand Marais and Thunder Bay, and in the river valleys northeast of Lake Superior. (Poor GOES Resolution northeast of Lake Superior hampers a precise identification of where the Valley Fog is). Note that the high values of GOES-IFR probability along the Lake Superior Lakeshore, especially those lakeshores that are oriented north-south, likely stem from the coregistration error between the 3.9 µm and 10.7 µm channels on GOES-13.

GOES_IFR_PROB_20130923loop

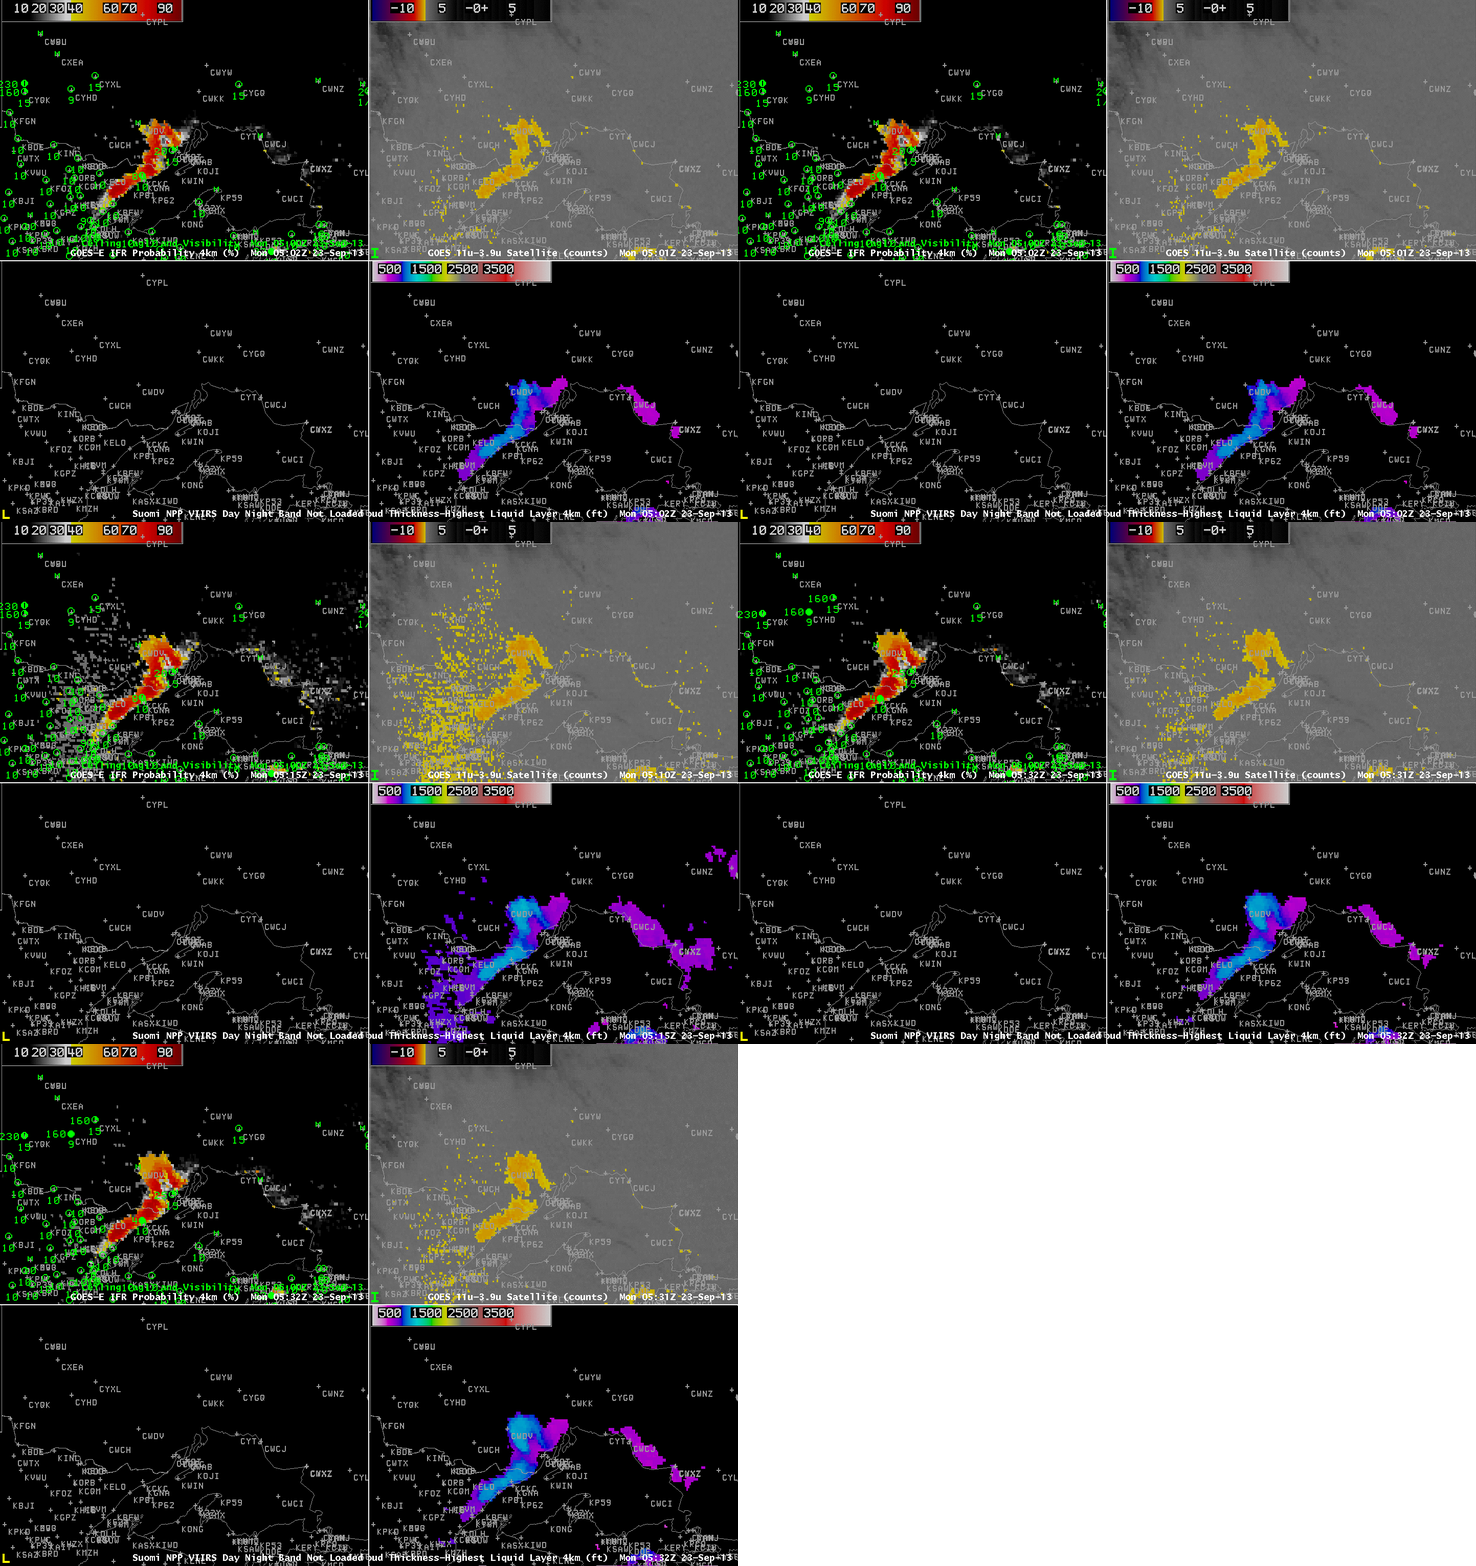
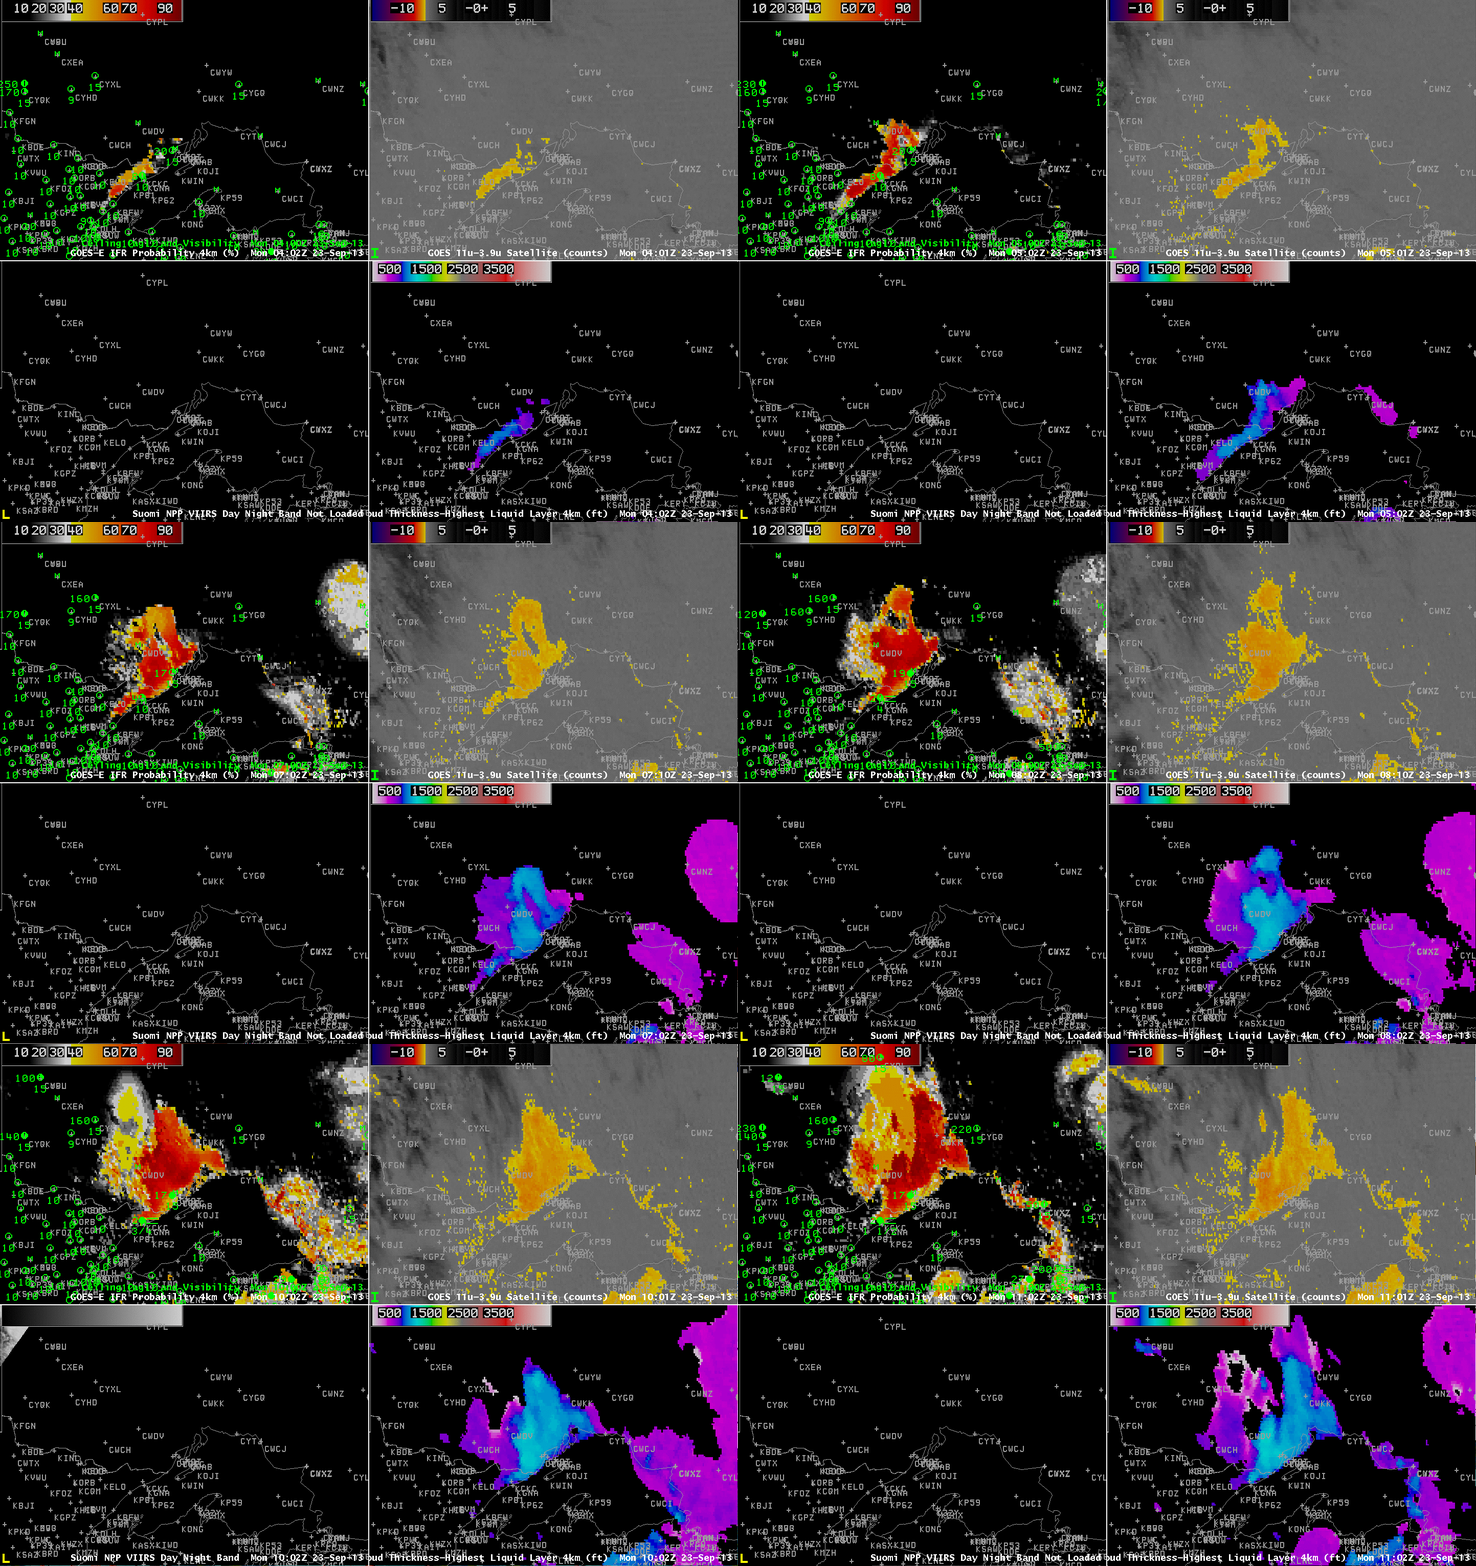
GOES-R IFR Probability for three times centered on 0515 UTC 23 September 2013 (click image to enlarge)

The GOES-R IFR Probability shows there is still Stray Light occasionally (in the present case, at 0515 UTC only) that will contaminate the brightness temperature difference signal, and therefore also the GOES-R IFR Probability signal. A longer loop of GOES-R IFR probability, below, shows the slow expansion of IFR Probabilities during the course of the night. It also shows the effect, later in the loop, of cirrus impinging on the western shoreline of Lake Superior. IFR Probabilities drop in regions where Cirrus Clouds preclude the use of satellite data in the determination of IFR Probabilities. In addition, GOES-R Cloud Thickness is not computed in regions where cirrus clouds are present.

GOES_IFR_PROB_20130923longloop

GOES-R IFR Probability (Upper Left), GOES-East Brightness Temperature Difference (Upper Right), Suomi/NPP Day/Night Band (Lower Left), GOES-Based GOES-R Cloud Thickness (Lower Right), Times as indicated in imagery (click image to enlarge)