
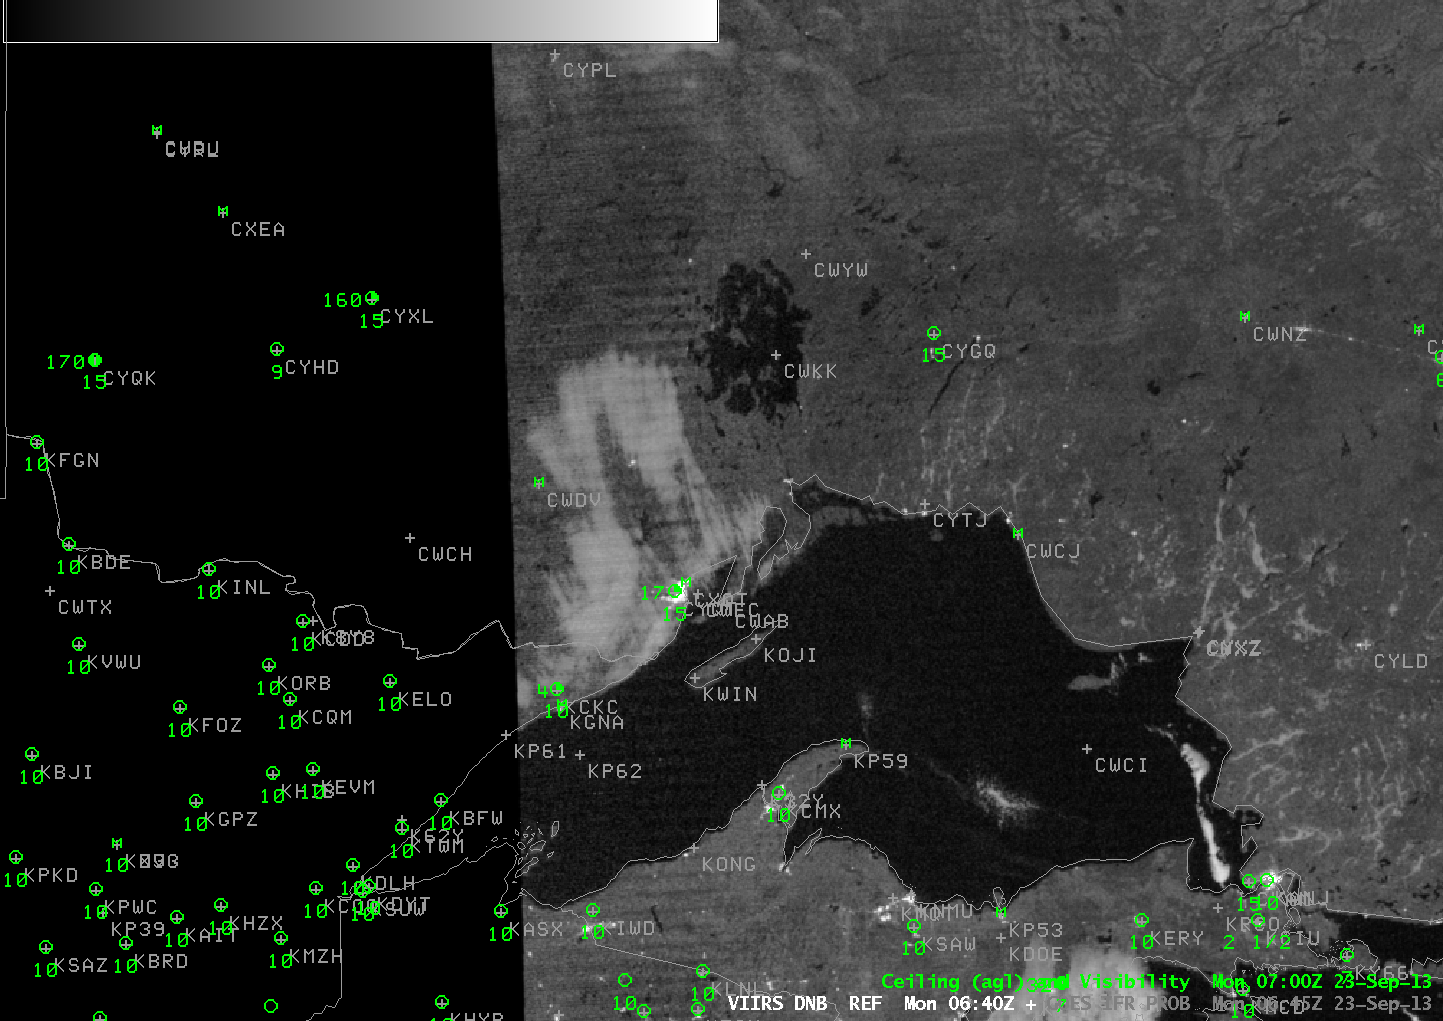
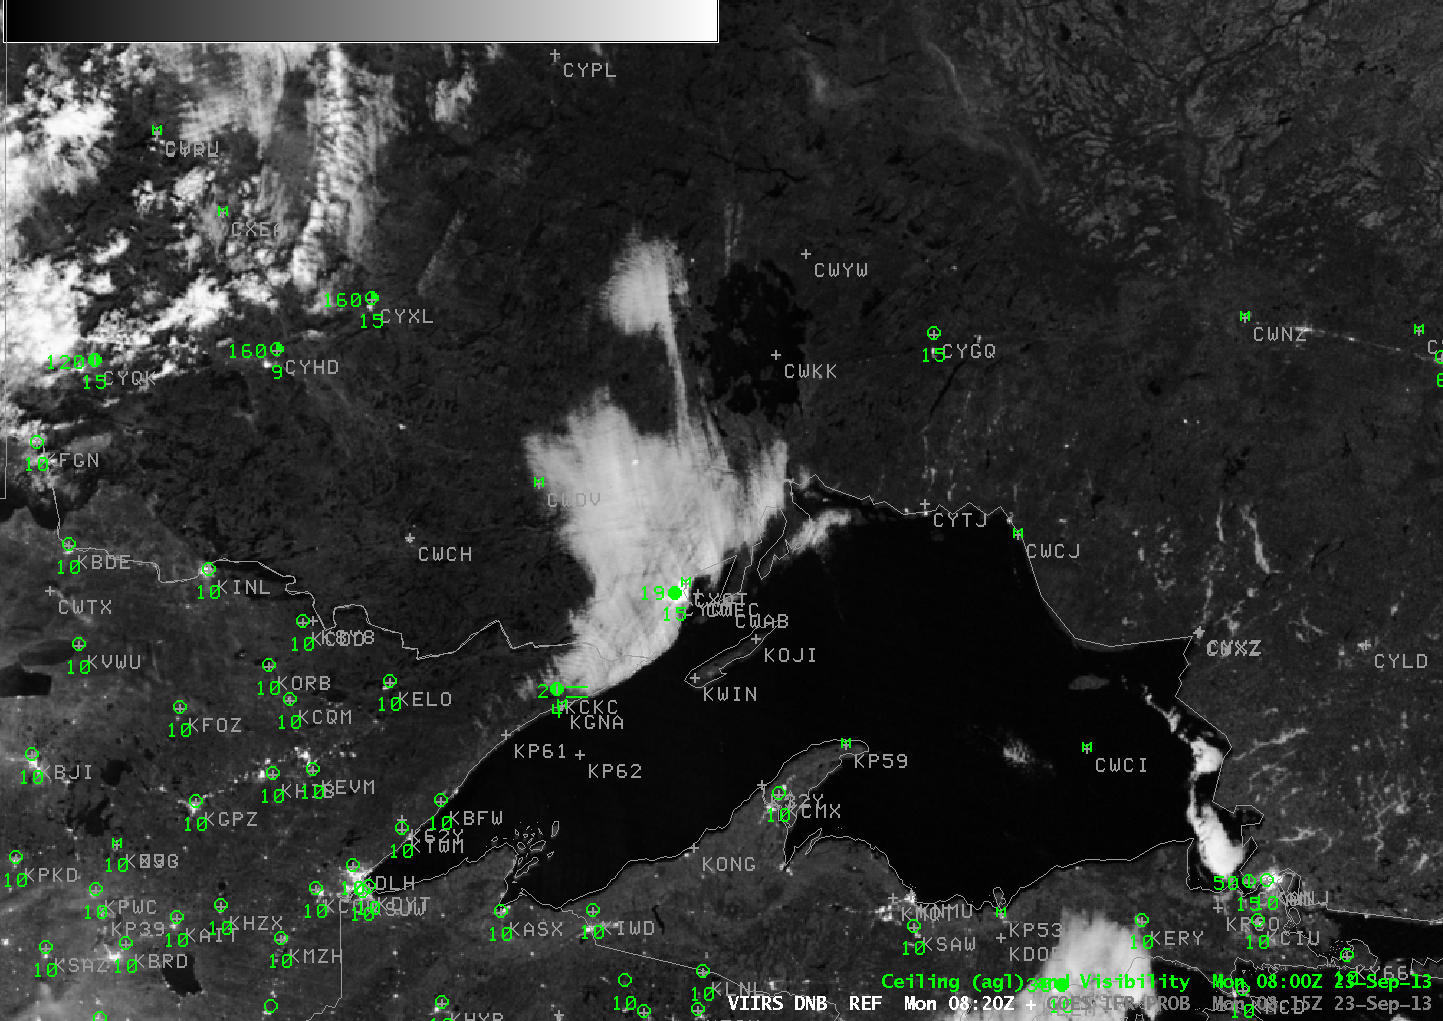
Suomi/NPP VIIRS Day/Night Band Visible Imagery, 0640 and 0820 UTC 23 September 2013 (click image to enlarge)
The orbital geometry of Suomi/NPP is such that one geographic region will be scanned on two successive polar passes, about 90 minutes apart. The likelihood that this will happen increases as you approach the Poles. On the morning of 23 September, 2013, western Lake Superior was thus viewed twice as fog developed. This was also a night shortly after a Full Moon so ample lunar illumination allowed for a distinct view of the evolution of the fog. The 0645 UTC Day/Night band imagery shows what appears to be a much thinner cloud bank over the far northeast Minnesota Arrowhead. By 0820 UTC the cloud bank has a thicker look. Note the corresponding changes in sky/visibility at Thunder Bay (CYQT) and Grand Marais (KCKC).

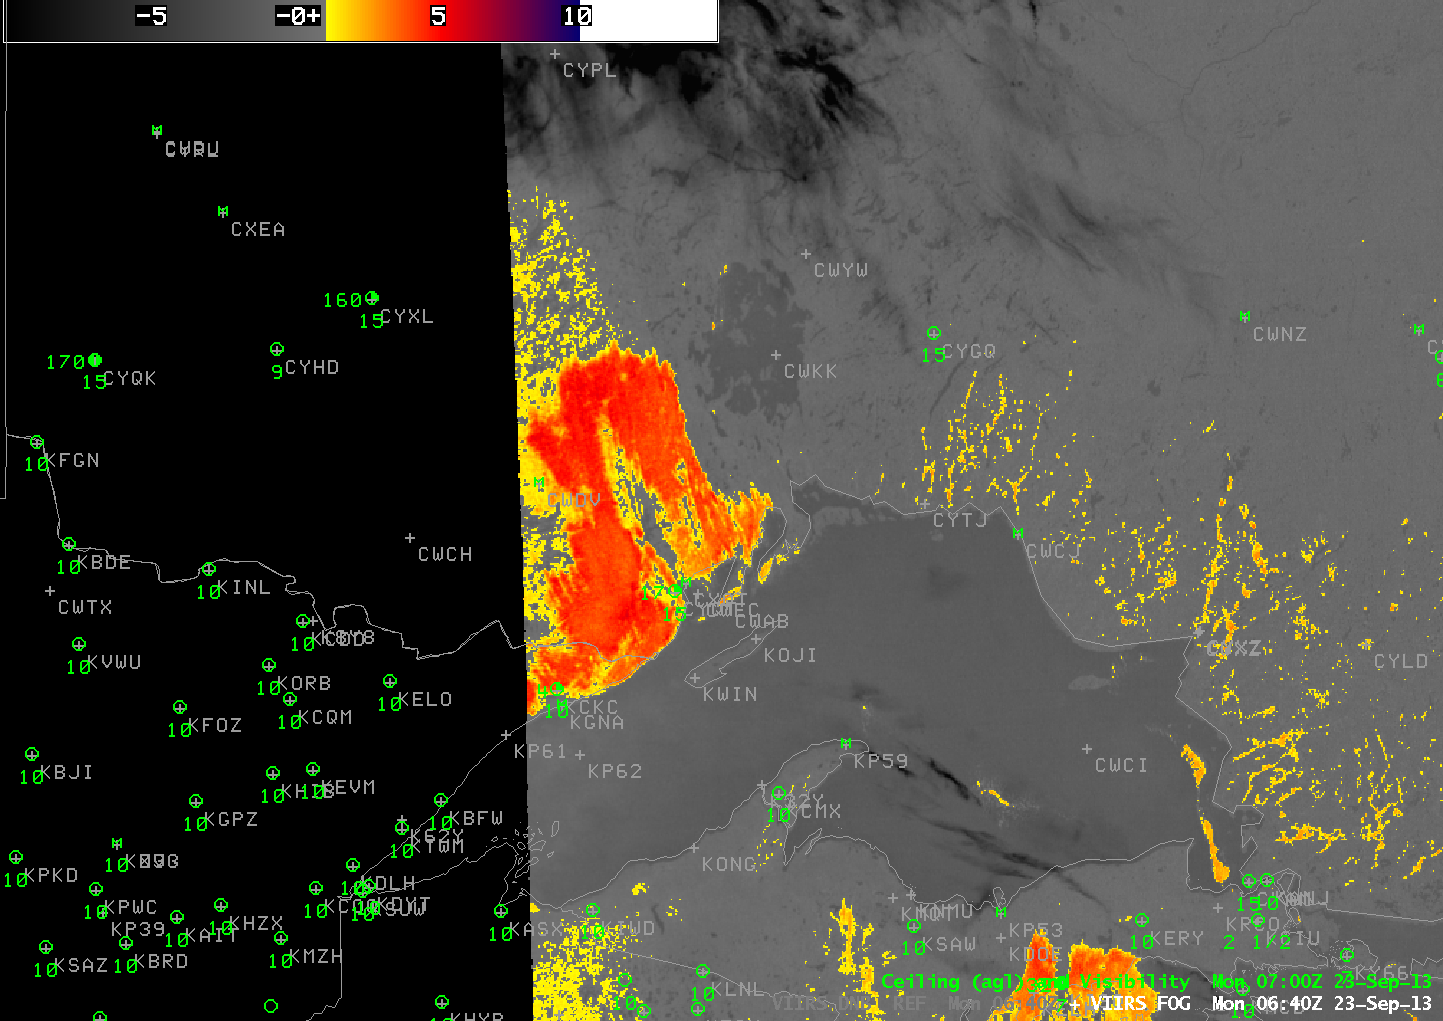
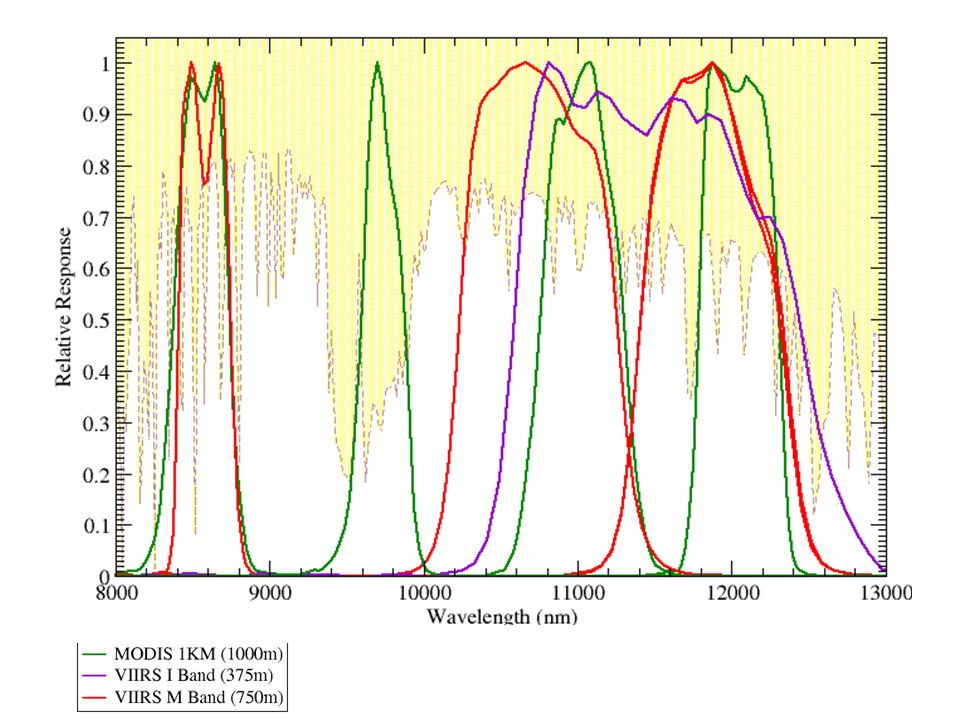
Suomi/NPP Brightness Temperature Difference (11.35 µm – 3.74 µm) at 0640 and 0820 UTC, 23 September 2013 (click image to enlarge)
The Brightness Temperature Difference product can be used to identify regions of fog/low clouds. Clouds comprised of water droplets have different emissivity properties at short and long infrared wavelengths. That is, clouds do not emit as a blackbody at wavelengths around 3.74 µm; they do emit more like a blackbody at wavelengths near 11.35 µm. Thus, a brightness temperature difference from Suomi/NPP, 11.35 µm – 3.74 µm, will be warm in regions where clouds comprised of water droplets exist. In the example above, note that the brightness temperature difference is much warmer (a maximum of 5.5 K) at 0640 UTC than at 0820 UTC (where the maximum is only 4K). Why is there a difference in the two scenes?
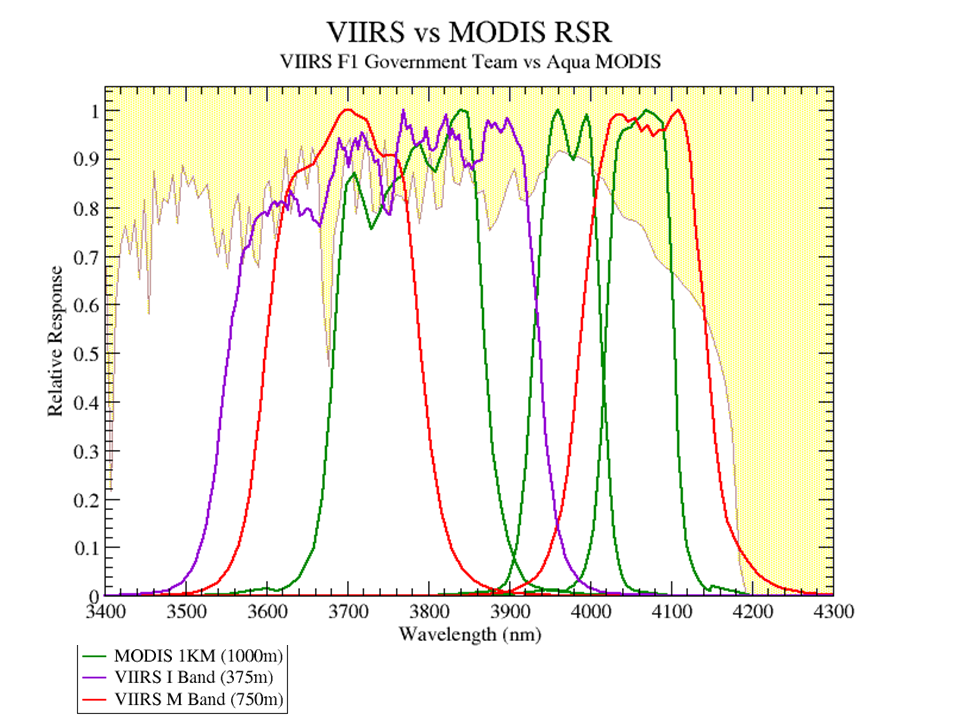
The view at 0640 UTC is along the edge of the Suomi/NPP scan, and therefore the scan traverses a longer stretch of atmosphere, allowing for more signal absorption. Both the 3.74 µm and 11.35 µm I-Bands (the purple lines in the linked-to images) on VIIRS are broad, meaning they sense photons over a relatively large part of the electromagnetic spectrum (compared to the M-bands and to MODIS). Note that the relative response suggests that a longer pathlength through the atmosphere will cause more attenuation for the 11.35 µm channel, meaning a colder temperature. This would likely diminish the difference between the longwave and shortwave IR imagery. The opposite effect is occurring here — the brightness temperature difference is smaller in the 0820 UTC image. Why? The answer can be found in the cirrus shield impinging upon western Lake Superior in the second image. Even though the cirrus is thin, it’s radiative effect is such that the brightness temperature difference decreases.

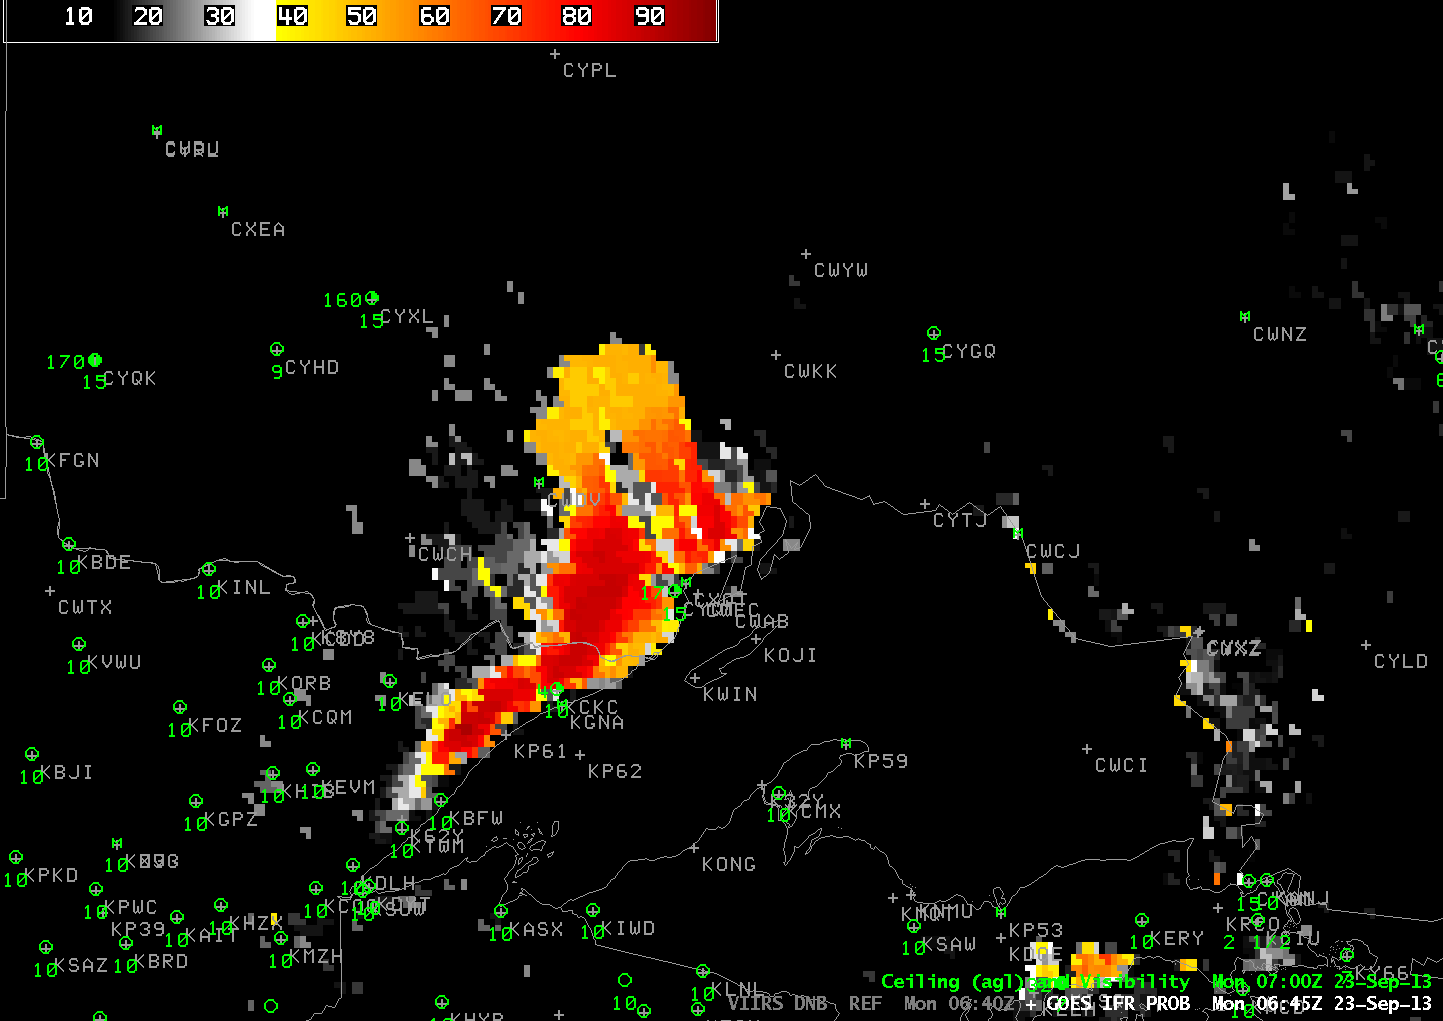
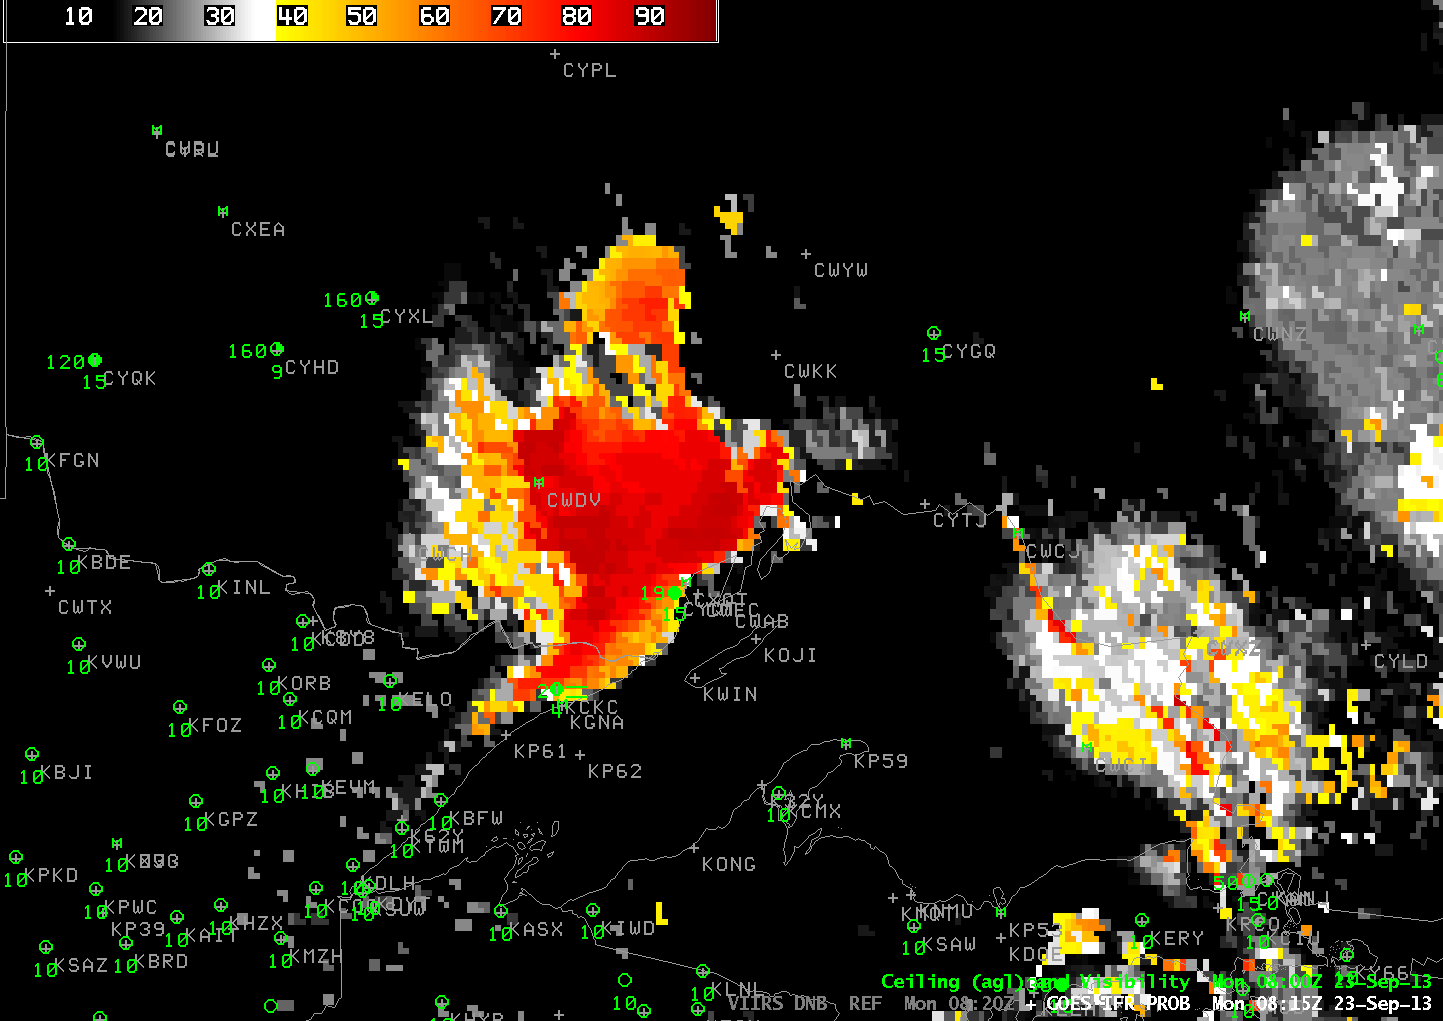
Loop of Suomi/NPP VIIRS Day/Night Band, VIIRS Brightness Temperature Difference (11.35 µm – 3.74 µm) and GOES-East-based GOES-R IFR Probability from ~0640 and ~0820 UTC on 23 September (click image to enlarge)
How does the GOES-R IFR Probability change in the time between the two Suomi/NPP overpasses? The loop above cycles between the Day/Night Band and the Brightness Temperature Difference (from VIIRS) and the GOES-Based IFR Probability at 0645 and 0815 UTC. Highest IFR Probabilities do exist in regions where VIIRS Day/Night Band imagery and Brightness temperature difference suggest the presence of fog — between Grand Marais and Thunder Bay, and in the river valleys northeast of Lake Superior. (Poor GOES Resolution northeast of Lake Superior hampers a precise identification of where the Valley Fog is). Note that the high values of GOES-IFR probability along the Lake Superior Lakeshore, especially those lakeshores that are oriented north-south, likely stem from the coregistration error between the 3.9 µm and 10.7 µm channels on GOES-13.
GOES-R IFR Probability for three times centered on 0515 UTC 23 September 2013 (click image to enlarge)
The GOES-R IFR Probability shows there is still Stray Light occasionally (in the present case, at 0515 UTC only) that will contaminate the brightness temperature difference signal, and therefore also the GOES-R IFR Probability signal. A longer loop of GOES-R IFR probability, below, shows the slow expansion of IFR Probabilities during the course of the night. It also shows the effect, later in the loop, of cirrus impinging on the western shoreline of Lake Superior. IFR Probabilities drop in regions where Cirrus Clouds preclude the use of satellite data in the determination of IFR Probabilities. In addition, GOES-R Cloud Thickness is not computed in regions where cirrus clouds are present.
GOES-R IFR Probability (Upper Left), GOES-East Brightness Temperature Difference (Upper Right), Suomi/NPP Day/Night Band (Lower Left), GOES-Based GOES-R Cloud Thickness (Lower Right), Times as indicated in imagery (click image to enlarge)