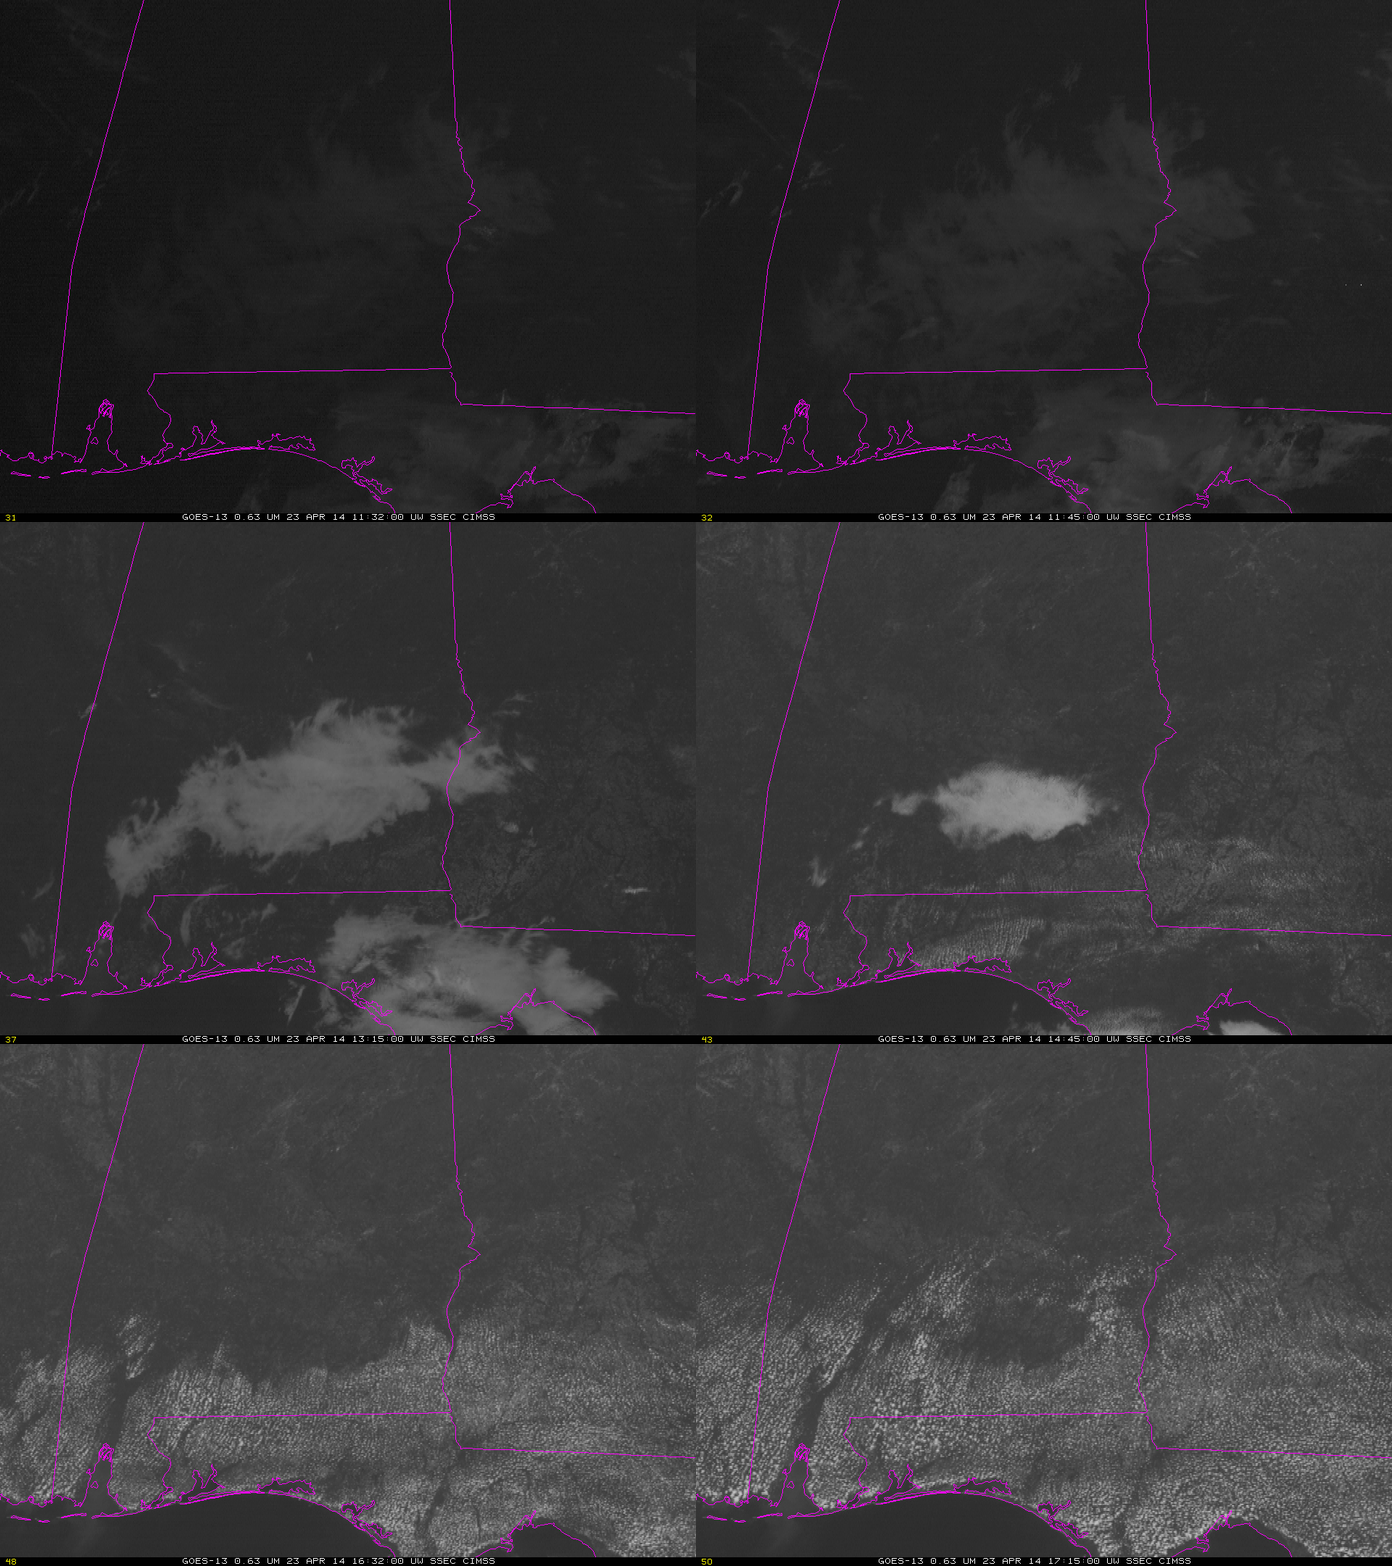
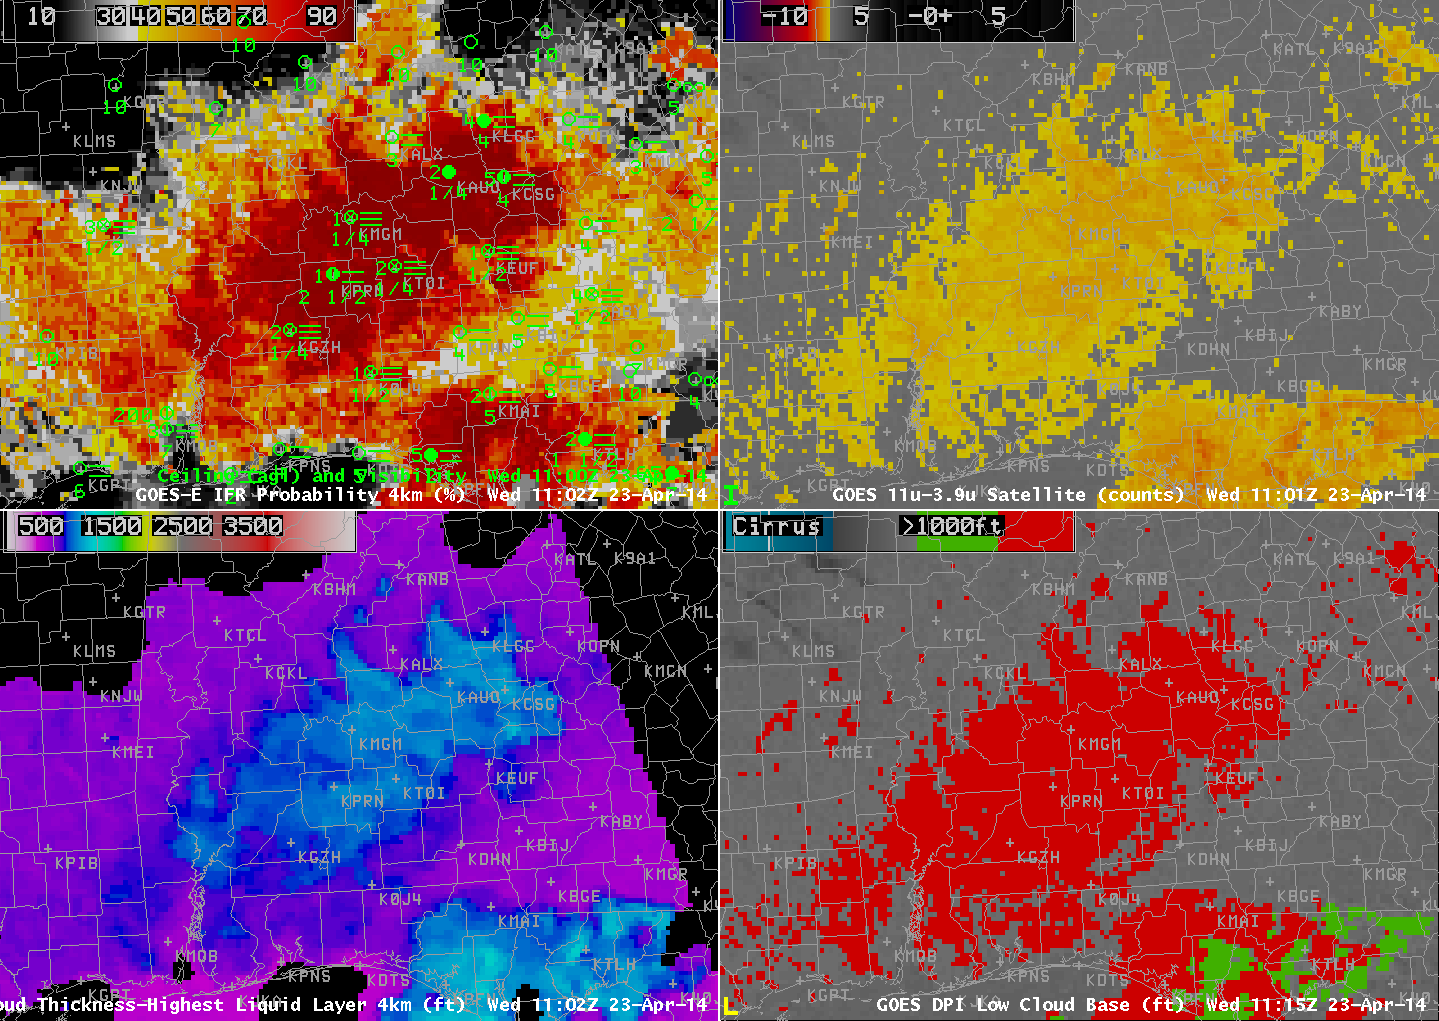
GOES-R Fog/Low Stratus products can be used to estimate the time of fog dissipation, an example of which dissipation from 23 April 2014 is shown above (complete with a temporary hole in the subsequent cumulus development). Complete dissipation of the radiation fog occurred by 1632 UTC. This chart is a scatterplot of GOES-R Cloud Thickness in the last pre-sunrise image vs. dissipation time (measured as hours after that pre-sunrise image). The 1100 UTC GOES-R Cloud Thickness is shown below; it is the last pre-sunrise image over Alabama (note that no values are present over Georgia because twilight conditions are present there). GOES-R Cloud Thickness values in the foggy region (where IFR Probabilities are high, and where ceilings are low and visibilities obstructed) are around 1000 feet. Values from the best-fit line at this link suggest, then, a dissipation time of a little over 3 hours, but the spread of values shown in the scatterplot is from less than two hours to more than four. In this present example, fog dissipated after about five hours. IFR conditions ended after about three hours.
Category Archives: Dissipation Time
Cloud thickness as a Predictor for dissipation time
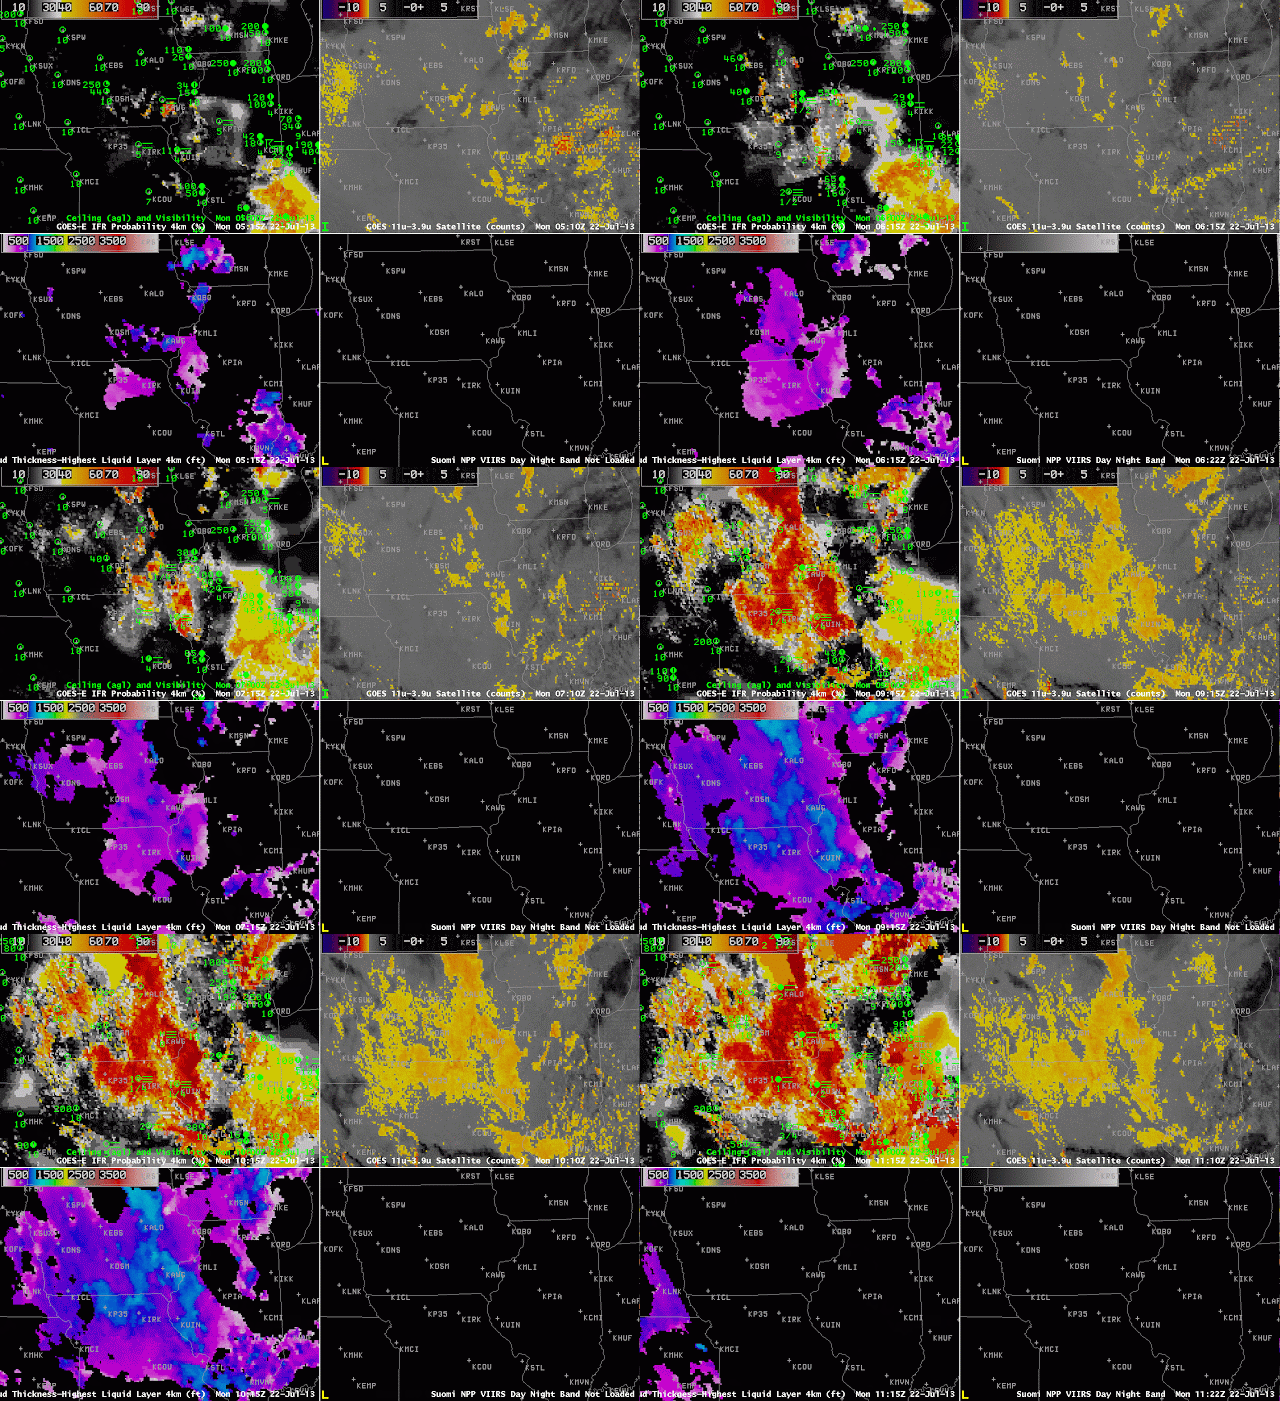
When fog forms overnight because of radiational cooling to the dewpoint, the thickness of the fog is related to the time it will take for the fog to dissipate. In general, thick fog dissipates more slowly than thin, and because thick fog is generally surrounded by thinner fog, a region of fog/low stratus will generally erode from the outside in. The animation above shows the gradual development and expansion of fog overnight over Iowa, Illinois and Missouri, with thicknesses over southeastern Iowa eventually reaching values of 1100 feet!
The relationship between time of dissipation and fog depth is shown on this chart, where the depth is the last pre-twilight image. For 22 July 2013, that image is at 1045 UTC, shown below. A value of 1100 feet corresponds to a dissipation time of 2-3 hours after sunrise.
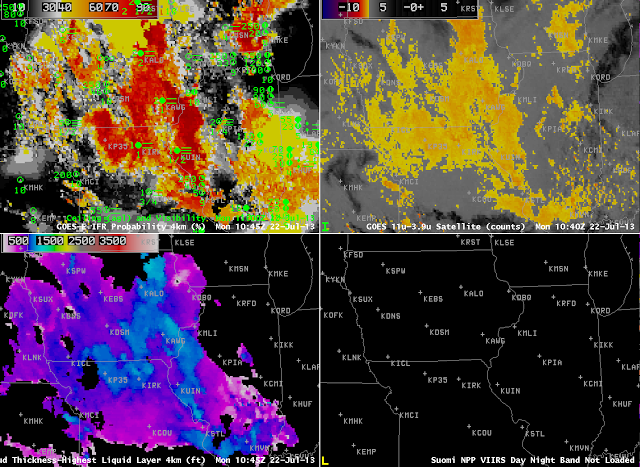 |
| As above, but for 1045 UTC 22 July 2013 |
The visible animation, below, shows dissipation between 1400 and 1500 UTC.
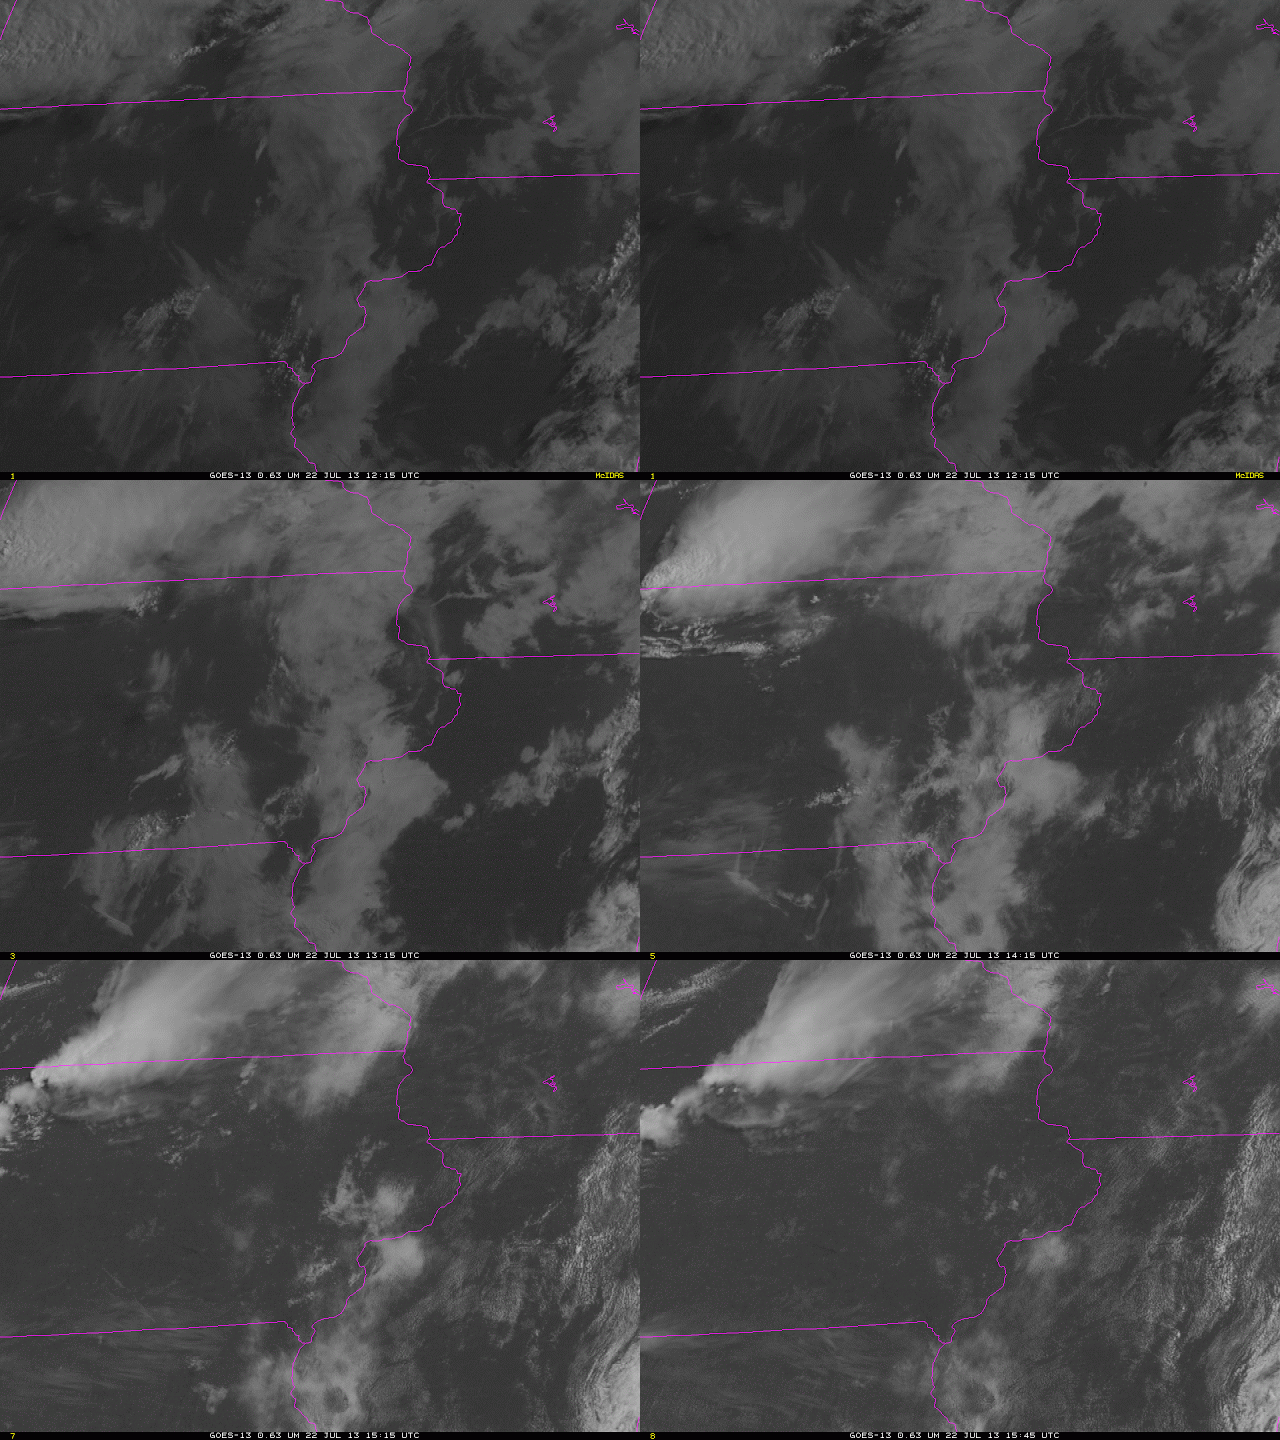 |
| GOES-13 Visible imagery, 1215 through 1545 UTC 22 July 2013 |
Suomi/NPP data showed a snapshot of the fog development in this region at ~0800 UTC.
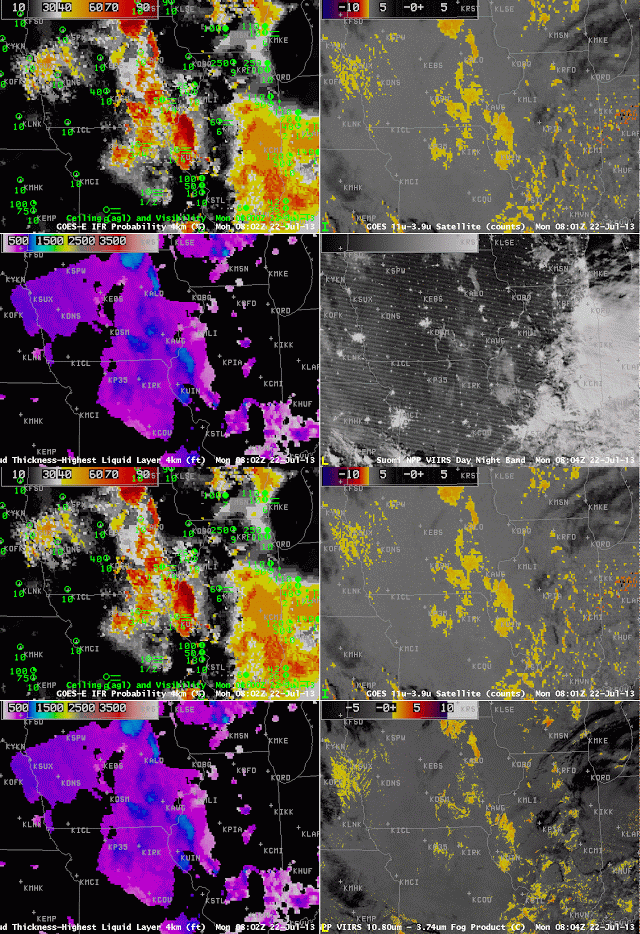 |
| As above, but with a toggle of the Day/Night band and a Brightness Temperature Difference, all imagery at 0802 UTC 22 July 2013. |
Radiation Fog and Dissipation Time in Florida
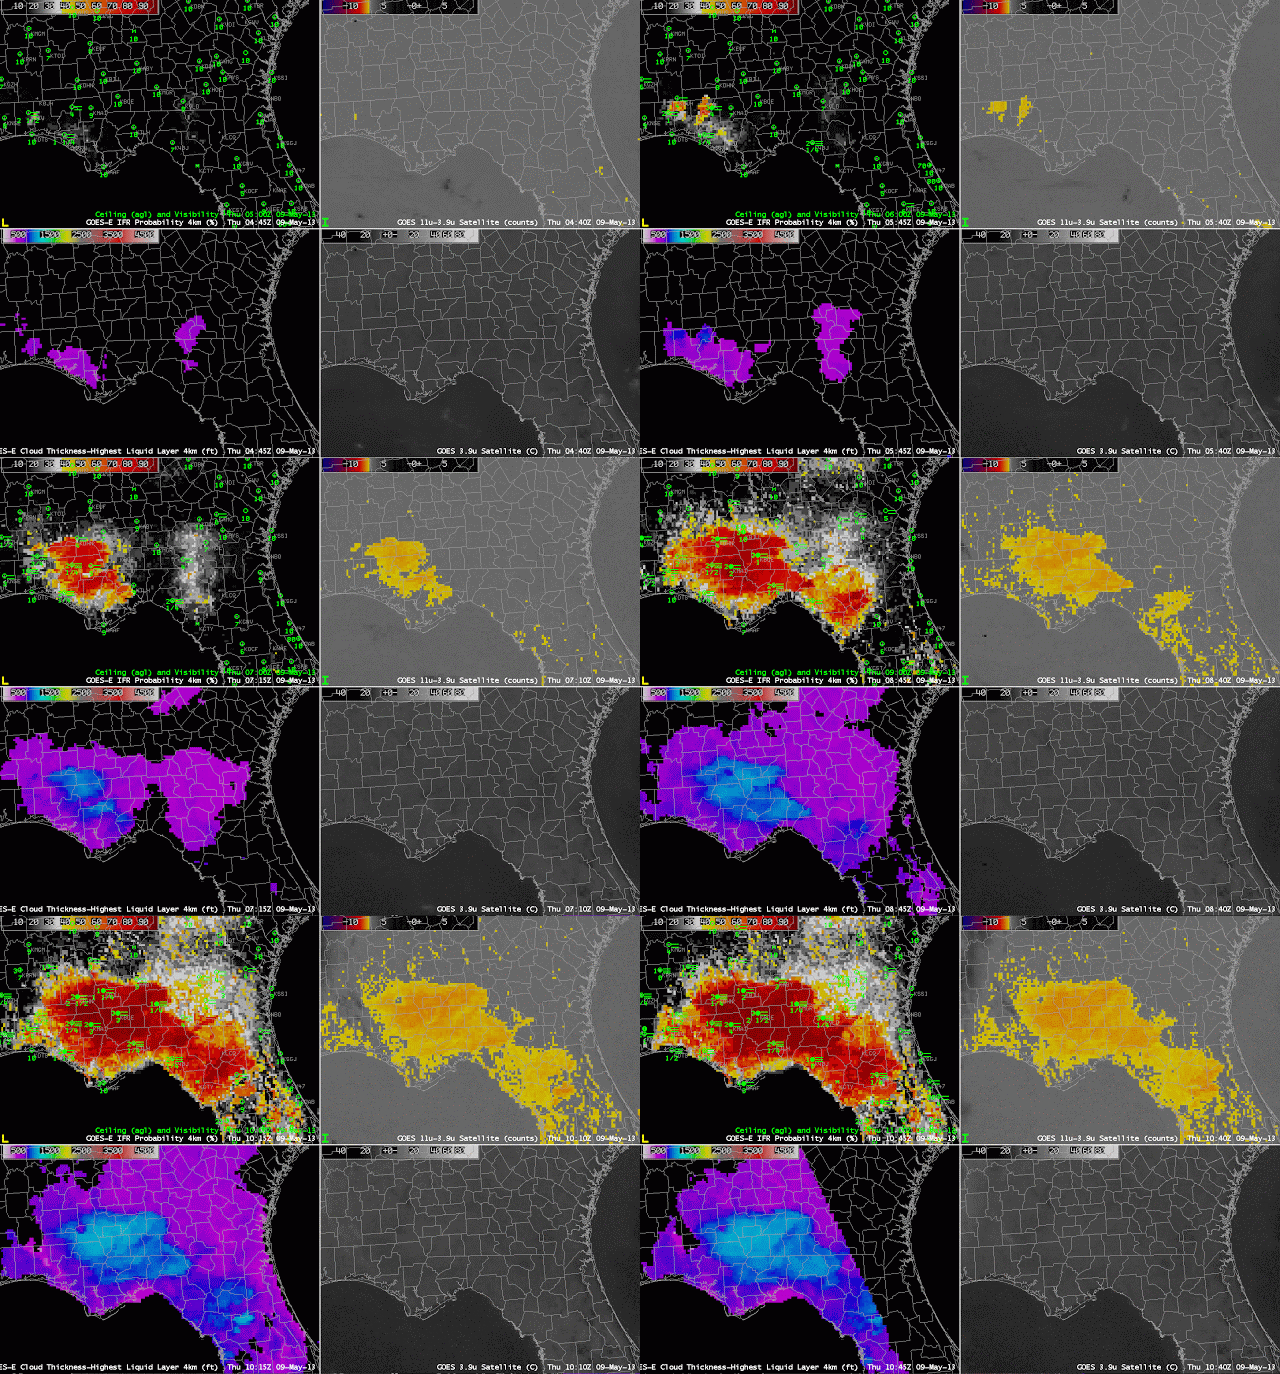
GOES-R Fog/Low Stratus fields can be used to predict fog dissipation times, and in cases of radiation fog, the IFR probability fields sometimes give advance notification of developing IFR conditions before the traditional brightness temperature difference field has a strong signal.
In the example above, for instance, IFR probabilities at 0715 UTC suggest IFR conditions are possible over Perry, FL — in Taylor County, Florida — (where IFR conditions are observed) before the Brightness Temperature Difference field has a signal. Predictions of IFR conditions via that GOES-R fields before the Brightness Temperature Difference field has a strong signal are common.
The GOES-R Cloud Thickness observed just before twilight conditions is used with this scatterplot to predict dissipation time. In the example above, thicknesses are near 1000 feet over northern Florida and southern Georgia, so fog will dissipate in between 2 and 4 hours, according to the points plotted, or in a little over 3 hours according to the best linear fit through the plotted points. The visible imagery animation, below, shows the fog dissipating as expected from the scatterplot.
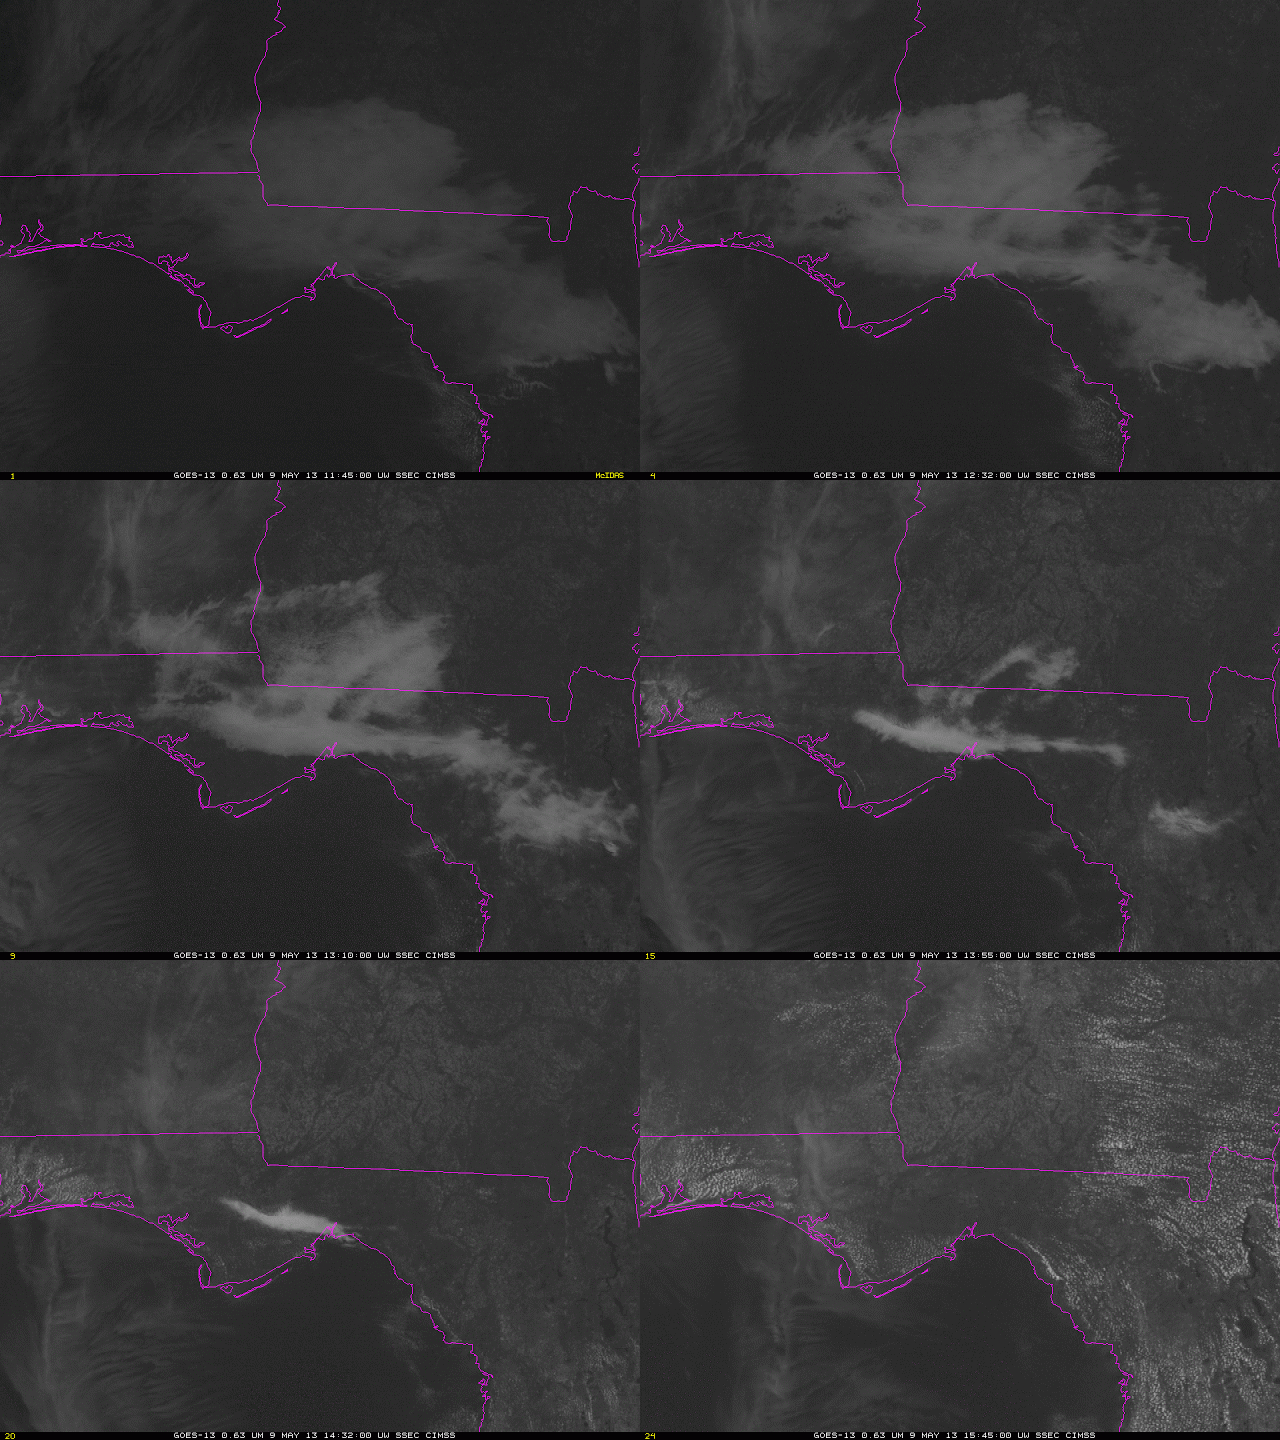 |
| GOES-13 Visible Imagery over northern Florida |
Fog Dissiplation over western Tennessee
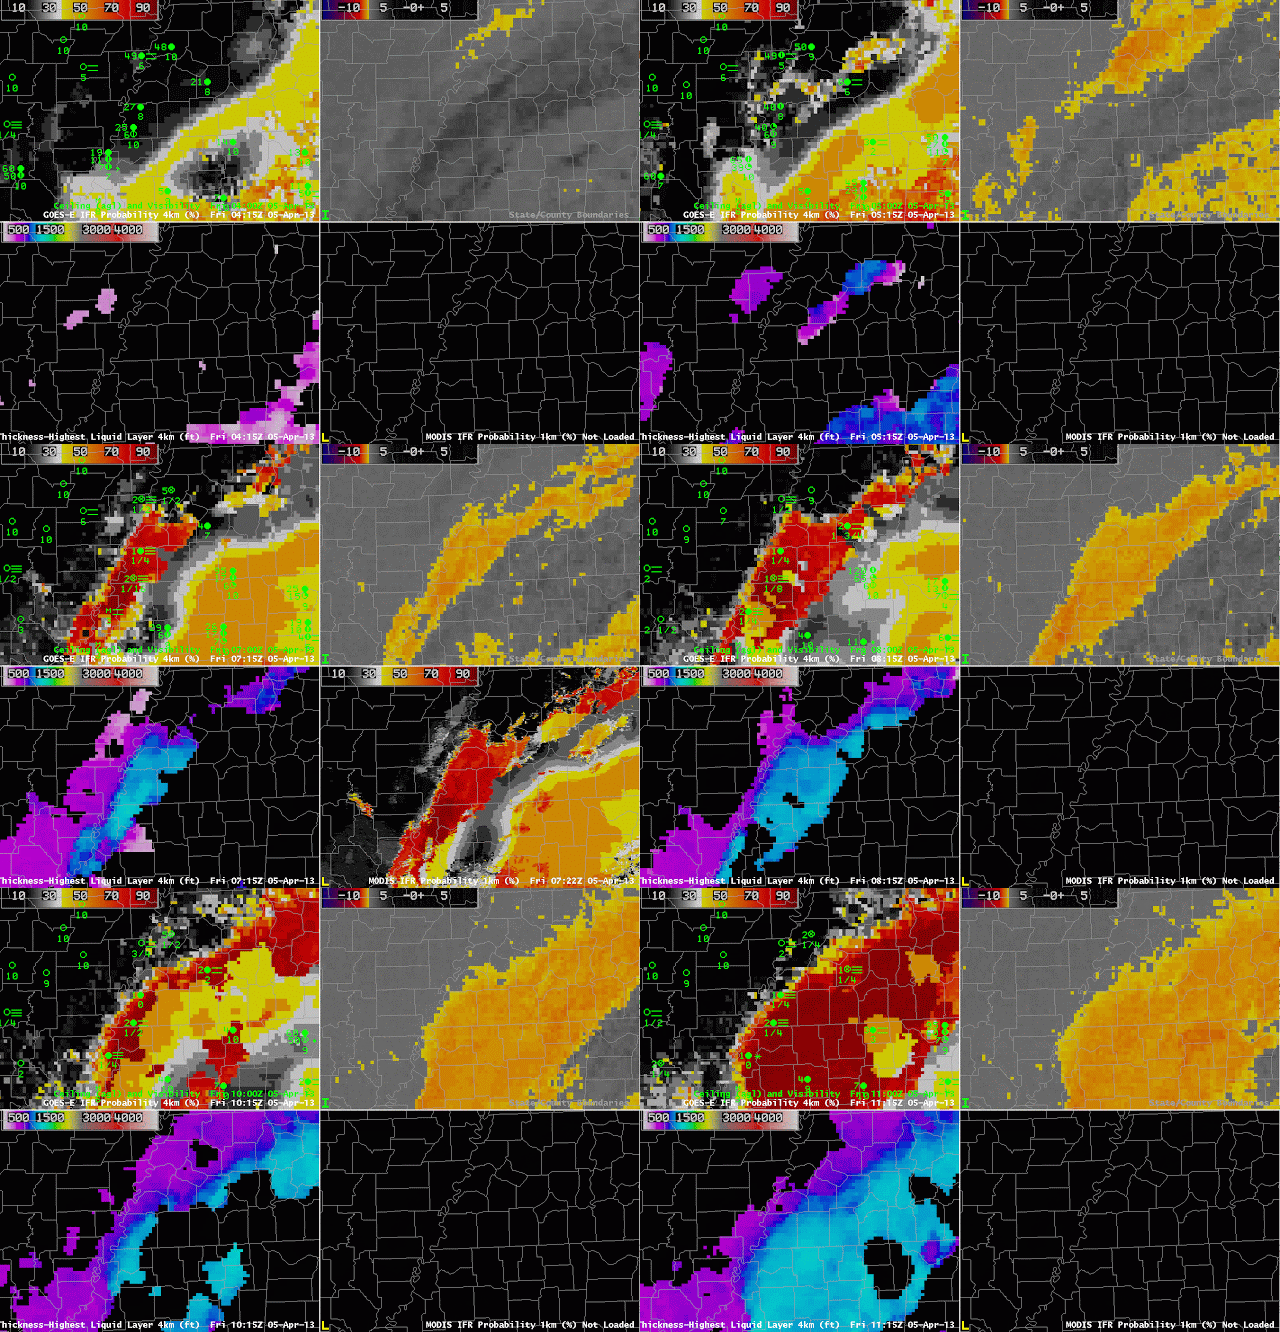
Late-in-the-day rains followed by clearing skies and light winds set the stage for radiation fog over much of western Tennessee early on April 5th. The GOES-R Cloud Thickness product allows forecasters to estimate when radiation fog will burn off.
The animation above shows the retreat of rain clouds to the south and east, and the development of radiation fog. The IFR Probabilities around 0815 UTC — both GOES and MODIS — suggest a separation between the low stratus that is over Mississippi and Alabama and the fog over western Tennessee (the stratus shifts eastward and the radiation fog quickly develops).
GOES-R Cloud Thickness can be used to predict when a radiation fog will burn off, using this chart and the final pre-twilight cloud thickness field (Cloud thickness is not computed during twilight conditions). The last cloud thickness field image produced is shown below:
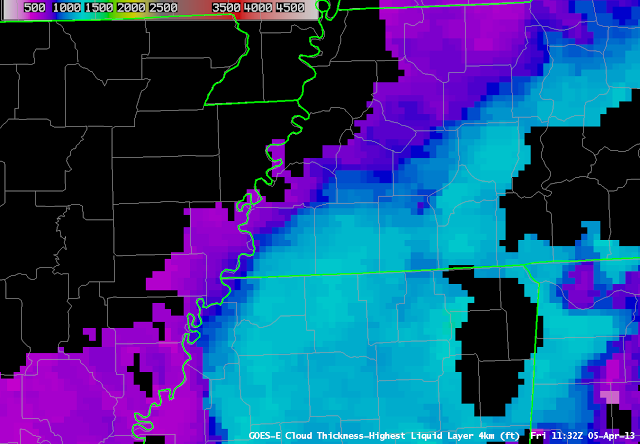 |
| GOES-R Cloud Thickness, Friday 5 April 2013 at 1132 UTC |
Fog/Cloud Thickness is greatest, a bit more than 1100 feet, in Fayette County just east of Memphis and in Henderson and Chester Counties a bit farther to the east and north. Scatterplot points on the chart suggest that the fog could burn off in 3 or so hours after the 1132 UTC image above. The visible loop animation, below, shows fog has cleared by 1432.
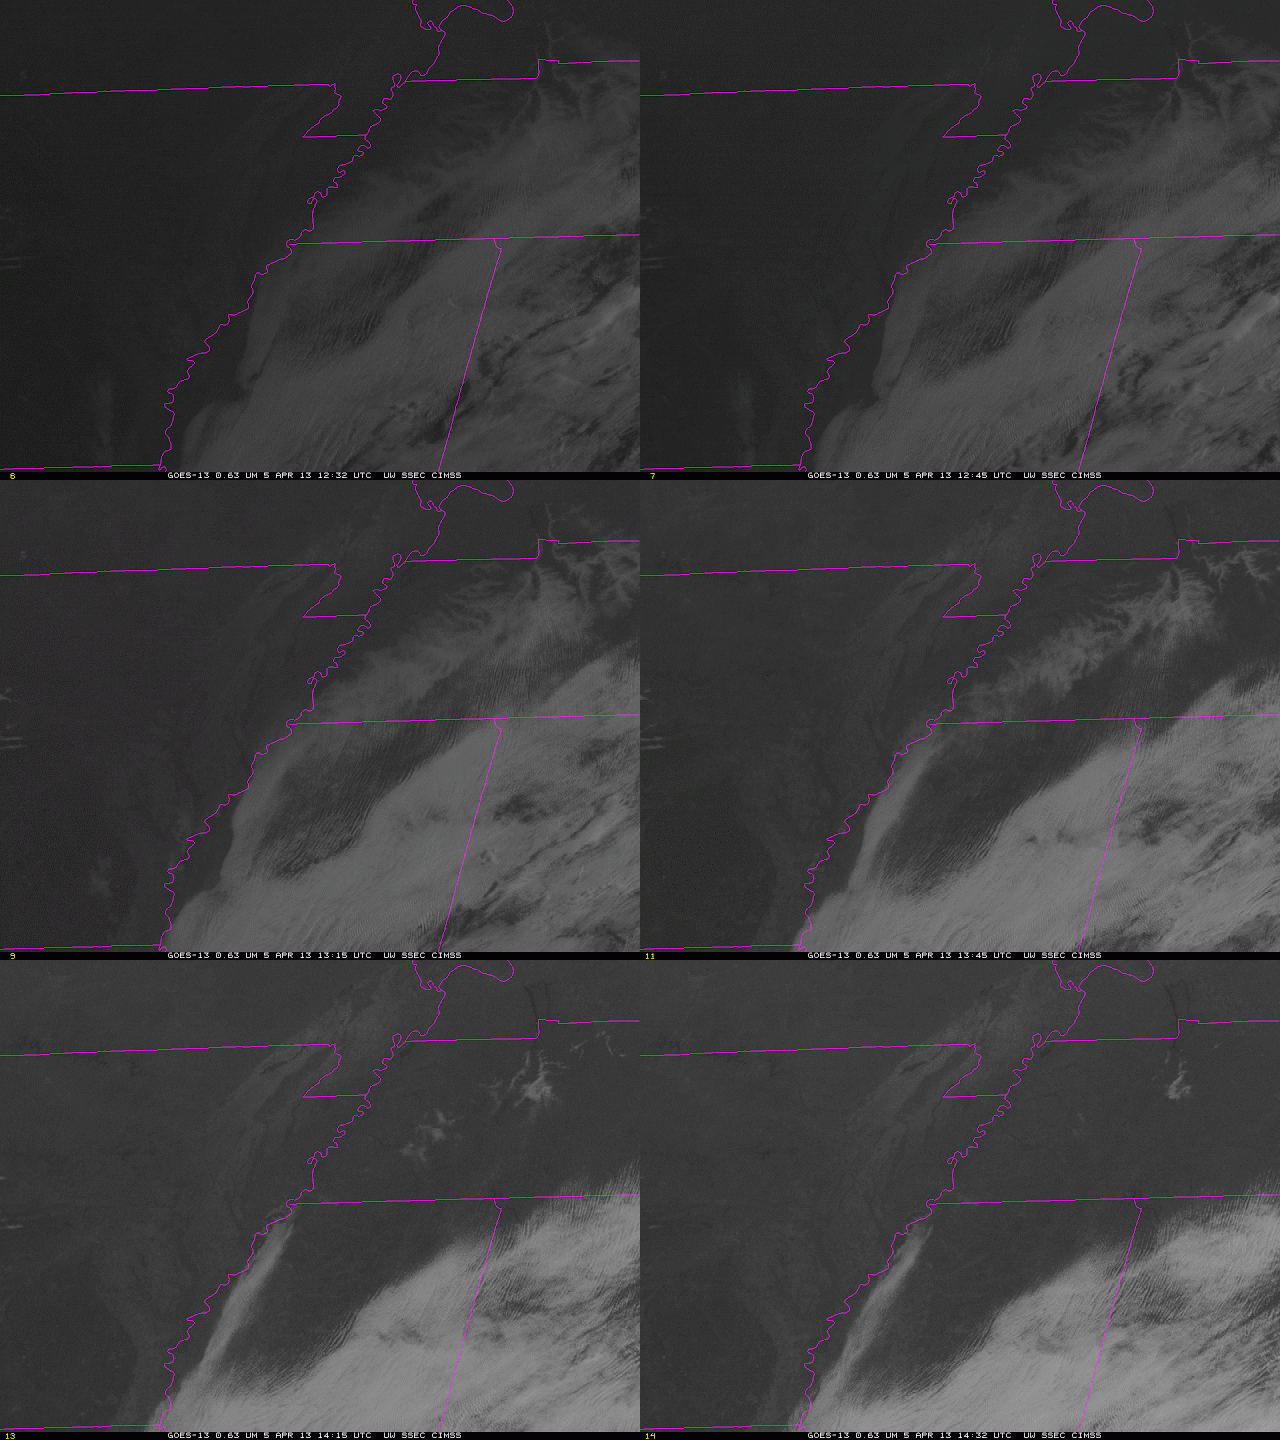 |
| Visible imagery animation, 1232-1432 UTC on April 5 2013 |
Fog Dissipation Example over California
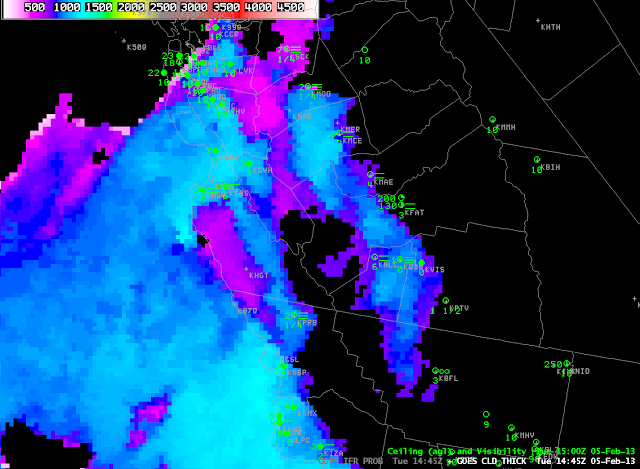 |
| GOES-R Cloud Thickness over California, 1445 UTC on 5 Feb 2013 |
GOES-R Cloud Thickness can be used to esimate when radiation fog will dissipate. In this example from central California, radiation fog has developed to a depth of around 1000 feet near Hanford, 1000 feet just southwest of Fresno, and 1100 feet near Merced. This chart shows the relationship between Cloud Thickness and burn-off time. 1000 feet correlates well with a 3-hour burn-off time; 1100 feet correlates well with a 4-hour burnoff time. The animation below, with imagery at 1800, 1830, 1900 and 1930 UTC shows that the fog around Hanford was slow to burn off — by about an hour. Fog near Merced was also slow to burn off, but high clouds moving in may have been responsible for that delay.
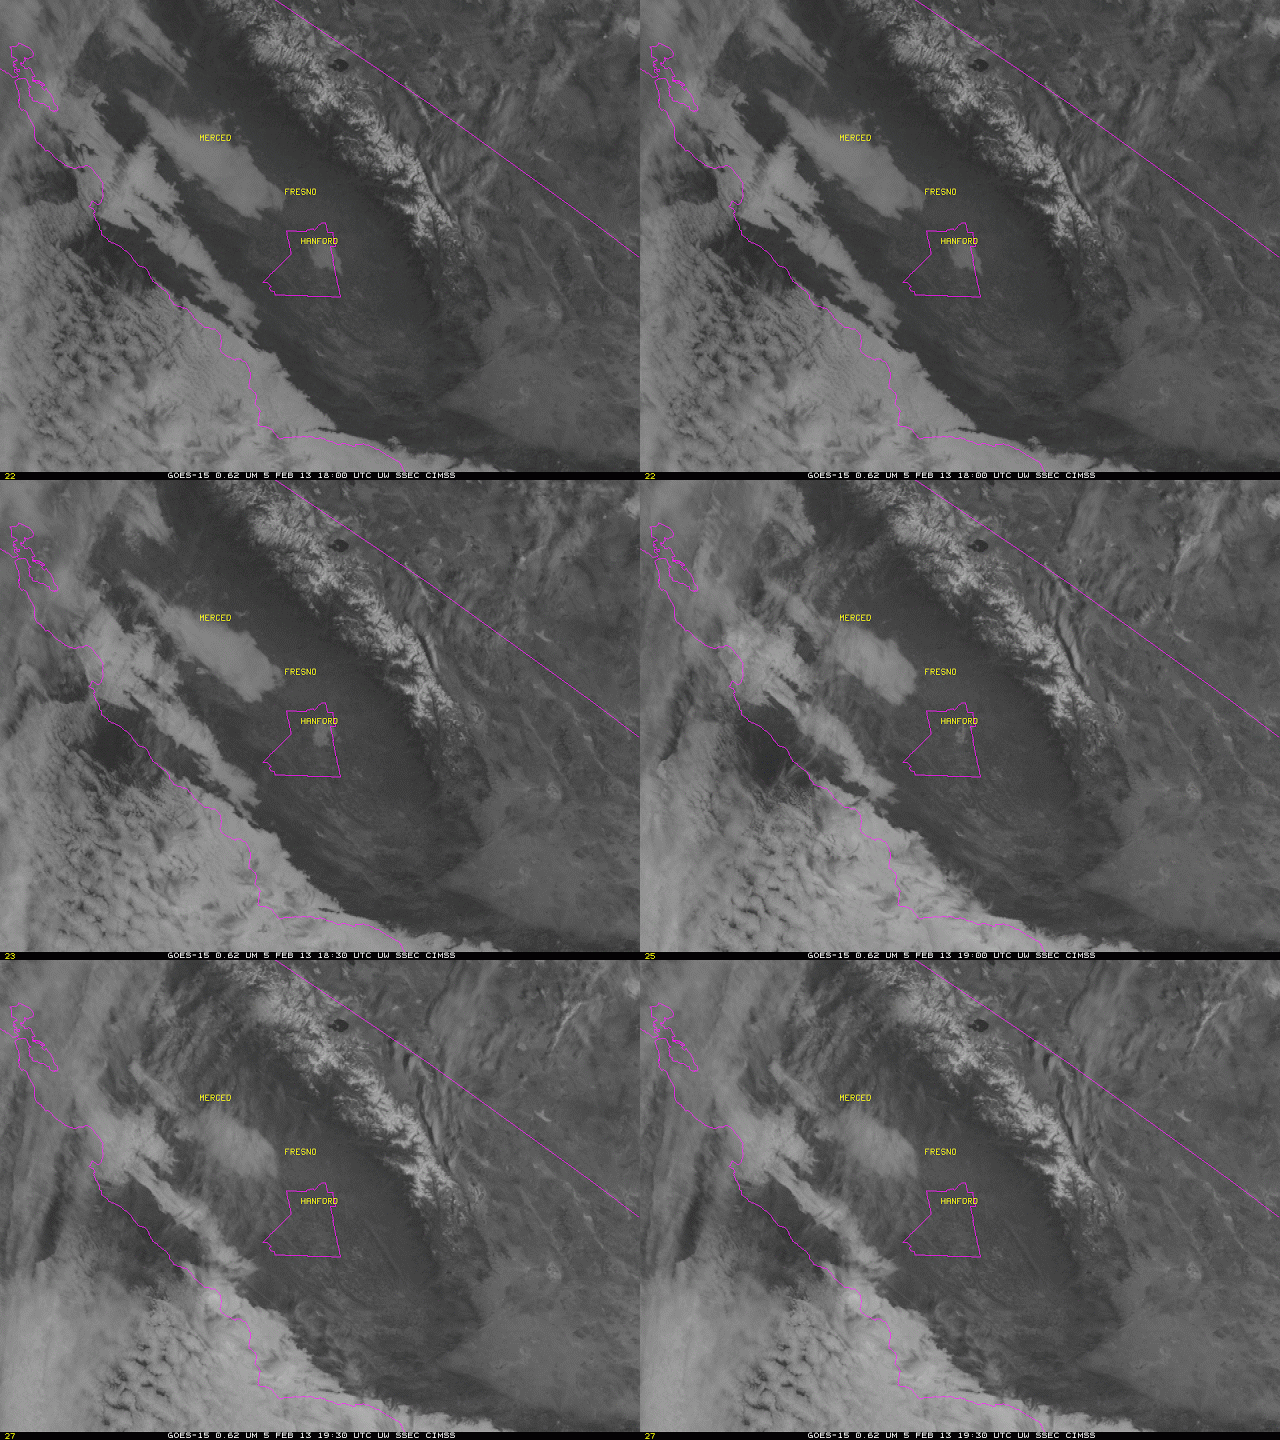 |
| GOES-15 Visible Imagery over Central California. Times as indicated. |
GOES-R vs. Heritage GOES Fog Products in Arkansas
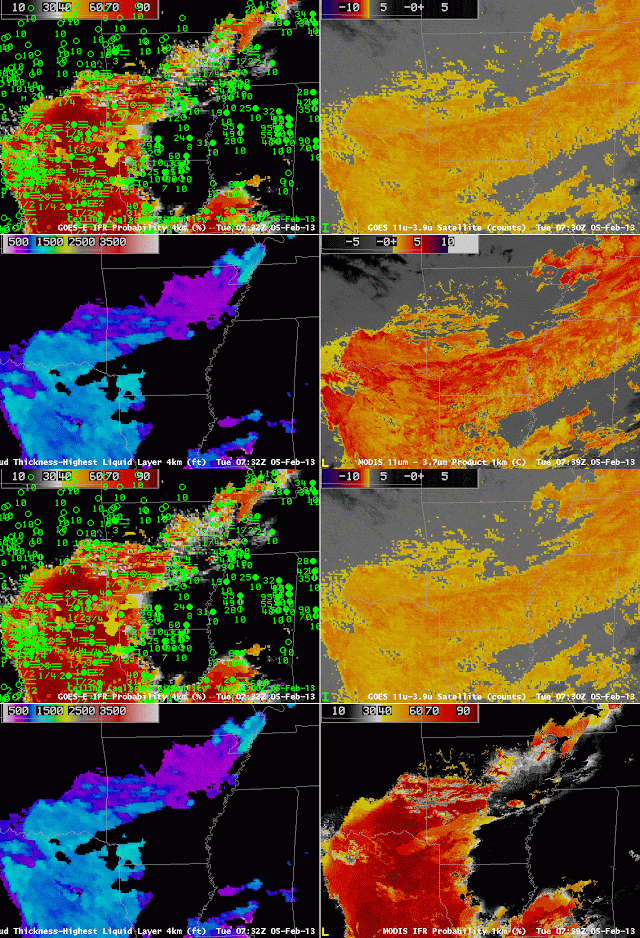
IFR conditions developed over Arkansas and surrounding states overnight from 4 into 5 February. Compare the brightness temperature difference (the traditional fog-detection product) over southeast Arkansas (where IFR conditions are not occurring) and over southwest Arkansas (where IFR conditions are present). Although the satellite signal is very similar over the region, surface observations are very different. The GOES-R algorithm distinguishes between the region with IFR conditions (east Texas, western Arkansas, northwest Louisiana) and the region without IFR conditions (southeast Arkansas, northeast Louisiana).
On the flip side, in regions over northeast Arkansas, where the brightness temperature difference product is not showing low clouds, IFR conditions are present, and the GOES-R IFR probability is elevated.
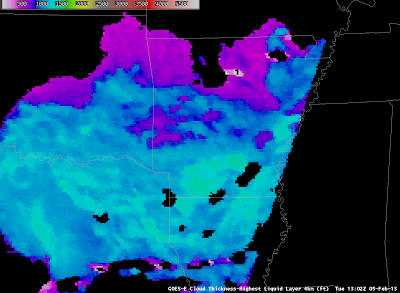 |
| GOES-R Cloud Thickness over Arkansas just before Dawn — note that dawn has arrived over Tennessee and Mississippi |
Cloud Thickness just before twilight conditions can be used to predict when radiation fog will burn off, using this scatterplot as a guide. The maximum thickness over south-central Arkansas is 1350 feet, and that thickness corresponds to 5 hours after sunrise, or sometime after 1800 UTC. The animation of visible imagery, below, shows that fog/low clouds are lingering over parts of southern Arkansas.
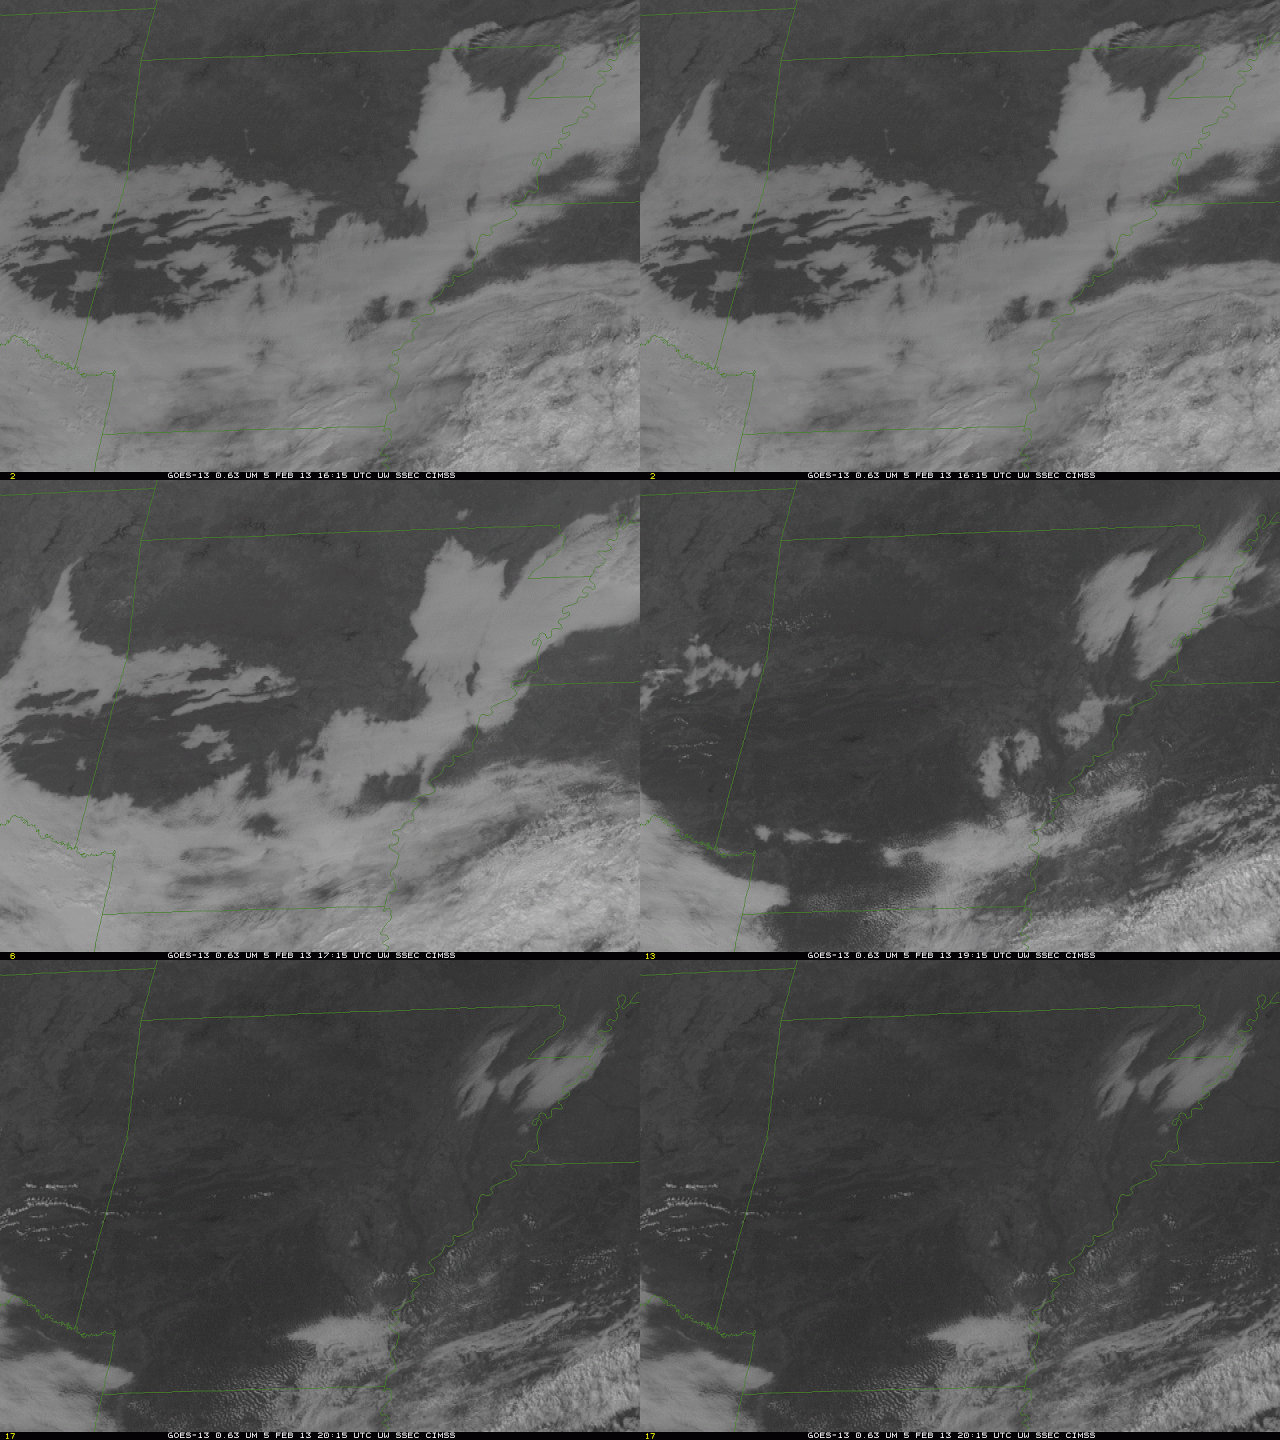 |
| GOES-13 Visible Imagery over Arkansas, times as indicated. |
Dense Fog at O’Hare
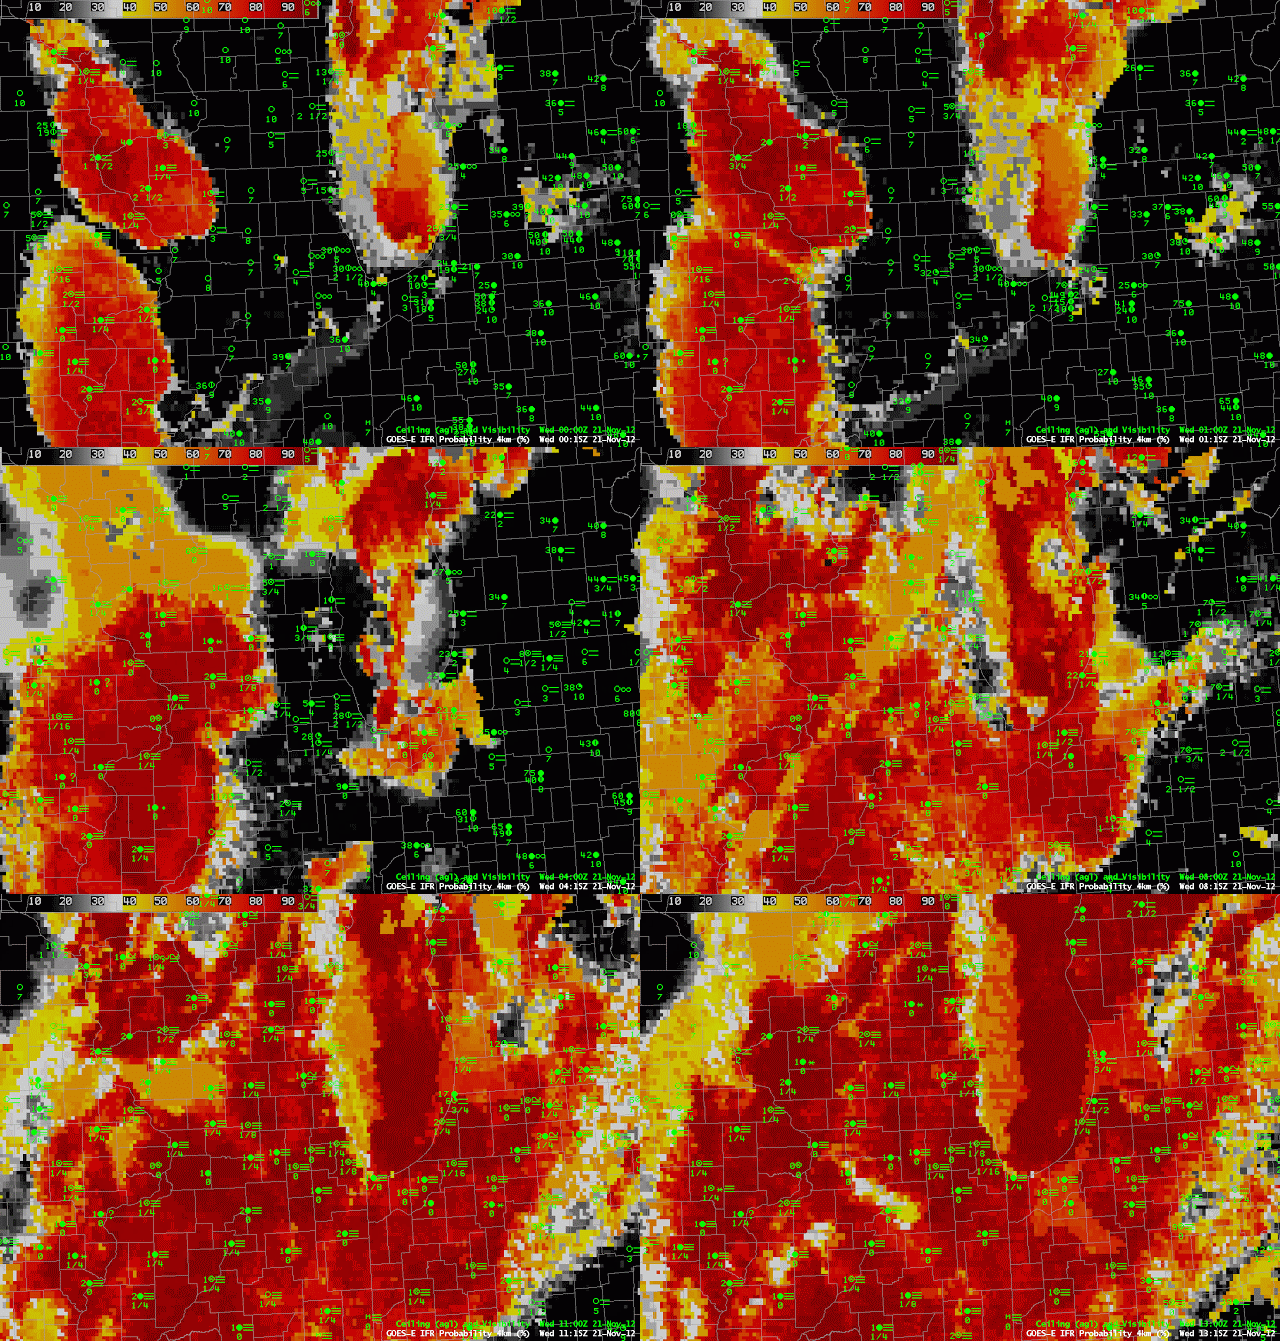 |
| GOES-R IFR Probabilities, computed from GOES-East, and surface observations of ceilings and visibilities, hourly from 00:15 UTC to 13:15 UTC on 21 November 2012 |
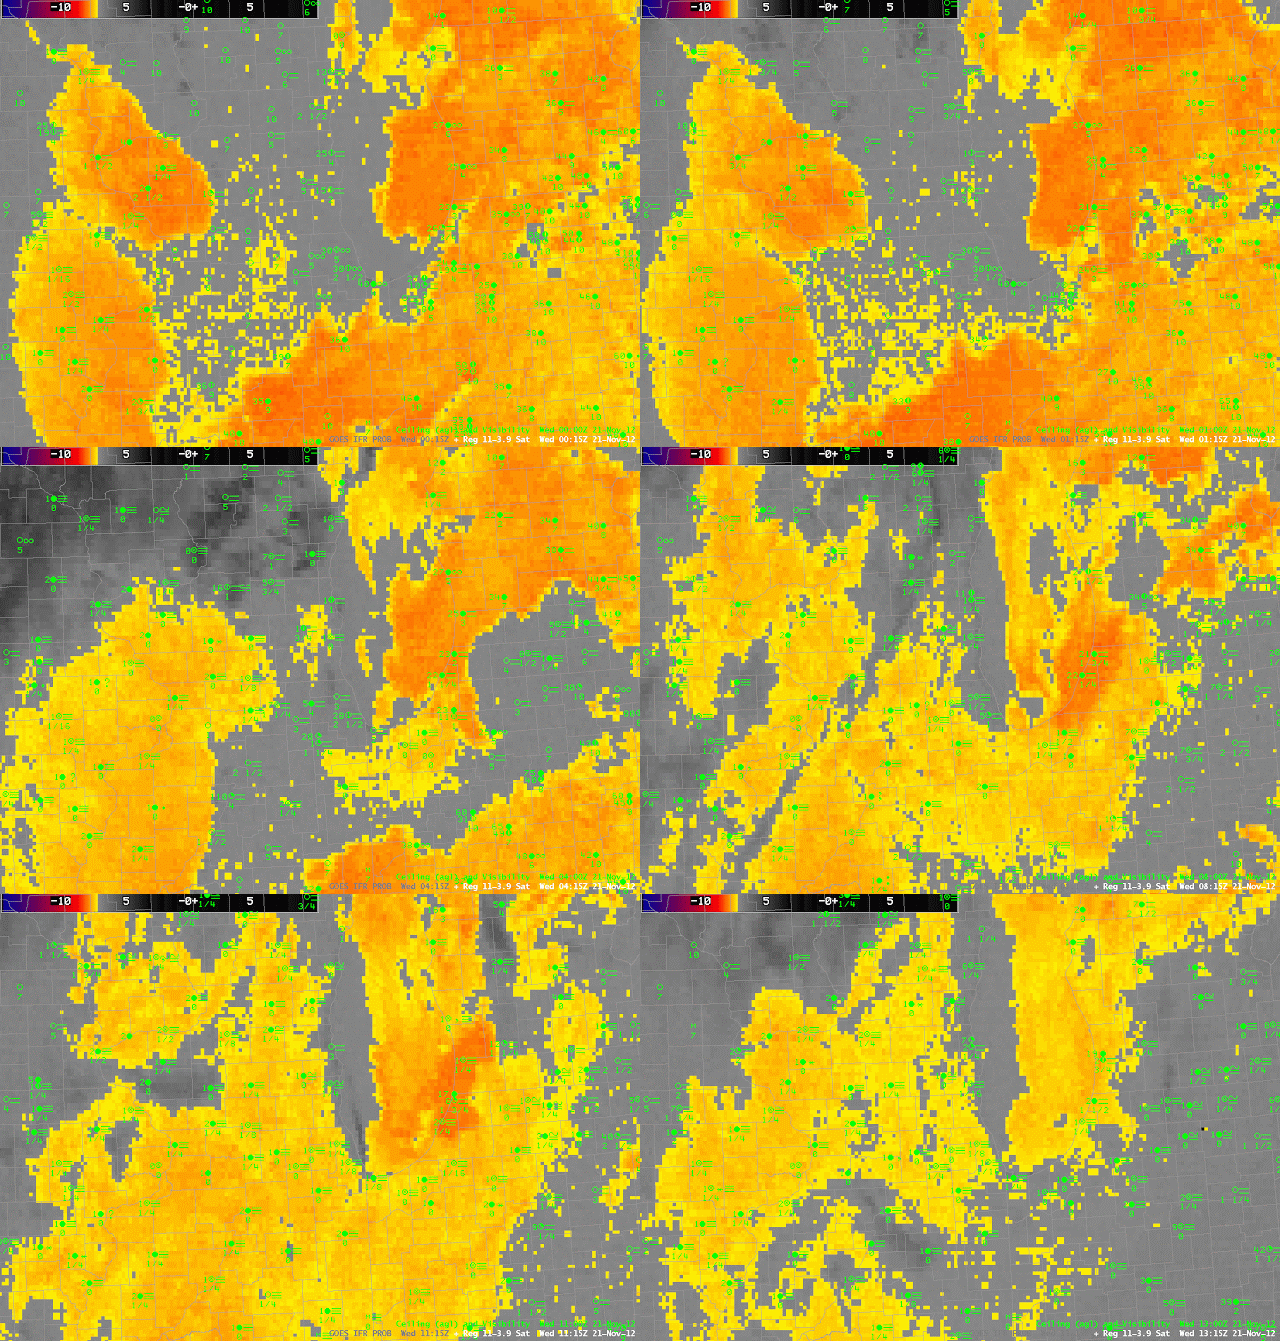 |
| Heritage Fog Detection product, that is, brightness temperature difference 10.7 – 3.9, hourly from 00:15 UTC to 13:15 UTC on 21 November 2012 |
Dense fog has developed over the midwest on one of the busiest travel days of the year. The GOES-R IFR Probabilities, top loop, above, show the fog initially over the Mississippi River Valley (this fog had actually formed the night before and persisted through the day — link) and then spreading eastward towards Chicago’s O’Hare Airport. The animation of GOES-R IFR probabilities and surface observations depicts the widespread nature of the fog. Compare the fields above to the fields of the brightness temperature difference, the Heritage Fog Detection product, just above. Several notable differences are obvious. Note, for example, that at the start of the loop, much of Michigan is covered by a strong brightness temperature difference signal, but IFR conditions are not common. The GOES-R IFR Probabilities correctly shows low probabilities of reduced visibilities under the elevated stratus deck over Michigan. There are several upper cloud features that propagate across Illinois during the course of the night. These features prevent the Heritage Cloud Product from detecting low clouds. For example — the region over southern Wisconsin at 0515 UTC. The IFR probabilities decrease in this region (and acquire the characteristically smooth appearance that arises when model predictors predominate in the computation of probabilities), and rebound once the higher clouds move off to the south and east. The 0515 UTC images for both products are below.
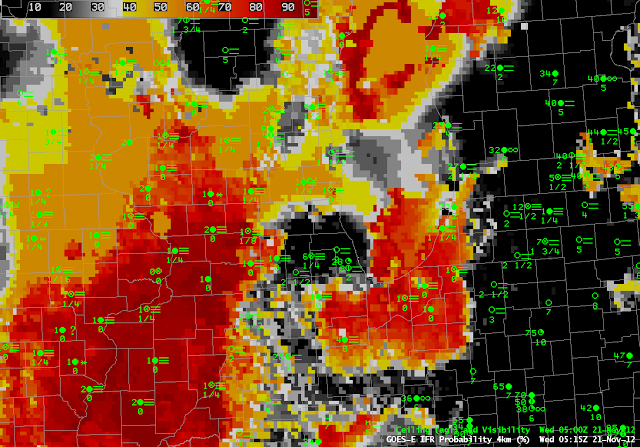 |
| GOES-R IFR Probabilities from 0515 UTC on 21 November |
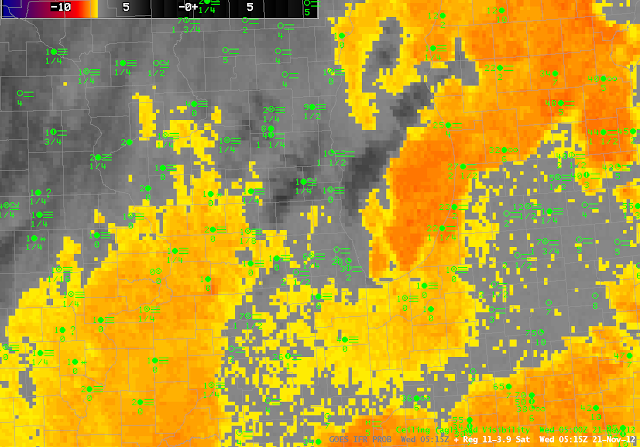 |
| Heritage Fog Detection from 0515 UTC on 21 November |
The Wednesday before Thanksgiving is a very busy travel day through O’Hare, the timing of the fog dissipation is therefore of utmost importance. The depth of the fog/low stratus at that time just before twilight conditions (when the product is not computed) can be related to dissipation time, as shown in this graph. The last cloud thickness estimate just before sunrise, below, was around 1000 feet over O’Hare, suggesting that the Fog will burn off about 3 hours after sunrise (13:00Z).
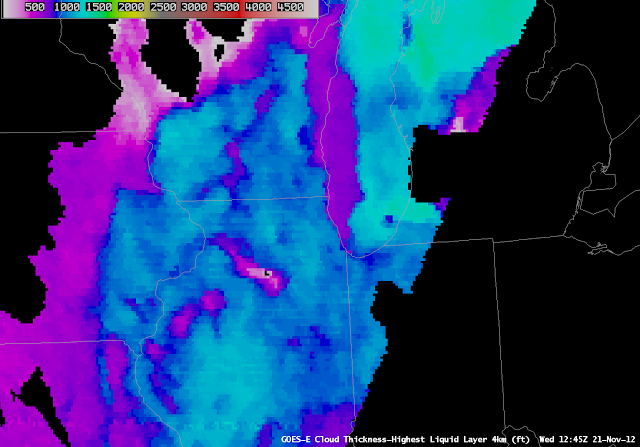 |
| GOES-R Cloud Thickness from 1245 UTC on 21 November |
The images below show the fog clearing across the area. Note how the areas where the last cloud thickness estimate before sunrise was thicker (Central Illinois and SW Wisconsin where thicknesses were close to 1200 ft) takes longer to clear than areas where the clouds were thinner (E Wisconsin and NE Illinois around O’Hare where thicknesses were around 1000 ft).
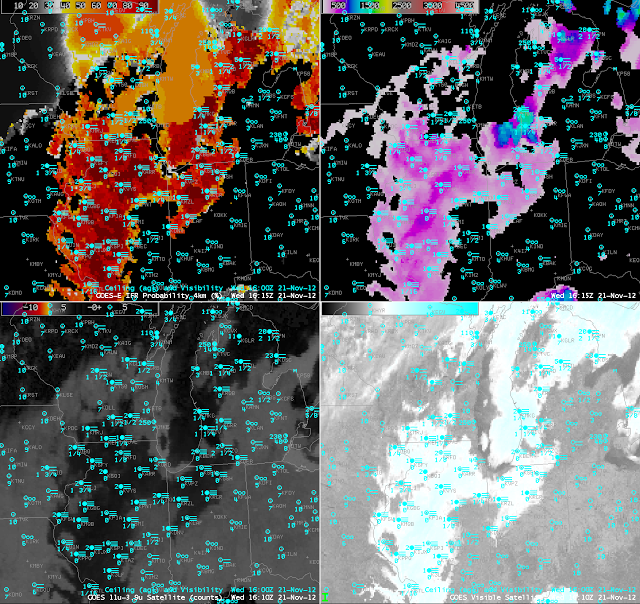
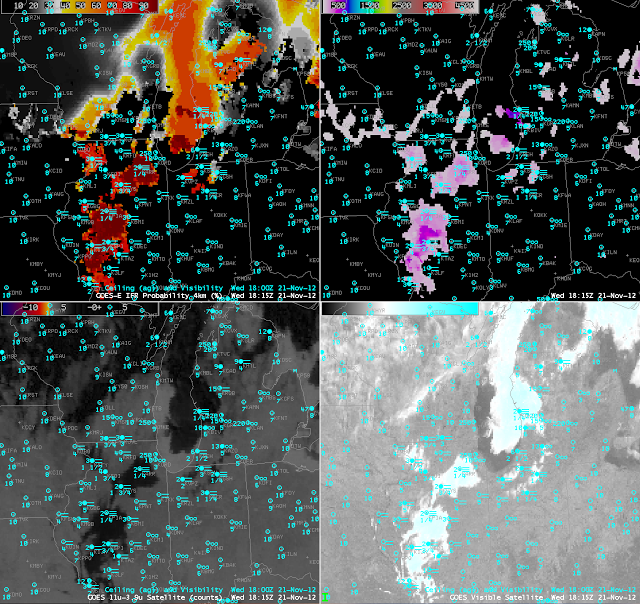
In the above image at 16:15 UTC (about 3hrs after sunrise) the fog has cleared near O’Hare, in SE Wisconsin and other areas where pre-sunrise cloud thicknesses were ~1000 ft. In the image below at 18:15 UTC (about 5 hours after sunrise) the fog has cleared everywhere except central Illinois where the largest pre-sunrise thicknesses were estimated.
|
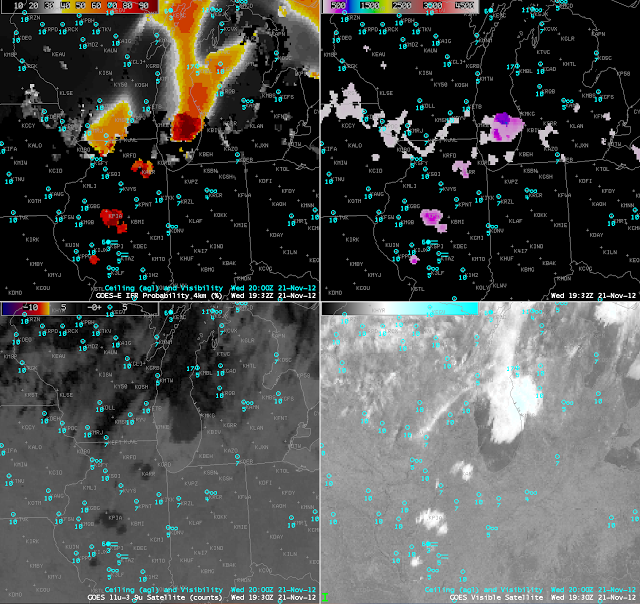
As seen below, by 19:32 UTC (about 6.5 hrs after sunrise) the last small pockets of fog finish burning off. It was noted by a NWS forecaster in Sullivan, WI that a strong low-level inversion was present that took longer to erode than usual. This likely resulted in some of these lingering areas of fog to persist a little longer than was estimated using the last pre-sunrise GOES-R cloud thickness relationship. The complete animation is available here.
|
| GOES-R IFR probabilities (top left), GOES-R cloud thickness (top right), heritage 3.9-11 micron BTD product (bottom left) and visible satellite image (bottom right) for Nov 21, 2012 at 19:32 UTC. Surface observations of ceiling and visibility are in blue. |
Fog was considerably less dense at the Lakefront in Chicago. Various web-cam captures, below, demonstrate the variable denseness of the fog in Chicago, and also in Madison, WI.
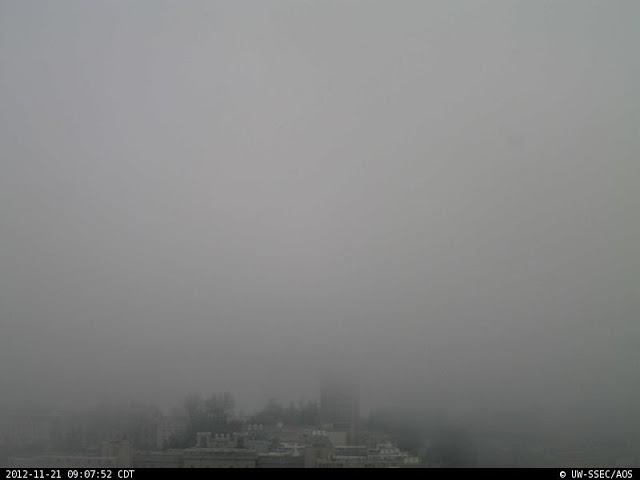 |
| North-Facing Webcam, Madison WI, time as indicated. Source. |
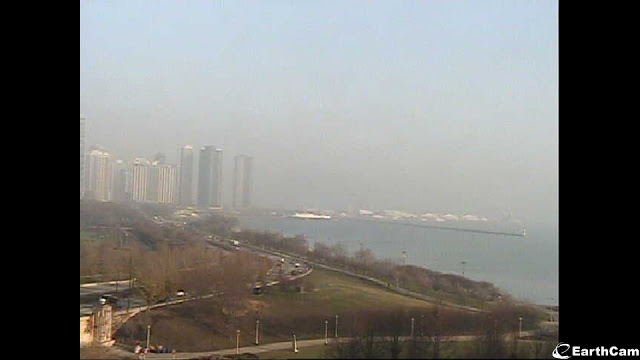 |
| North-Facing Webcam from Field Museum in Chicago, ca. 1445 UTC 21 November. Source. |
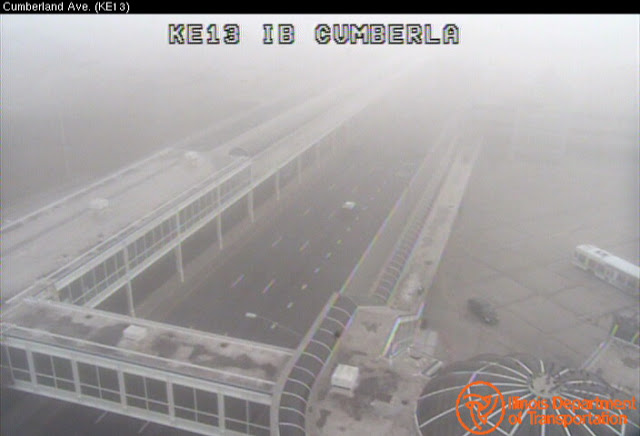 |
| Kennedy Expressway at Cumberland Ave, ca. 1445 UTC 21 November 2012. Source. |
Dense Fog over the Upper Midwest
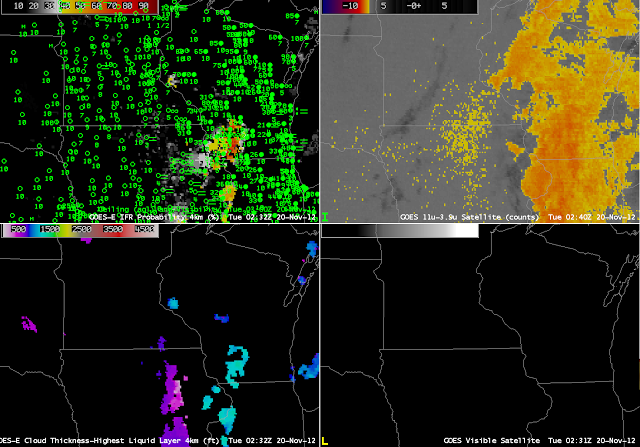
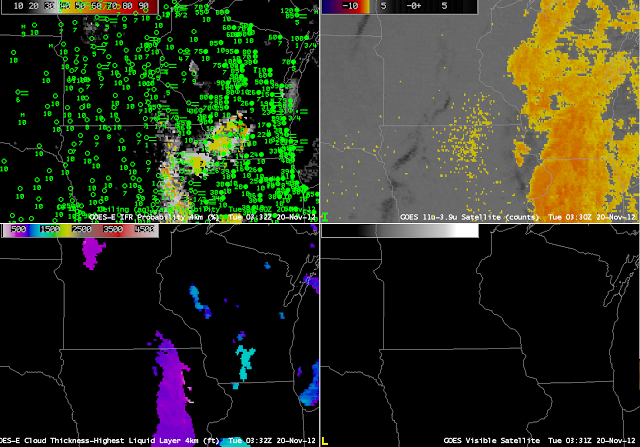
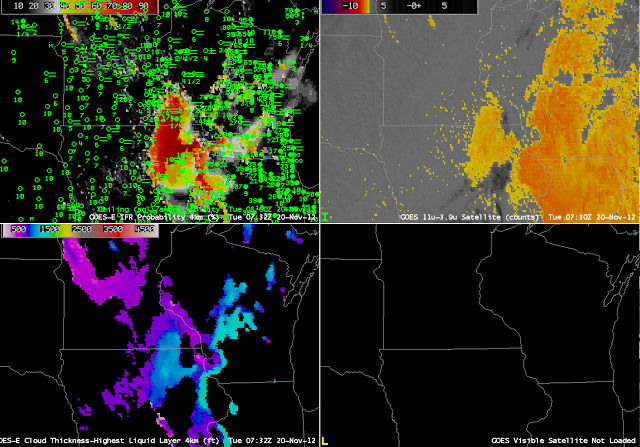
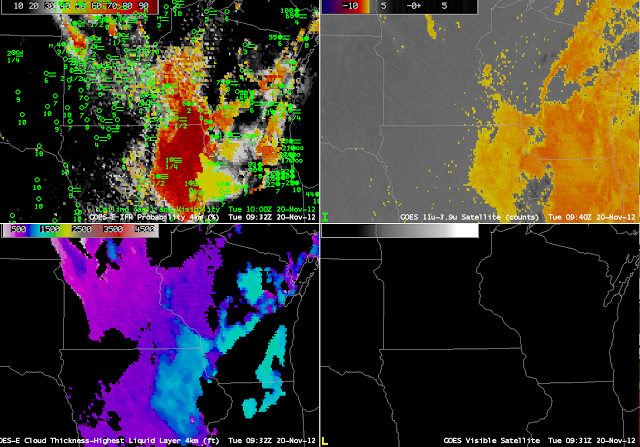
Dense fog developed over portions of the upper Mississippi Valley early in the morning on 20 November 2012. This event forced delayed openings for many eastern Iowa schools. How well did the GOES-R Fused Data products do for this event? The animation above shows the quick development of high IFR probabilities over Iowa; development over northwest Wisconsin, where IFR conditions were observed, was delayed. Why? The imagery above, from 0230 UTC, shows IFR probabilities increasing over eastern Iowa where near IFR conditions are already developing. At 0330 UTC, below, ceilings and visibilities continue to lower over eastern Iowa where IFR Probabilities increase. Note that the traditional brightness temperature difference field shows a strong signal over Wisconsin and Illinois — but IFR conditions there are not widespread, and IFR probabilities are except over southwest Wisconsin. The 0330 imagery also hints at higher clouds moving in from the west over southwest Minnesota and western Iowa/eastern Nebraska, where the darker regions in the brightness temperature difference product exists.
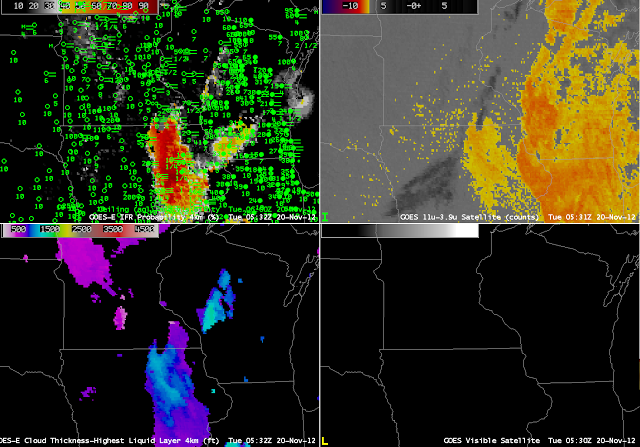
Two hours later, at 0530 UTC, IFR conditions are widespread over eastern Iowa where the traditional brightness temperature difference product has a signal, and where GOES-East-based GOES-R IFR Probabilities are very high. The Traditional brightness temperature difference signal from GOES-East continues to have a strong signal over central Wisconsin southward into Illinois where, except for southwest Wisconsin, IFR conditions are not common. Note the development of IFR conditions in northwest Wisconsin, in a region where IFR probabilities are low. In this region, satellite detection of low clouds is complicated by higher clouds (indicated by the dark region in the brightness temperature difference product). In addition, low-level relative humidity fields at this time in the Rapid Refresh model are lower than they are over Iowa (see the animation of fields used to compute IFR probabilities at the bottom of this post).
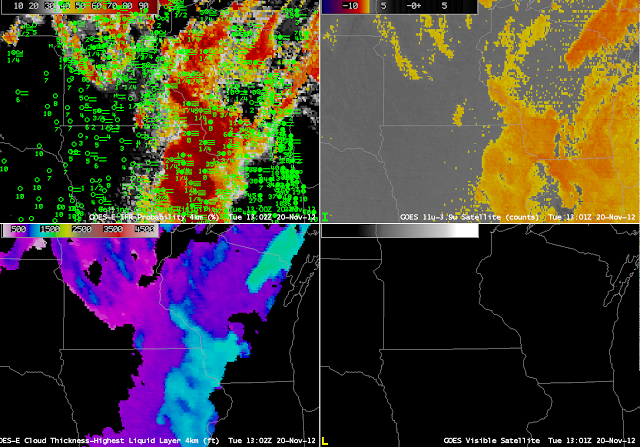
At 0730 UTC, above, mid-level clouds over eastern Iowa are having an effect on IFR probabilities there. Because satellite predictors cannot give a strong indication of fog/low stratus when mid-level (or higher) clouds are present, IFR probabilities will decrease. This is happening over portions of eastern Iowa where IFR conditions persist. Probabilities fall, and the field acquires a much smoother look; in addition, Cloud thickness is not computed. These occurrences all are a consequence of the presence of higher clouds, as depicted by the darker grey enhancement in the traditional brightness temperature difference field. Note that IFR probabilities continue to be fairly low over northwest Wisconsin where IFR or near-IFR conditions are present.
By 0930 UTC, IFR probabilities finally do increase over northwest Wisconsin where IFR or near-IFR conditions are present (similarly, they increase over eastern Wisconsin near Lake Michigan). Both the satellite signal and the Rapid Refresh signal have started to suggest low clouds near the surface, as observed. An animation of fields important to the computation of IFR probabilities is below. Note how the near-surface relative humidity saturates first over eastern Iowa; that saturation is slow to spread northward into northwest Wisconsin.
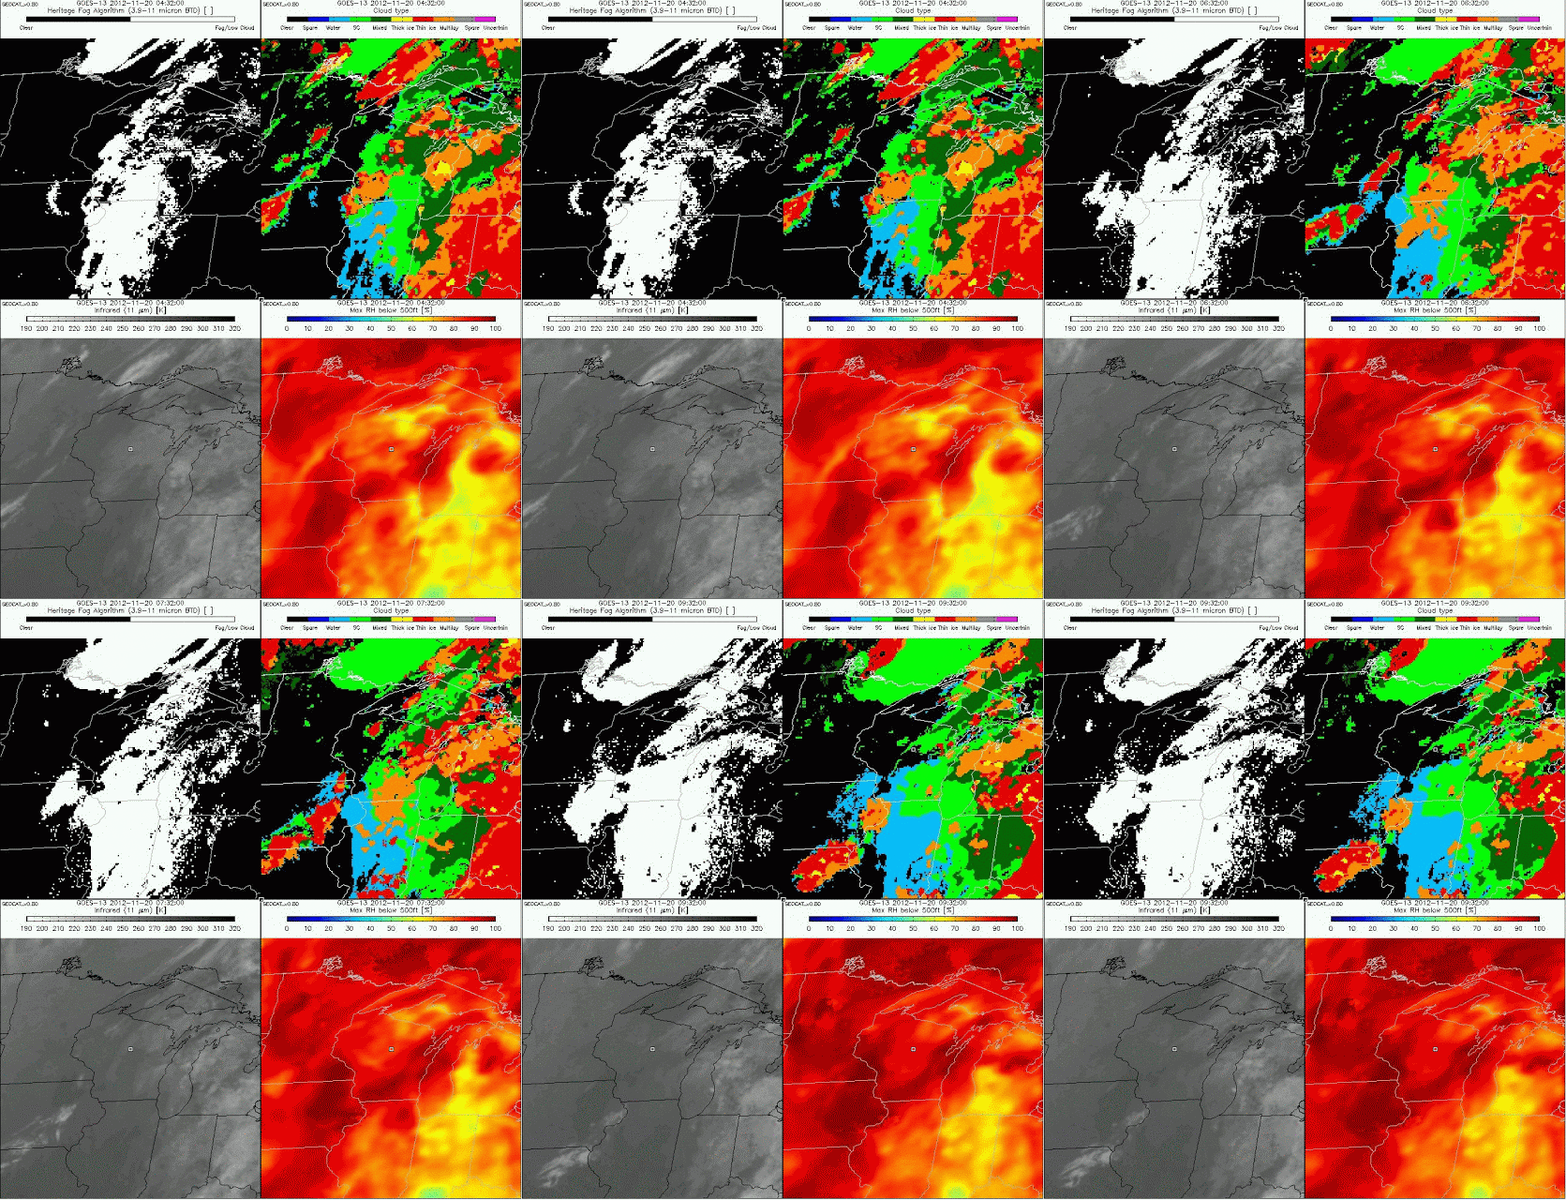 |
| Heritage Fog Algorithm (10.7 µm – 3.9 µm ) from GOES-East (upper left, white = fog/low stratus), GOES-R Cloud Type (upper right), GOES-East 10.7 µm imagery (lower left), Peak Rapid Refresh Model Relative Humidity below 500 m (lower right), hourly from 0432 UTC through 0932 UTC, 20 November 2012. Data from this site. |
The last pre-twilight Cloud Thickness product can be used to guess the dissipation of radiation fog. Those data are shown below. Cloud thickness over eastern Iowa and southwest Wisconsin peaks around 1200 feet. This graph suggests, then, a dissipation time about 5 hours after sunrise.
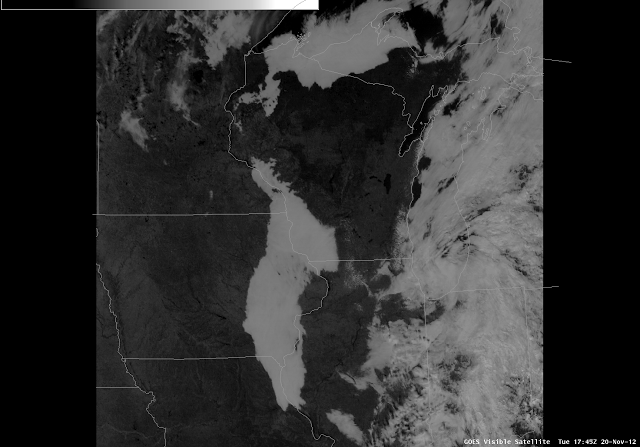 |
| GOES-East Visible Imagery, 1745 UTC |
Note how well the low clouds over eastern Iowa at 1745 UTC align with the cloud thickness field at 1300 UTC!
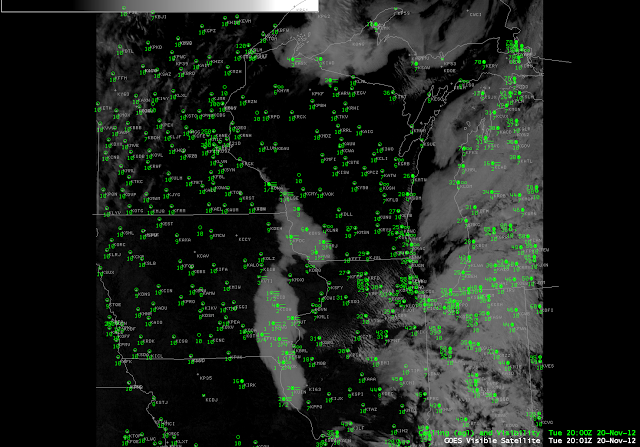 |
| GOES-East visible imagery and station ceilings/visibilities, 2002 UTC |
(Update: The low sun angle of mid- to late-November is making it difficult for the fog to burn off. As of 2000 UTC, stratus persists)
Cloud thickness as a predictor of Fog Dissipation
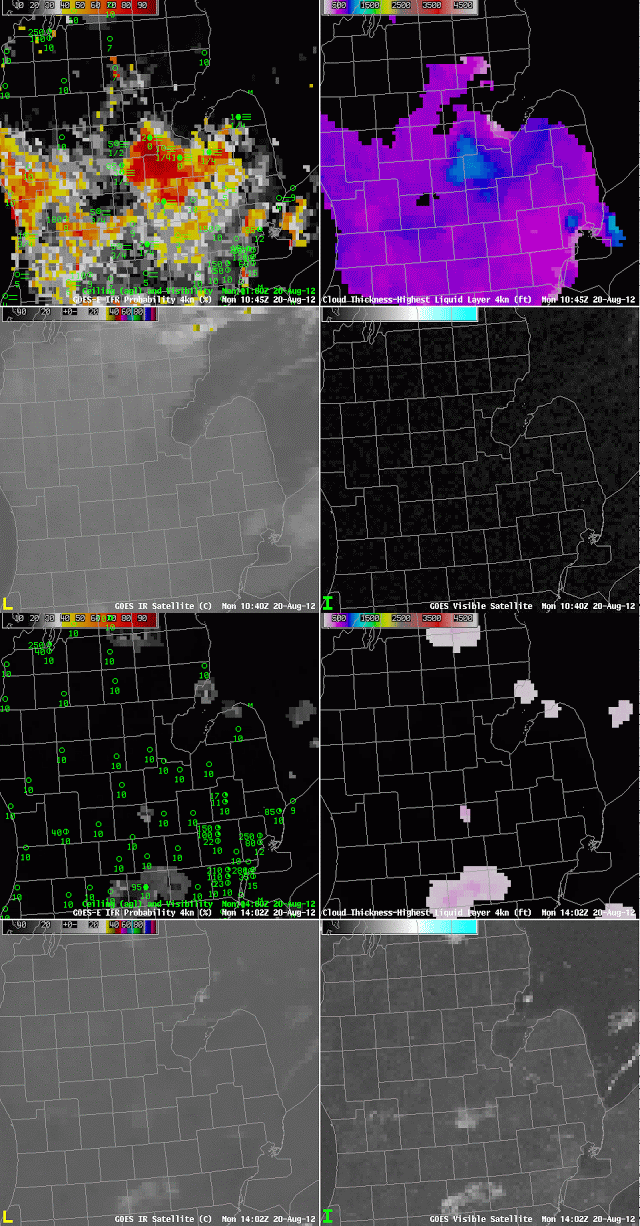 |
| GOES-R IFR Probabilities (Upper Left), GOES-R Cloud Thickness (Upper Right), GOES-East 10.7 µm imagery (Lower Left) and GOES-East 0.63 µm (Visible) imagery (Lower Right)m at 1045 and 1402 UTC |
Radiation fog occurred over central Lower Michigan near Saginaw overnight into the morning of the 20th of August, and the thickest fog is indicated at 1045 UTC — just before sunrise — to be just shy of 1000 feet thick. This fog bank slowly shifted southward, and dissipated shortly after 1400 UTC, one county south of its location at 1045 UTC. That dissipation time neatly fits in with the graph of fog thickness vs. dissipation time shown here.
Radiation Fog over Kansas
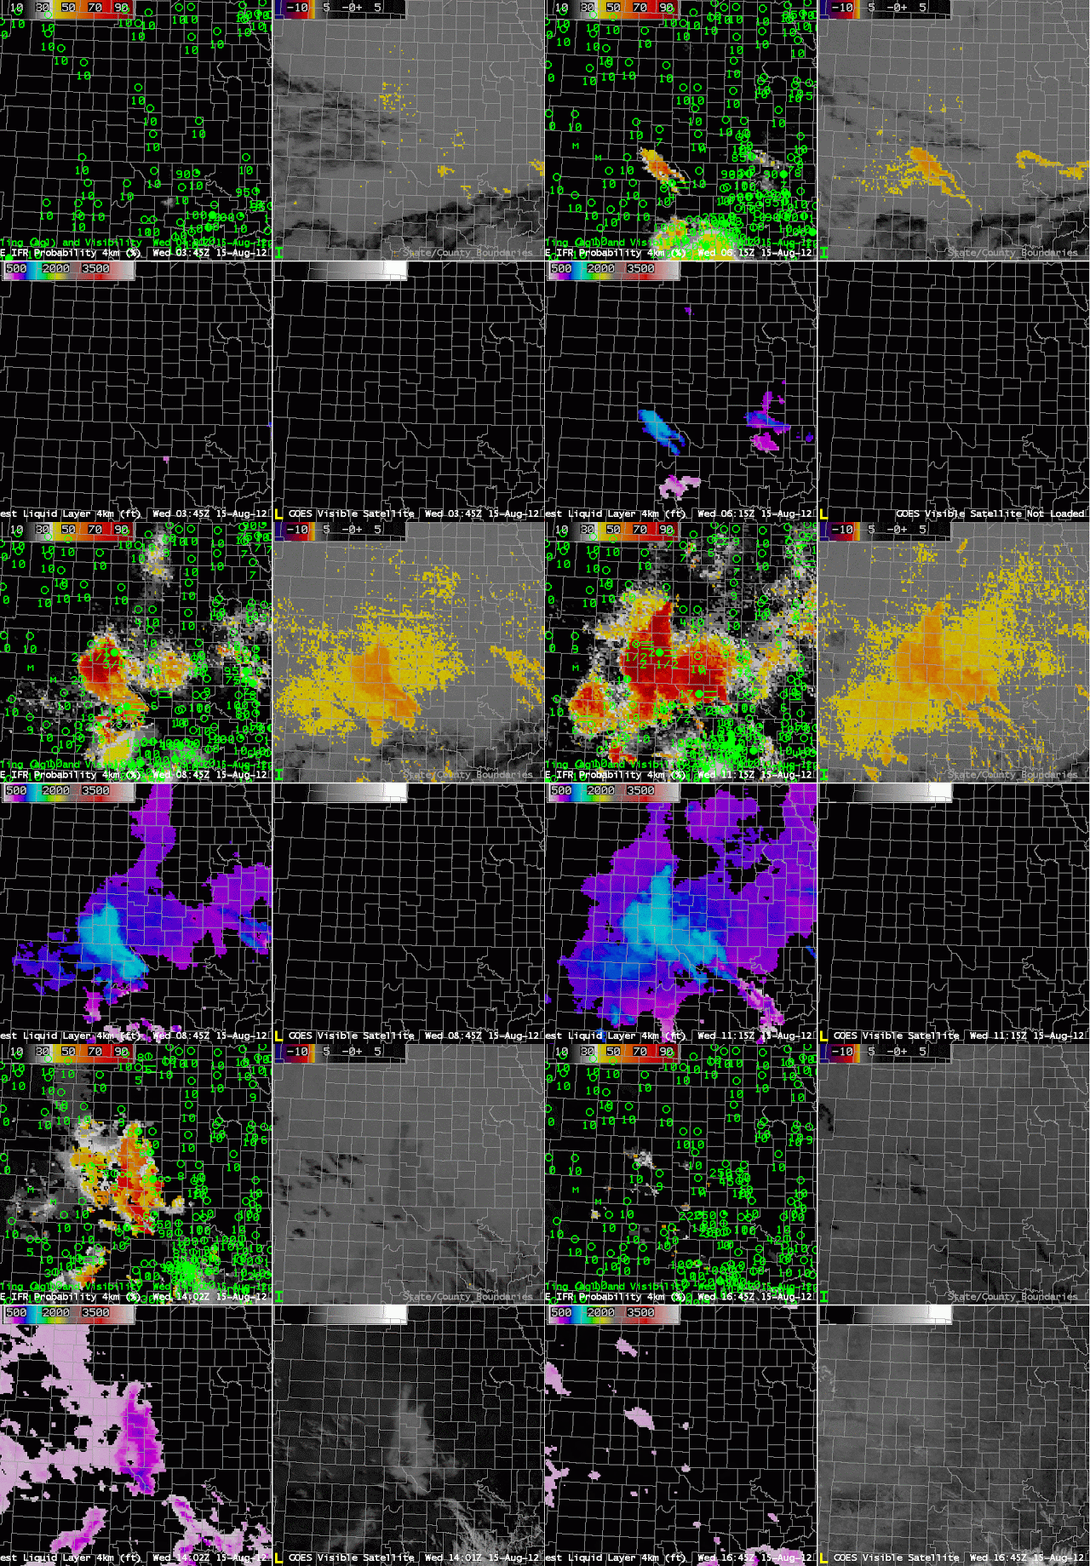
Radiation fog that developed over Kansas early in the morning of August 15th highlights the strengths of the GOES-R IFR algorithm. IFR probabilities are highest in regions where the satellite signal — the brightness temperature difference — is strong; IFR probabilities are reduced in regions where the model signal is not strong. Thus, IFR probabilities are generally highest in regions where IFR conditions are observed. In the loop above, high IFR probabilities do not extend into central Kansas where a satellite signal does exist. In addition, the GOES-R IFR imagery at 0502 UTC does not include the sudden expansion in areal coverage (likely due to stray light) that appears only at that time. The IFR Probability signal persists through sunrise (in contrast to the Brightness Temperature Difference signal that flips sign as the sun comes up). GOES-R Cloud thickness peaks around 1200 feet at the last image before twilight; according to this chart, that suggests that the radiation fog will burn off more than 4 hours after sunrise. The last fog did not dissipate until shortly after 1600 UTC.

