GOES-R IFR Probability Fields, 0100-0500 UTC on 31 October 2016 (Click to enlarge)
GOES-13 Brightness Temperature Difference Fields (3.9 µm – 10.7 µm), 0100-0500 UTC on 31 October 2016 (Click to enlarge)
Compare the two animation from 0100-0500 above, showing GOES-R IFR Probability fields (top) and GOES-13 Brightness Temperature Difference fields (bottom) from shortly after sunset on 30 October 2016 until Midnight. IFR Probability shows very little signal at first, and IFR conditions are rare (Jack Edwards Airport near Gulf Shores AL report IFR conditions). IFR Probabilities increase slowly in the next 4 hours, especially in regions where IFR conditions develop. In contrast, the trend in the Brightness Temperature Difference field is a slow decrease in areal coverage with little spatial correlation between a strong signal and IFR reports. These animations demonstrate a strength of IFR Probabilities: By combining satellite information with Rapid Refresh predictions of low-level saturation, a better estimate of visibility restrictions can be created.
Subsequent to 0500 UTC, in the animations shown below, IFR Probability fields expanded as IFR conditions developed over western Louisiana and southern/eastern Texas; a strong signal develops in the brightness temperature difference field in these regions as well. Note the lack of signal in the GOES-R IFR Probability field over Alabama and Mississippi where Brightness Temperature Difference fields show a consistent signal (and where IFR Conditions are not present). Brightness Temperature Difference signals over those states may be related to changes in emissivity properties that occur during severe drought, as discussed here.
GOES-R IFR Probability fields, 0500-1215 UTC on 31 October 2016 (Click to enlarge)
GOES-13 Brightness Temperature Difference Fields (3.9 µm – 10.7 µm), 0500-1215 UTC on 31 October 2016
GOES-R Cloud Thickness relates future dissipation of fog to present observations of Cloud Thickness. The last pre-sunrise GOES-R Cloud Thickness field is related to dissipation time in this scatterplot. (GOES-R Cloud Thickness is not computed during twilight times surrounding sunrise and sunset) The animation below shows the thickest clouds over south-central Texas; fog over Louisiana and coastal Texas is comparatively thin. Dissipation should occur last over interior Texas.
GOES-R Cloud thickness every half hour from 1145-1245 UTC on 31 October 2016 (click to enlarge)
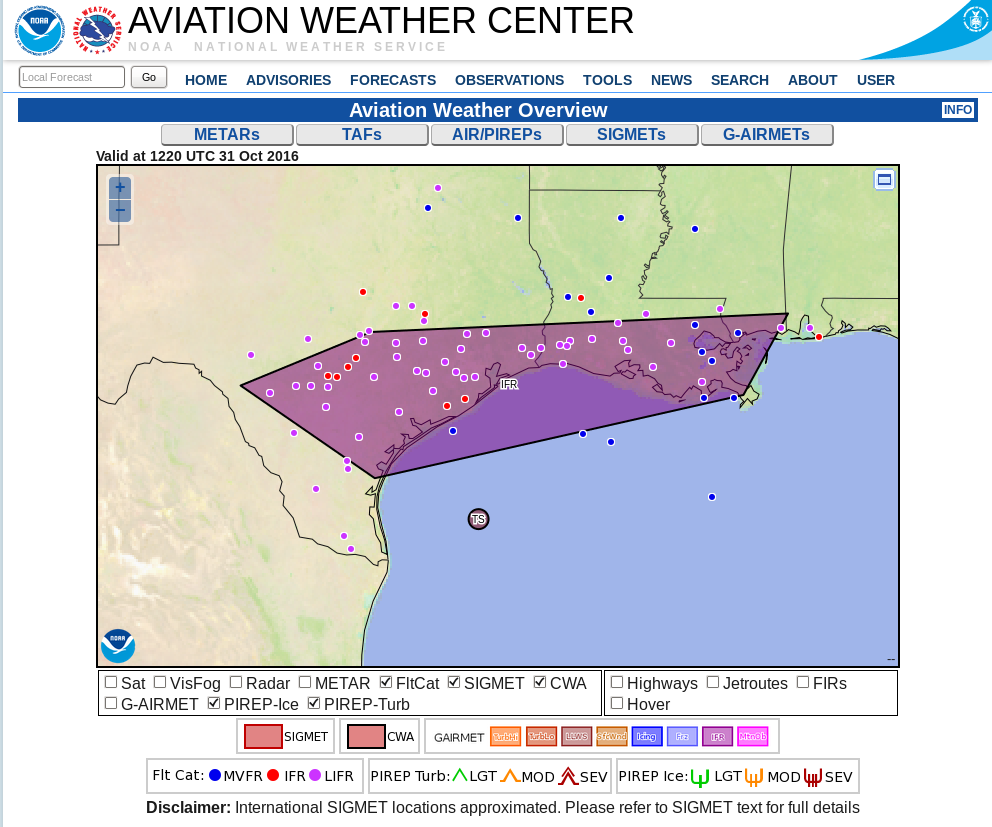
IFR probabilities were noted by the Aviation Weather Center, and Dense Fog Advisories were issued along the Gulf Coast for this case.