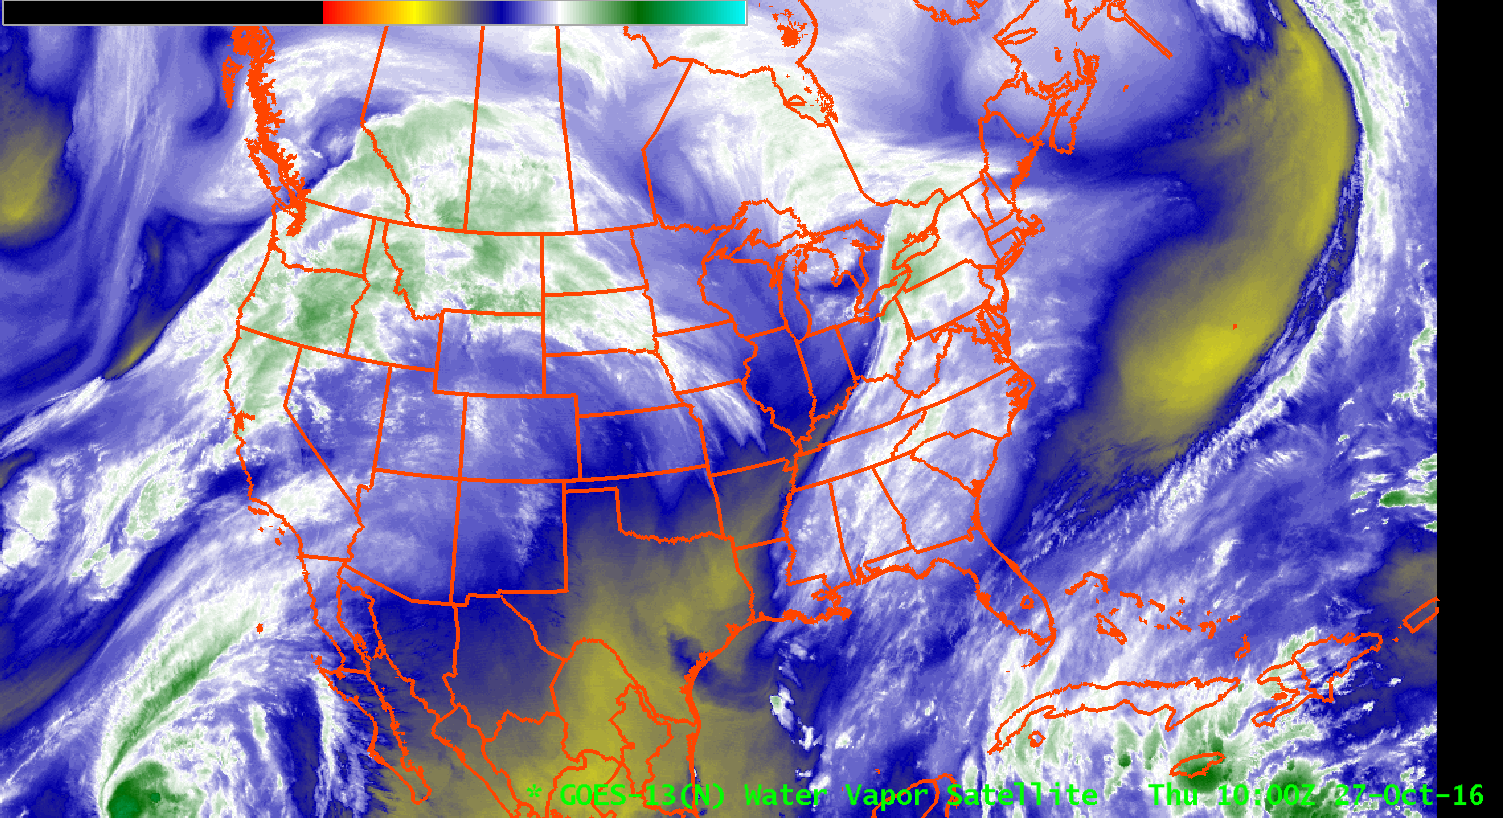
GOES-13 Brightness Temperature Difference (3.9 µm – 10.7 µm) fields, hourly from 0215-1215 UTC on 27 October (Click to enlarge)
If you rely on satellite data alone to anticipate the development of IFR conditions — fog, low ceilings, and reduced visibilities — then the presence of widespread cirrus, shown here with the GOES-13 6.5 µm image, makes situational awareness difficult. At a glance, can you tell in the animation of brightness temperature difference, above, hourly from 0215 through 1215 UTC, where IFR Conditions are occurring? The widespread cirrus, present in the enhancement as dark grey and black, prevents the satellite from viewing any fog development, hence making this brightness temperature difference field, traditionally used to detect the development of fog and low stratus, unsuitable for large-scale situational awareness.
GOES-R IFR Probability fuses satellite data with Rapid Refresh Model output and allows a product that in essence peeks beneath the cirrus because near-surface saturation predicted in the Rapid Refresh Model allows the IFR Probability product to have a strong signal where fog might be developing. Consider the animation below, that covers the same spatial and temporal domain as the brightness temperature difference animation above. IFR Probability increases over inland southeast Georgia in concert with the development of low ceilings/reduced visibilities. It gave a few hours alert to the possibility that IFR conditions would be developing. Note in the animation below that the 1215 UTC image includes IFR Probabilities computed using daytime predictors and nighttime predictors. There is therefore a discontinuity in the field values over central Georgia at 1215 UTC, the end of the animation.
Compare the animation below to the one above. Which yields better situational awareness for the developing fog field?
GOES-R IFR Probability Fields, hourly from 0215 through 1215 UTC on 27 October (Click to enlarge)
The Aviation Weather Center plot (below) highlights the presence of an IFR SIGMET over the region at 1324 UTC on 27 October.
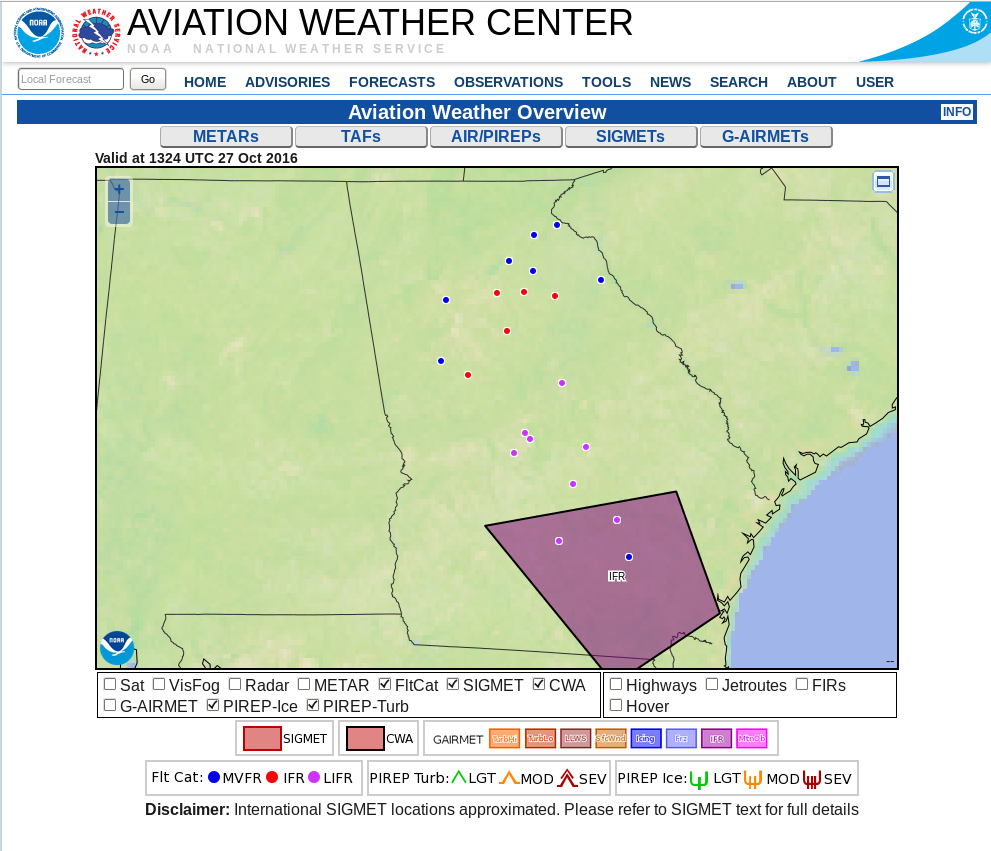
Aviation Weather Center plot showing MVFR, IFR and LIFR stations over Georgia, along with an IFR Sigmet at 1324 UTC 27 October 2016 (Click to enlarge)