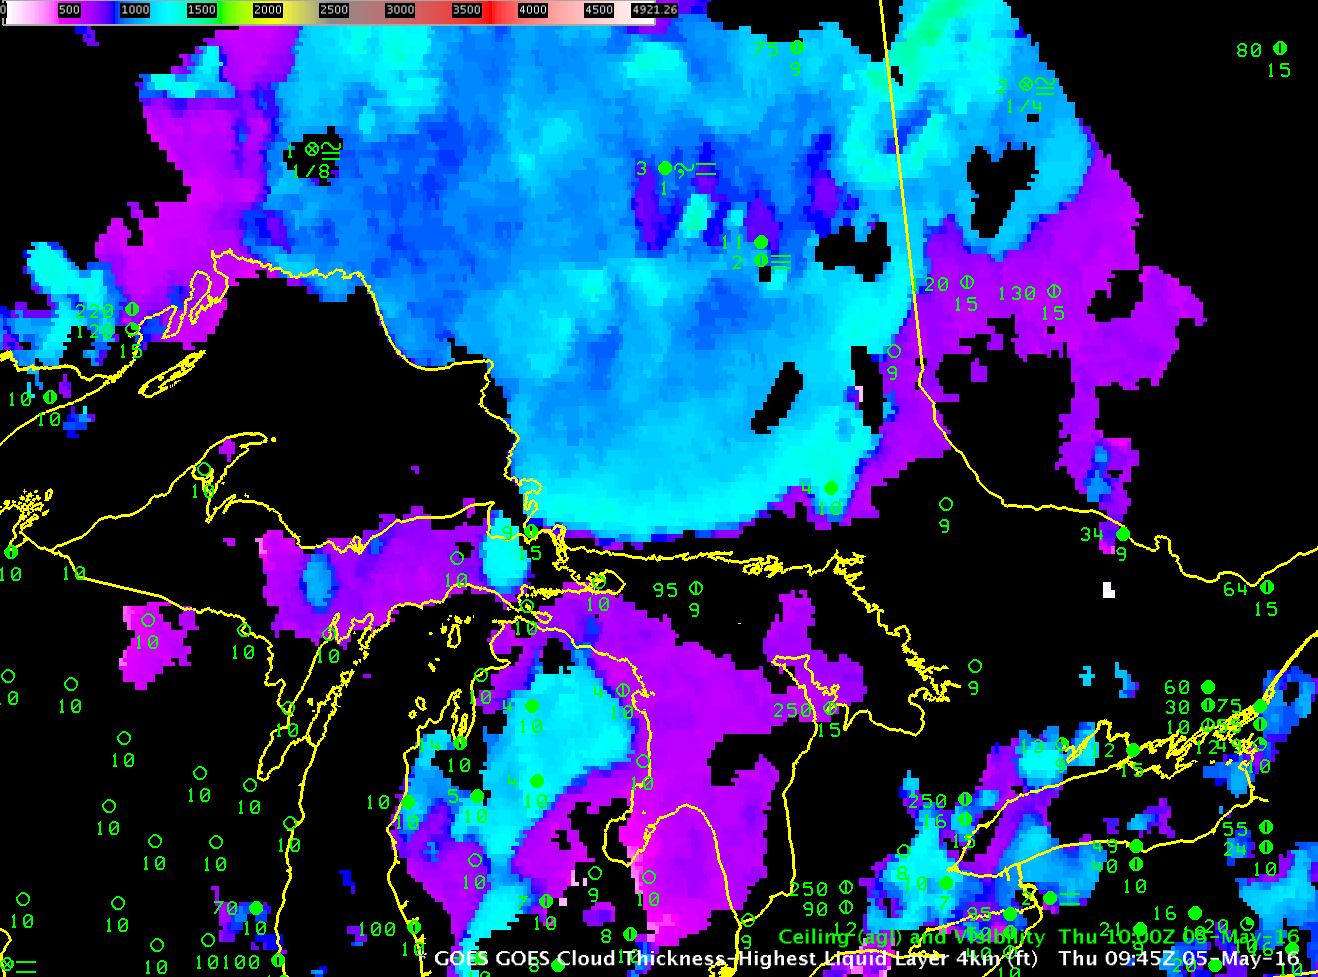
GOES-R Cloud Thickness, 0945 UTC on 5 May 2016. Note that Cloud Thickness is not computed in the northeast corner where twilight has begun. This is last scene for northern Ontario and Michigan. (Click to enlarge)
GOES-R Cloud Thickness can be used to make a first guess of when fog and low clouds will dissipate. This is done via a look-up table that is derived from this scatterplot. The y-axis on that plot is the last GOES-R Cloud Thickness field produced before sunrise, such as that shown above, and the x-axis is the number of hours after the plot that clearing is expected, GOES-R Cloud Thickness relates 3.9 µm emissivity to dissipation time based on SODAR observations from off the West Coast, and the scatterplot was derived mostly from observations over the southeast US; the thickness is that of the lowest water-based cloud field and it’s not computed where multiple cloud layers exist — near Geraldton north of Lake Superior, for example, where IFR Conditions are reported — or near sunrise/sunset. Values are between 1100 and 1200 feet over northern Lower Michigan, around 1200 feet over eastern upper Michigan, and around 1200 to as much as 1490 feet over northwest Quebec. The scatterplot suggests a dissipation time of nearly 4 hours, which would be 1345 UTC.
Imagery below shows low clouds persisting just past 1500 UTC. For this region where the sun angle is not as high as over the southeast US (where most of the observations used for the scatterplot creation were taken), burn-off took a bit longer. However, note that GOES-R Cloud Thickness did highlight the thickest clouds that took the longest to dissipate; so, although the scatterplot underestimated the time of dissipation, Cloud Thickness values did identify which regions would clear last.
A final note: GOES-R Cloud Thickness Dissipation times were computed for Radiation Fog Events, such as the one on 5 May 2016. Dissipation of other fogs that create IFR conditions — Advection Fog, Tule Fog — will not be forecast well with this technique.
GOES-13 Visual (0.63 µm) imagery, 1115-1515 UTC on 5 May 2016 (Click to enlarge)