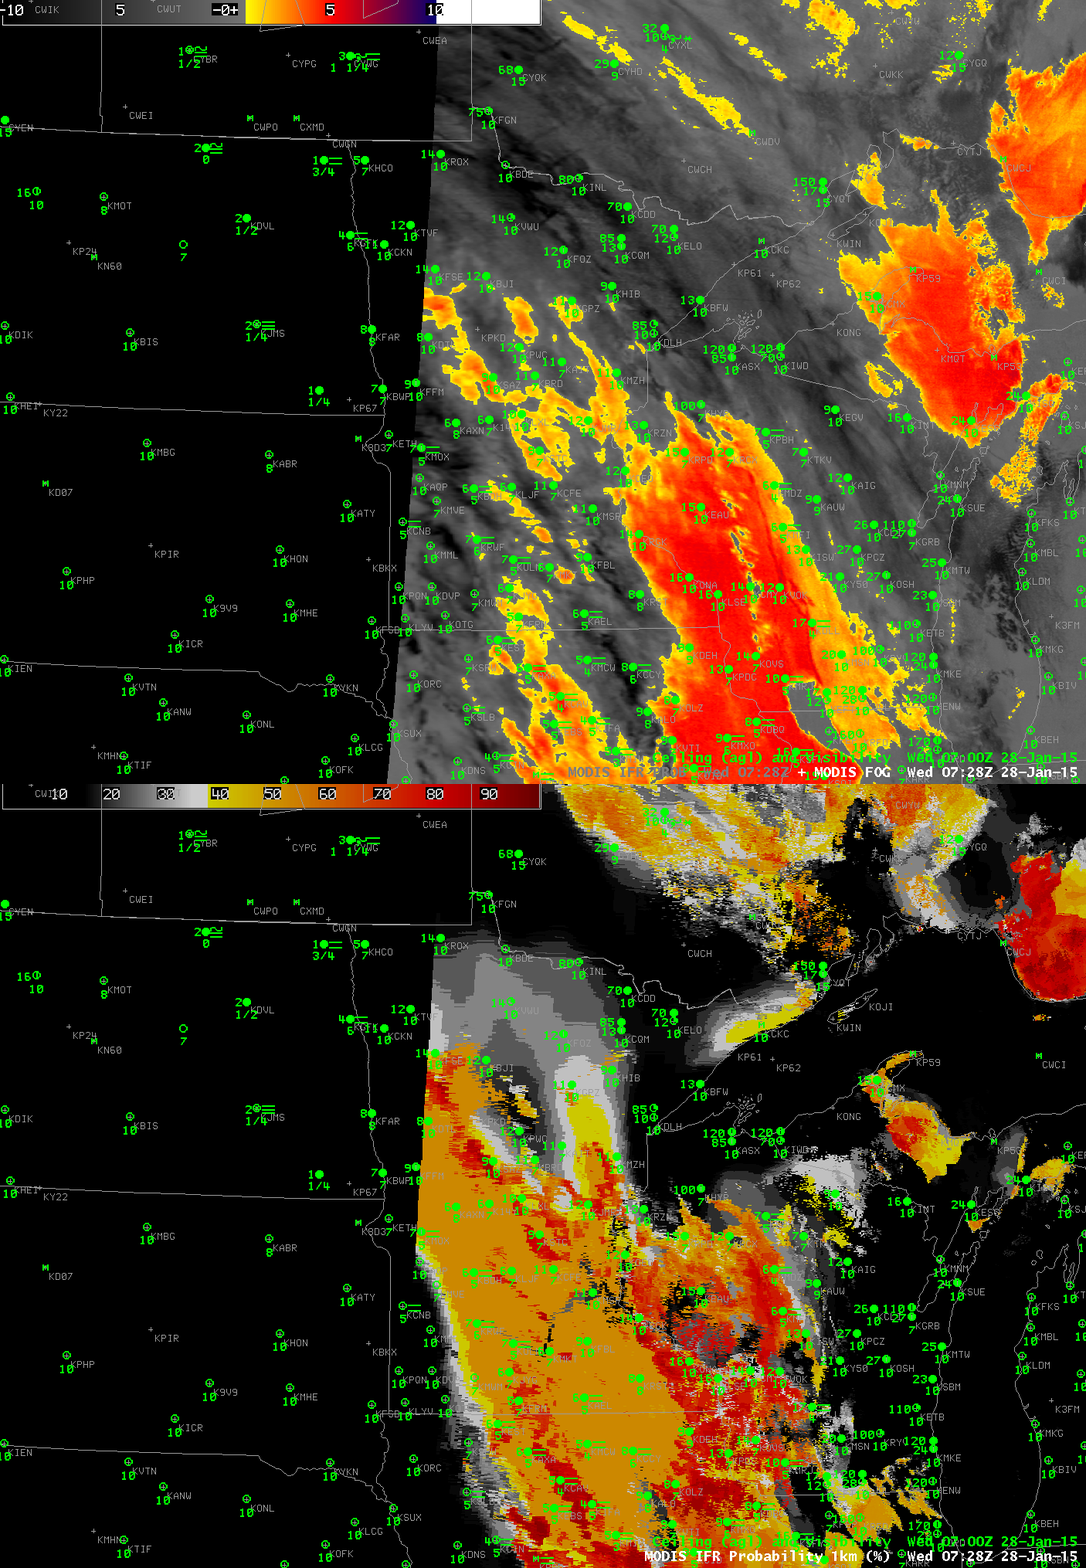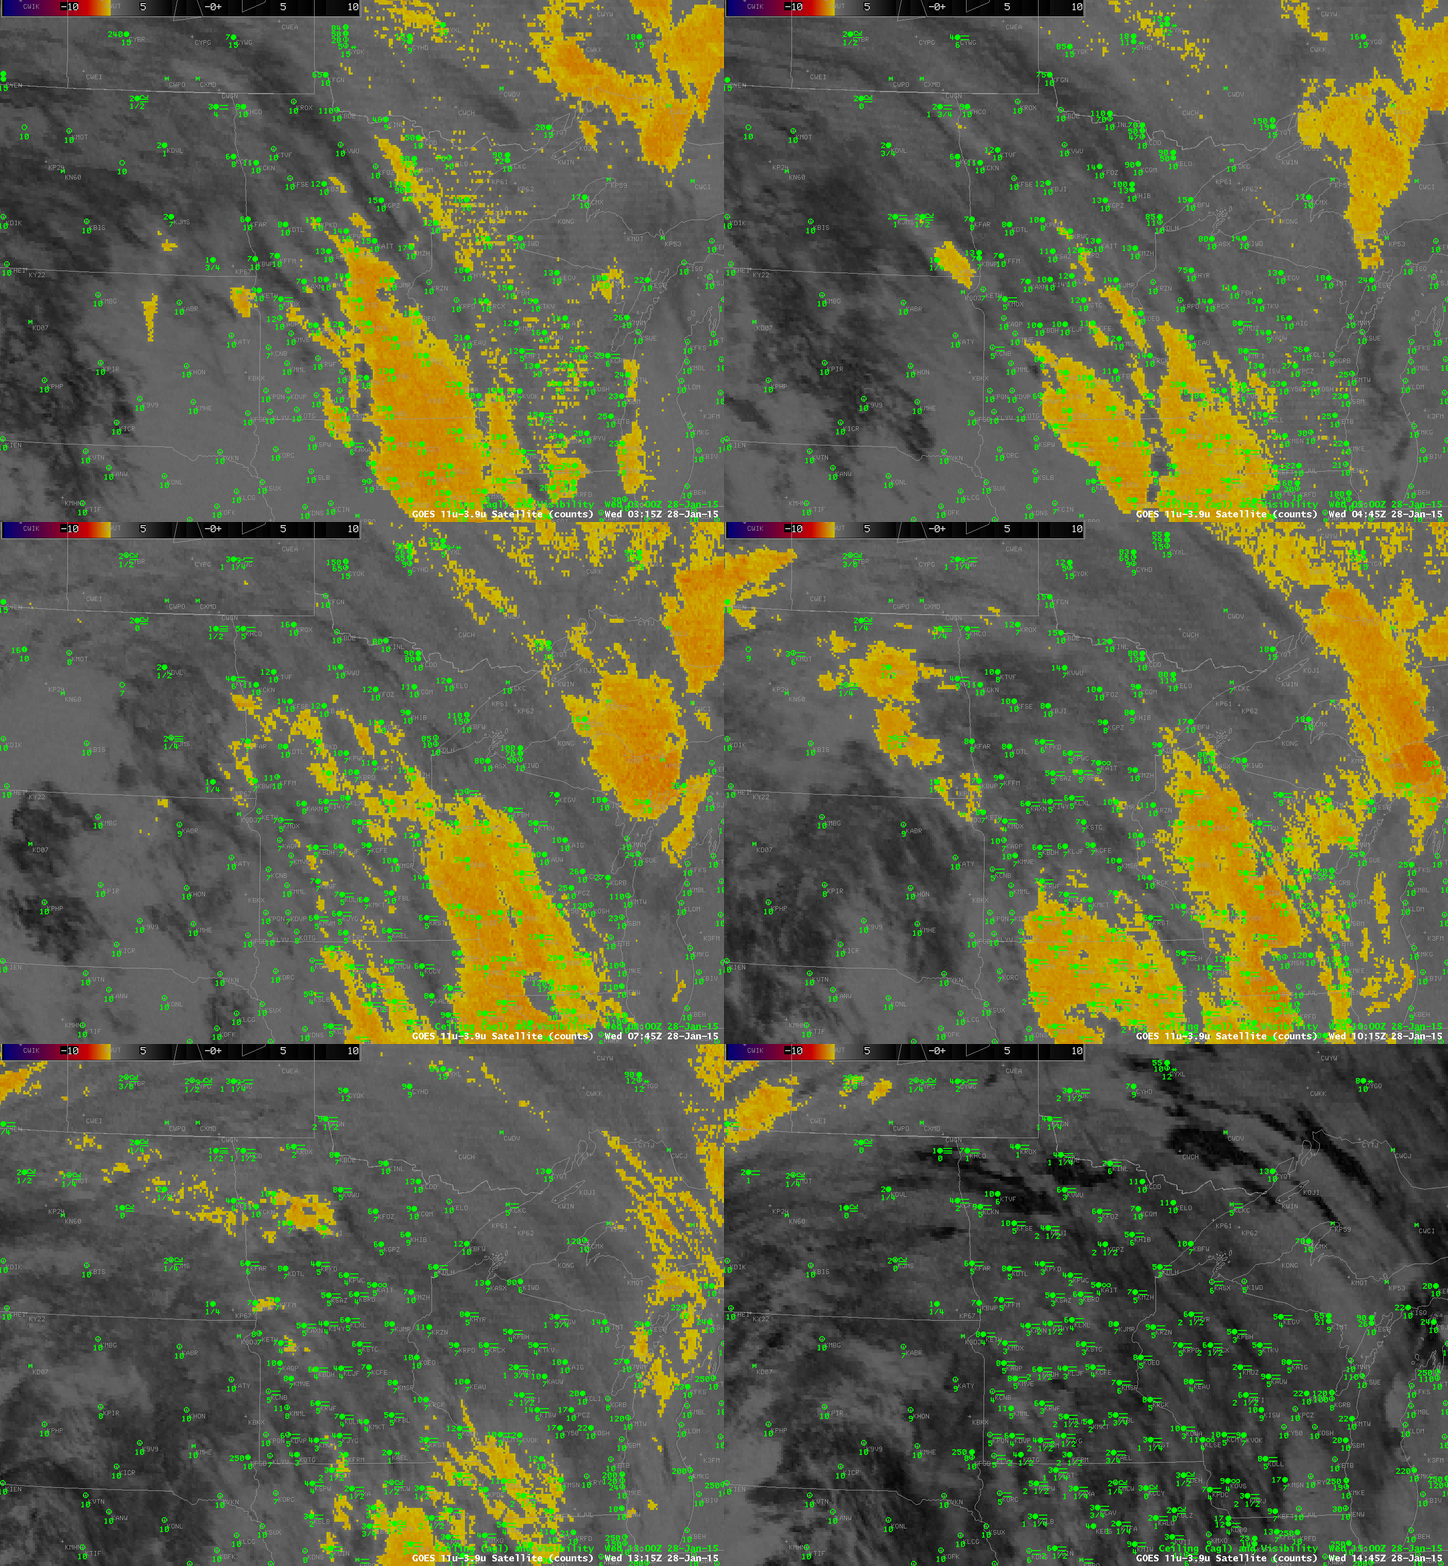
Brightness Temperature Difference (10.7µm – 3.9µm) field from GOES-13, half-hourly from 0315 through 1445 UTC, 28 January 2015, along with surface observations of ceiling and visibility (Click to enlarge)
The traditional method of detecting fog/low stratus is the brightness temperature difference between the shortwave (3.9 µm) and longwave (10.7 µm) infrared channels on GOES. This identification scheme is based on the fact that water droplets do not emit shortwave radiation (3.9 µm) as a blackbody; because of that, the amount of shortwave radiation detected by the satellite is less than it would be if blackboard emissivity were occurring, and the inferred temperature (computed assuming blackboard emission) of the emitting cloud is therefore colder. Water droplets do emit longwave radiation more like a blackbody, so the 10.7 µm brightness temperature is warmer. If the satellite view of low clouds is blocked by cirrus, as above, or by mid-level clouds, then satellite detection of low clouds/fog is hampered or impossible. In the animation above, there are many regions of near-IFR or IFR conditions — low ceilings and reduced visibility — where the Brightness Temperature Difference Product gives no indication that fog/low stratus exists.
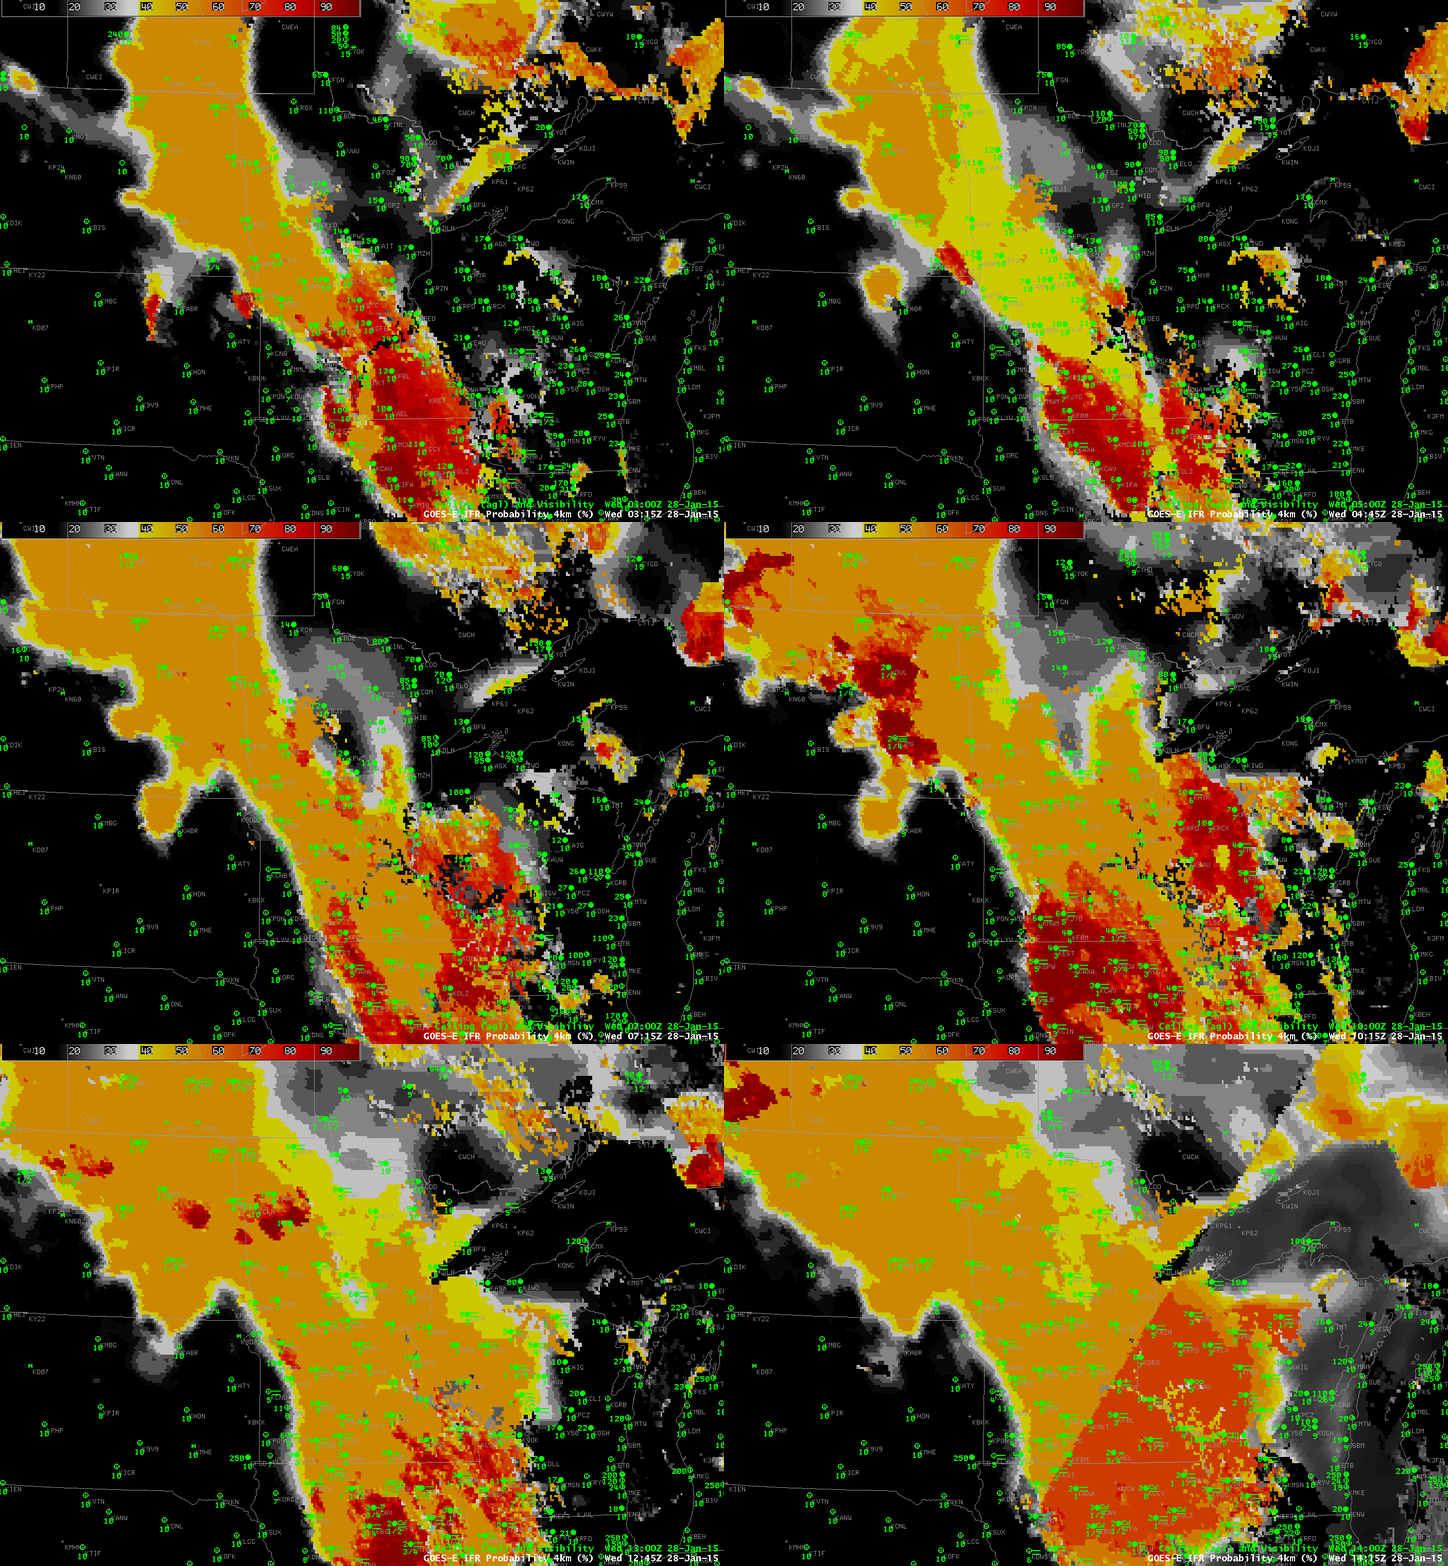
GOES-R IFR Probability fields from GOES-13, half-hourly from 0315 through 1415 UTC, 28 January 2015, along with surface observations of ceiling and visibility (Click to enlarge)
GOES-R IFR Probability fields, above, better capture the horizontal extent of the low ceilings and reduced visibilities. This is because surface data is incorporated into the fields via output from the Rapid Refresh Model output. IFR Probabilities are heightened where the Rapid Refresh Model shows saturation (or near saturation) near the surface, and that includes regions under high/middle clouds, such as the Red River Valley between Minnesota and North Dakota. That model data are controlling the value of the IFR Probability field in those regions is apparent because of two things: (1) The field is horizontally uniform, and not pixelated as it is in regions where higher-resolution satellite data can be used; (2) IFR probability values are smaller because there is less certainty that low clouds are present because the satellite cannot detect them. A well-trained user of this product, then, will interpret IFR Probability values of around 50-60 percent differently in regions of high clouds vs. in regions where low clouds only are present. Note the obvious line in the fields at 1415 UTC — the last image in the animation. This is the boundary between night-time predictors (to the north and west) and daytime predictors (to the south and east). Generally, IFR Probabilities increase as the sun rises because visible satellite data can be used to distinguish between clear and cloudy skies. If there is more certainty that clouds exist, then IFR Probabilities will be greater.
MODIS and Suomi NPP overflew this region and provided information about the clouds. GOES-R IFR Probability is not yet computed using Suomi NPP data; the brightness temperature difference product (11.35 – 3.74), below, shows the widespread cirrus over the region during two sequential overpasses. Scattered breaks allow identification of low clouds. As with any brightness temperature difference product, however, the information is about the top of the cloud, not necessarily the cloud base.
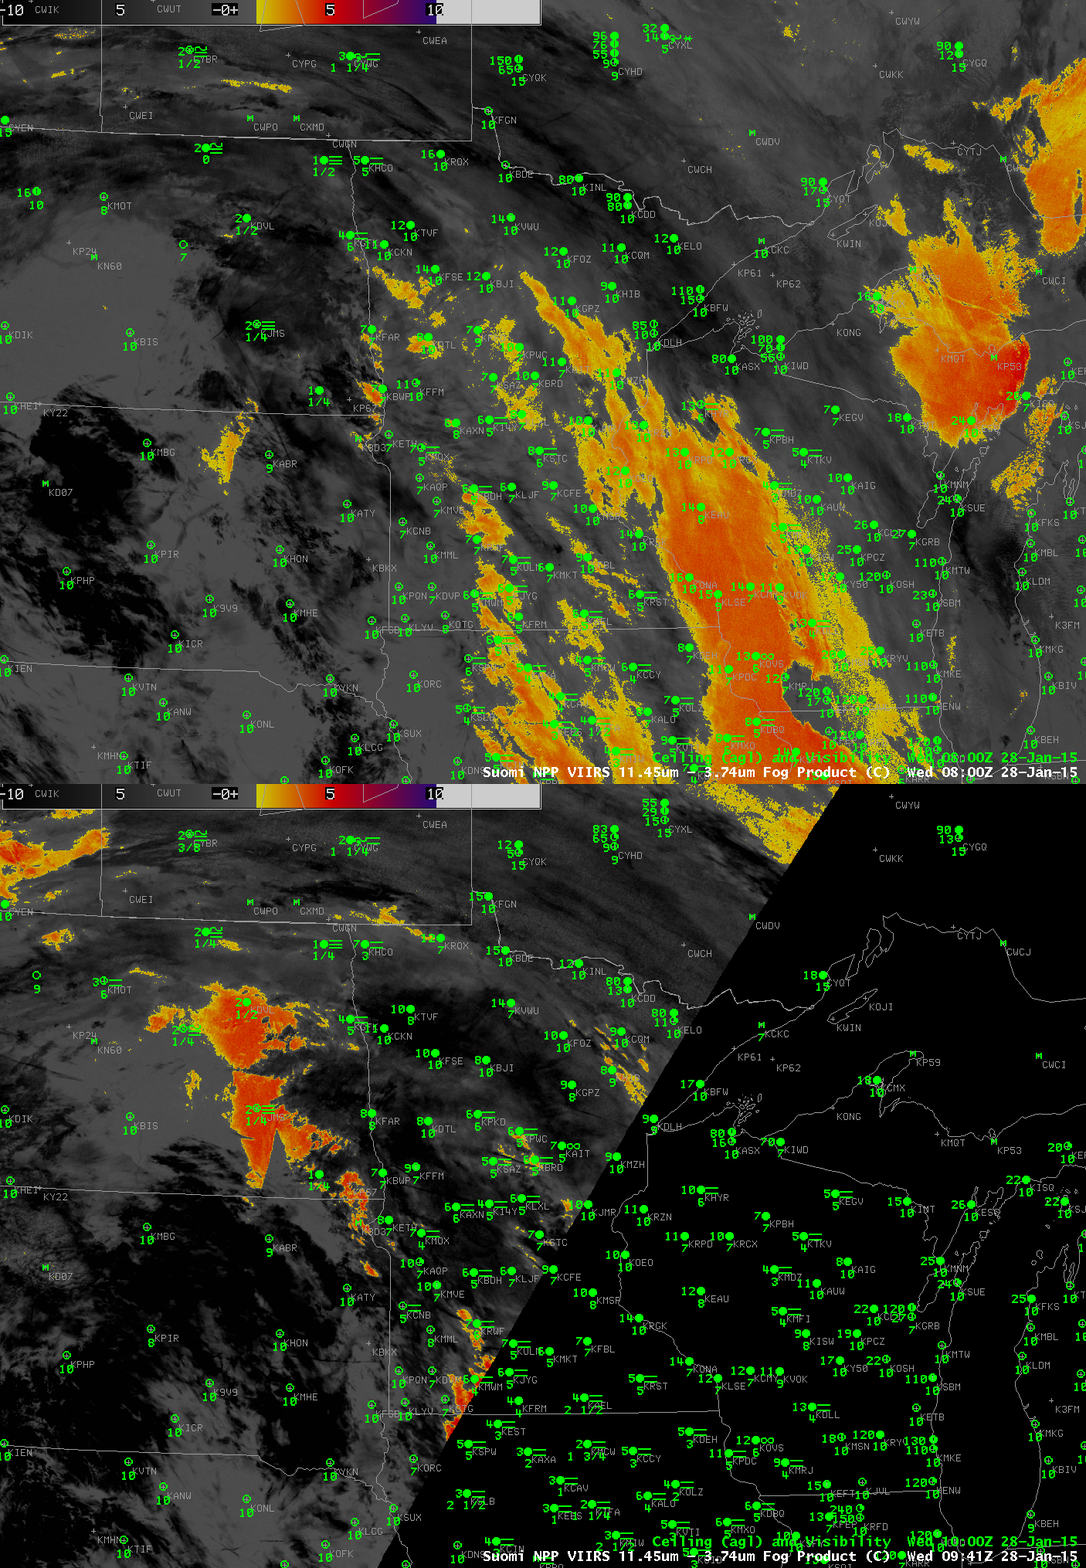
Brightness Temperature Difference (11.35 µm – 3.74 µm) field from Suomi NPP at 0800 and 0941 UTC 28 January 2015, along with surface observations of ceiling and visibility (Click to enlarge)
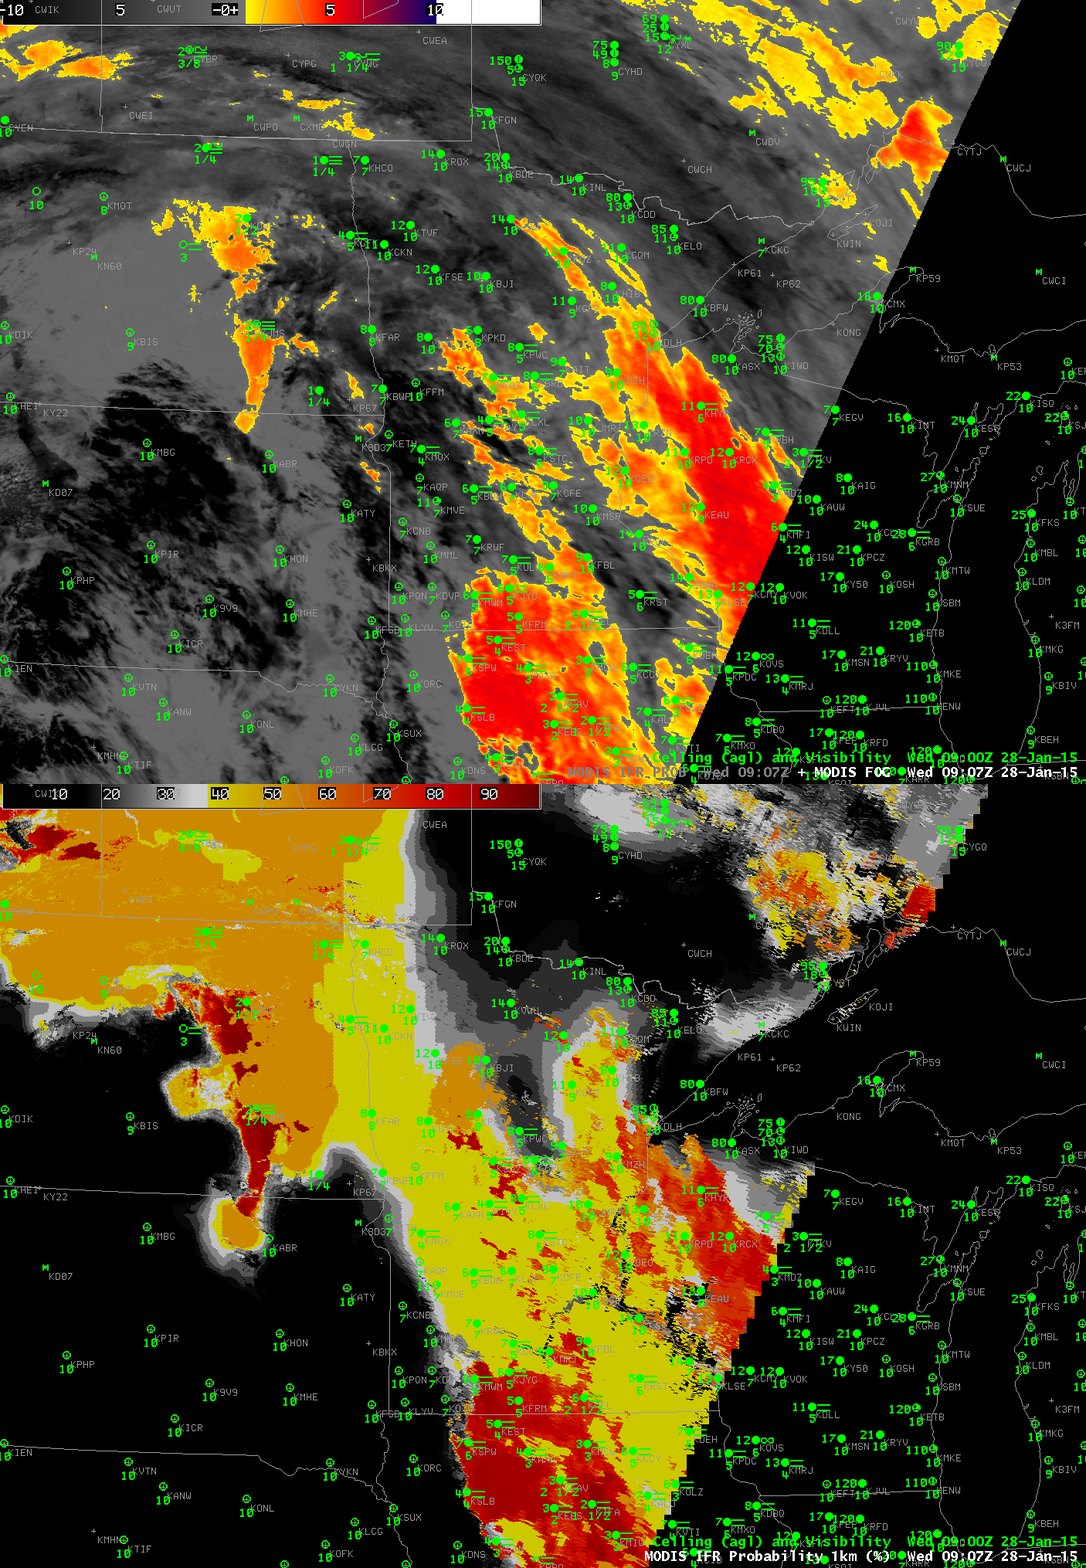
Aqua MODIS estimates of fog are shown below at 0728 and 0907 UTC. Detection using the Brightness Temperature Difference field is hampered by cirrus clouds. IFR Probability fields identify regions under cirrus that show IFR conditions.

