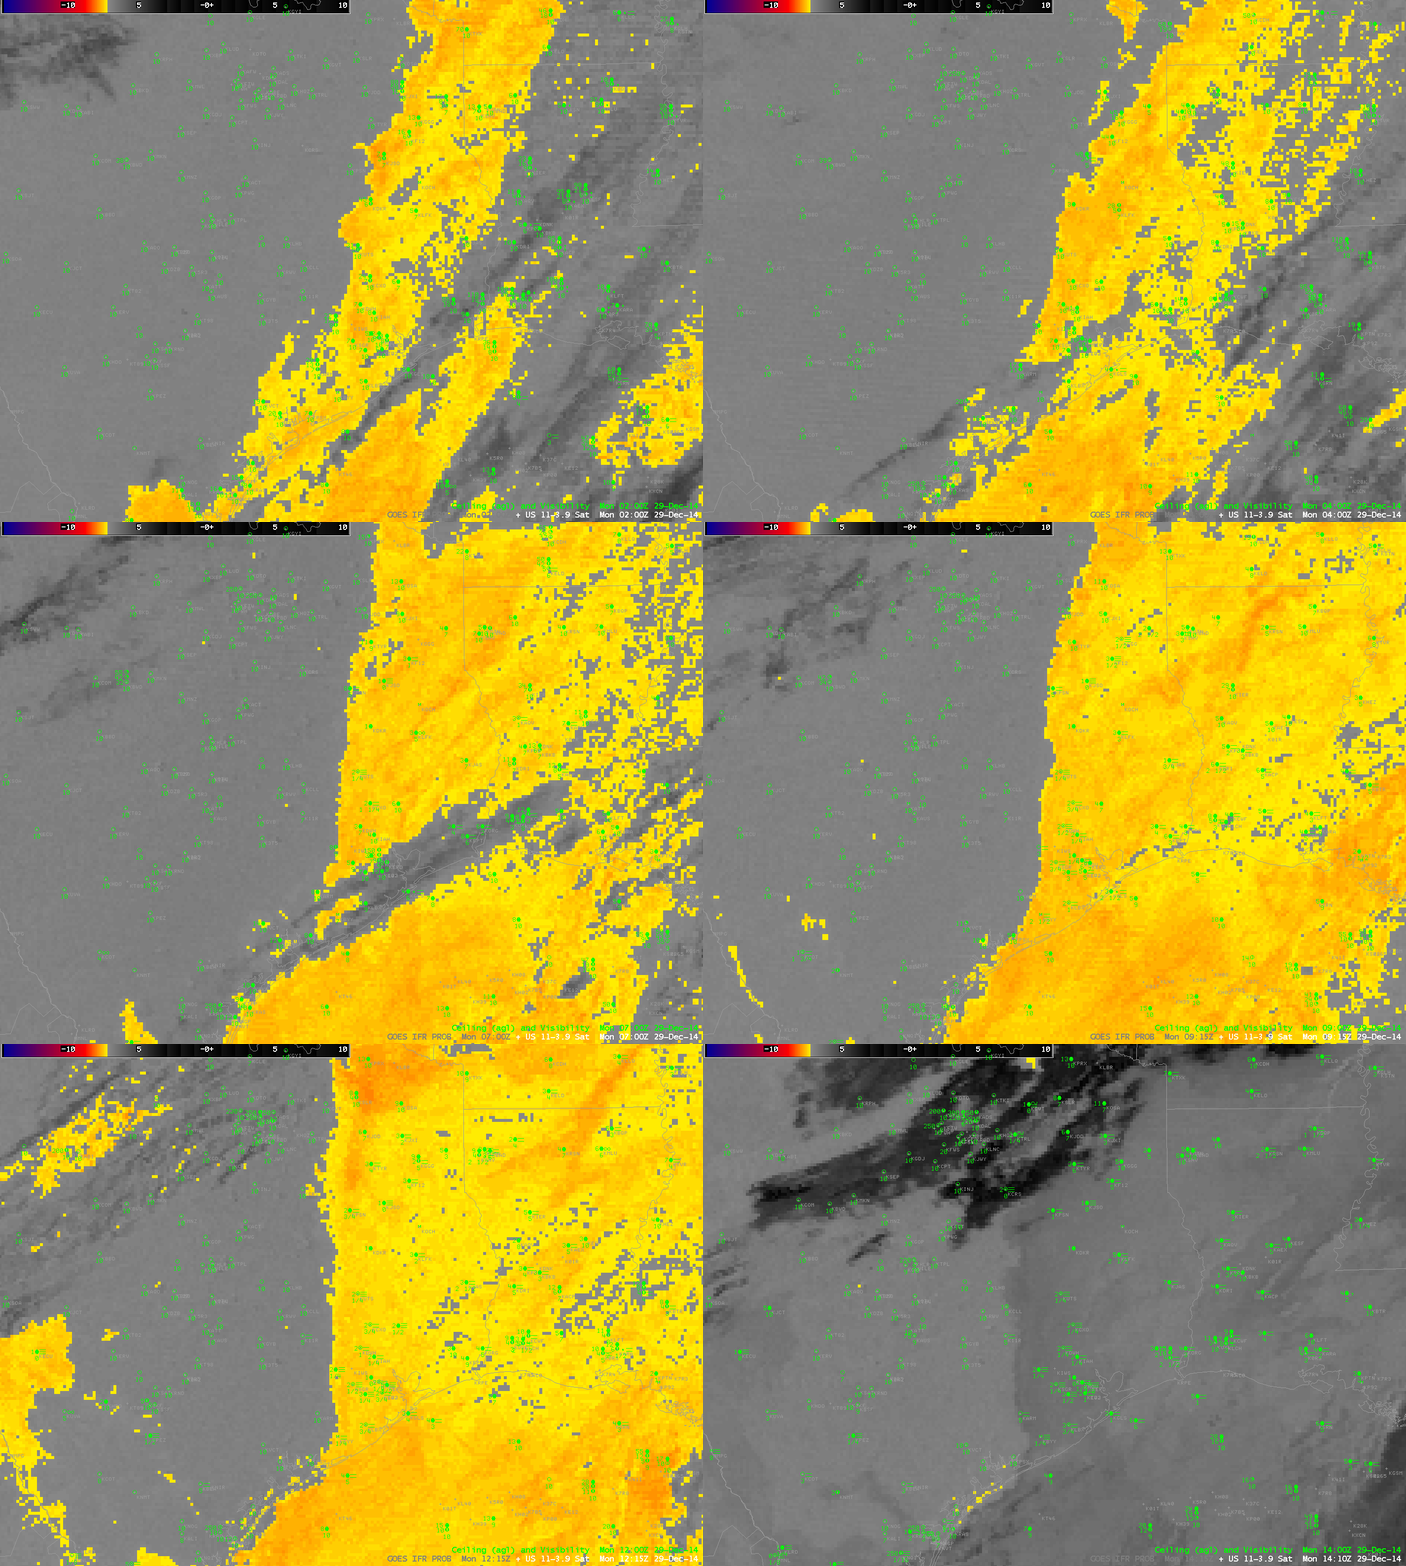
Brightness Temperature Difference Fields (10.7µm – 3.9µm) and surface observations of ceilings and visibilities, Hourly from 0200 through ~1400 UTC [Click to enlarge].
Traditional method of fog/low stratus detection revealed a sharp edge to clouds over east Texas during the morning of 29 December 2014. The animation above reveals several difficulties inherent in using brightness temperature difference fields in diagnosing fog/low stratus. Where multiple cloud layers are present — such as along the coast at 0500-0600 UTC — the brightness temperature difference product cannot view the low clouds. At sunrise, increasing amounts of solar 3.9µm radiation causes the brightness temperature difference product to flip sign. The signal for low clouds is still there, however.
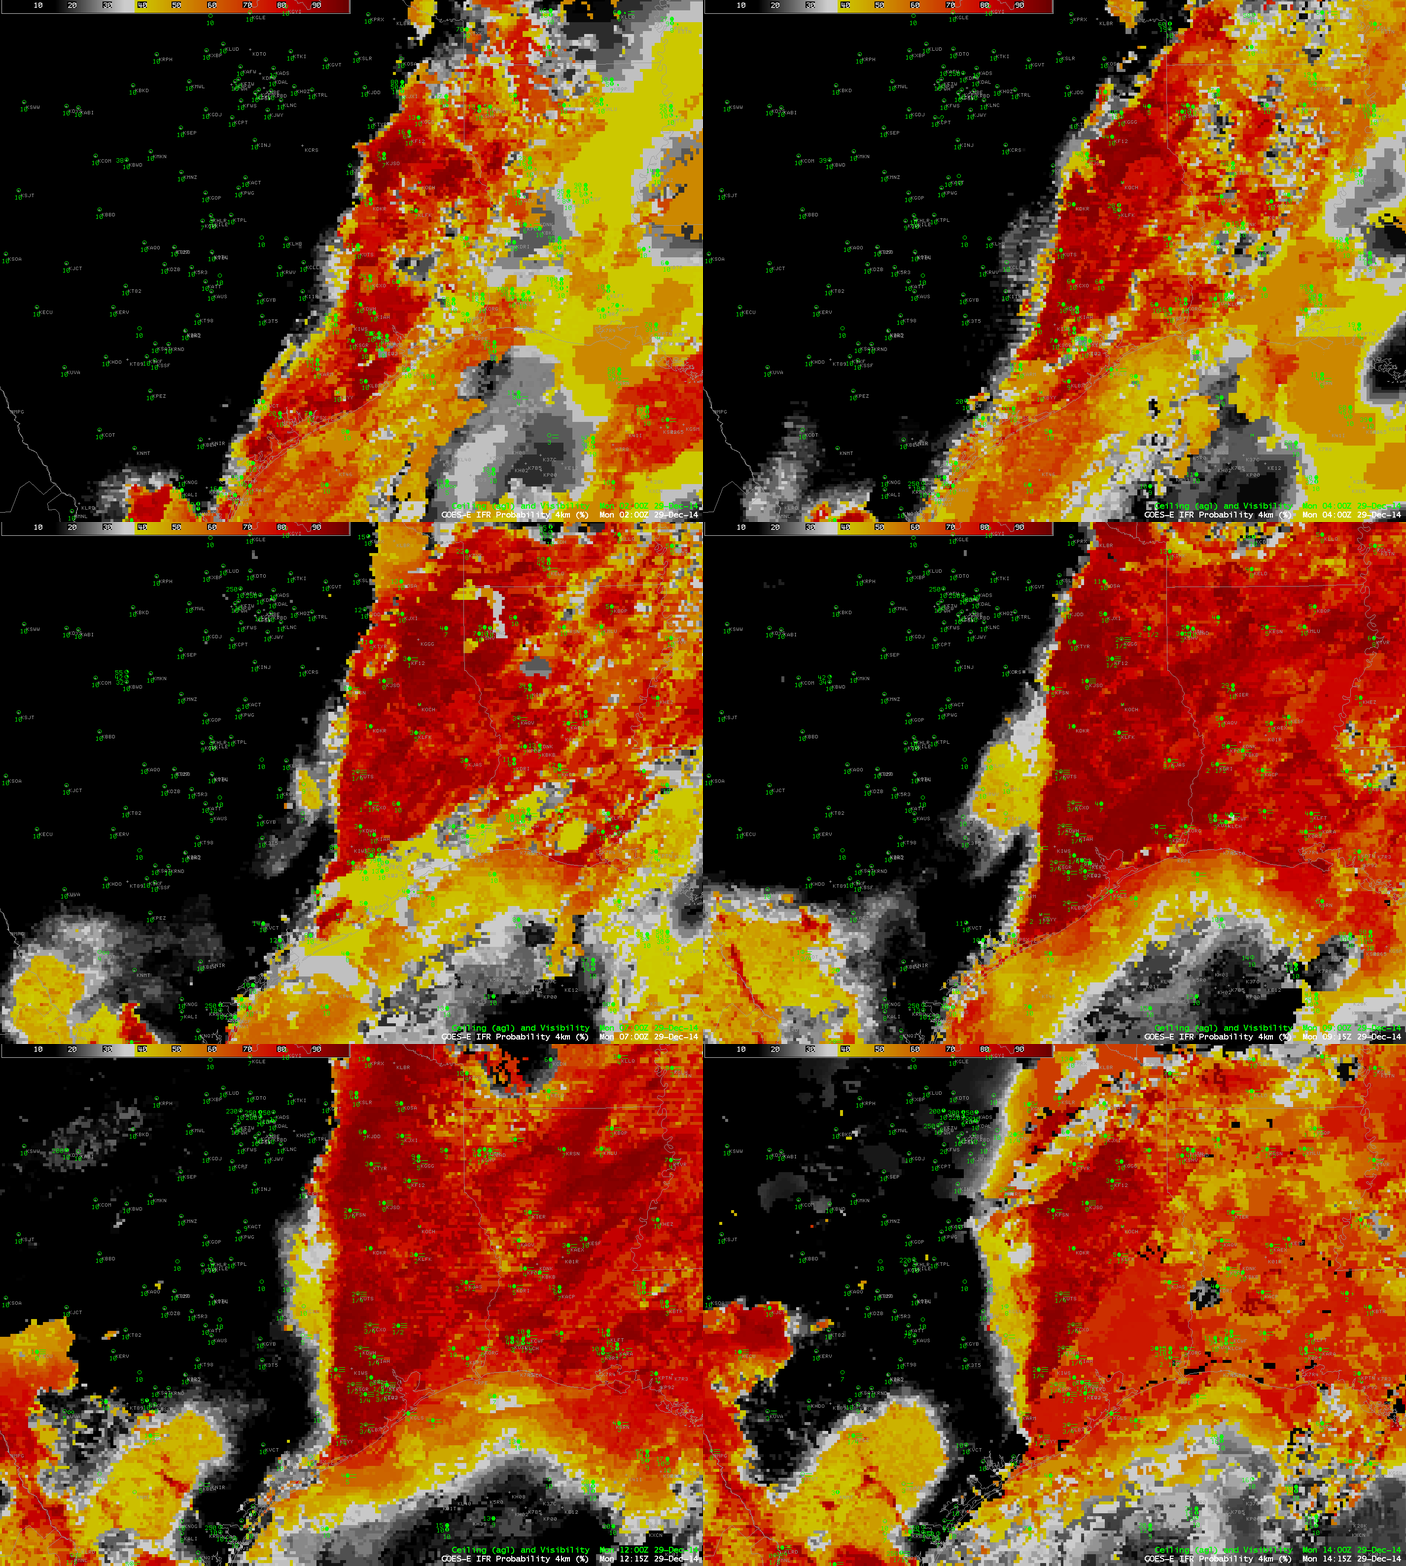
GOES-R IFR Probabilities and surface observations of ceilings and visibilities, Hourly from 0200 through ~1400 UTC [Click to enlarge]
The animation of GOES-R IFR Probabilities, above, created from GOES-13 data and Rapid Refresh Model data, shows high IFR Probabilities over east Texas where low ceilings and reduced visibilities prevailed, including metropolitan Houston. The algorithm suggests the likelihood of fog/low stratus underneath the cirrus debris that is over the coast around 0500-0600 UTC as well, because the Rapid Refresh model output in that region strongly suggests low-level saturation. In addition, the fields show only minor changes through sunrise (the effect of the terminator is present in the final image in the loop).
MODIS data from either Terra or Aqua can be used to produce IFR Probabilities. The data below is from 0442 UTC. Polar orbiter data is infrequent, however, so temporal monitoring of the fog/low clouds is more easily achieved using GOES data. MODIS data, like the GOES data above, shows the effects of cirrus clouds on Brightness Temperature Difference fields and on IFR Probabilities. Cloud predictors of low clouds/fog from satellite cannot be used in regions of cirrus, so IFR Probabilities are smaller in regions where multiple cloud layers exist, which regions are where only Rapid Refresh Data can be used as predictors.
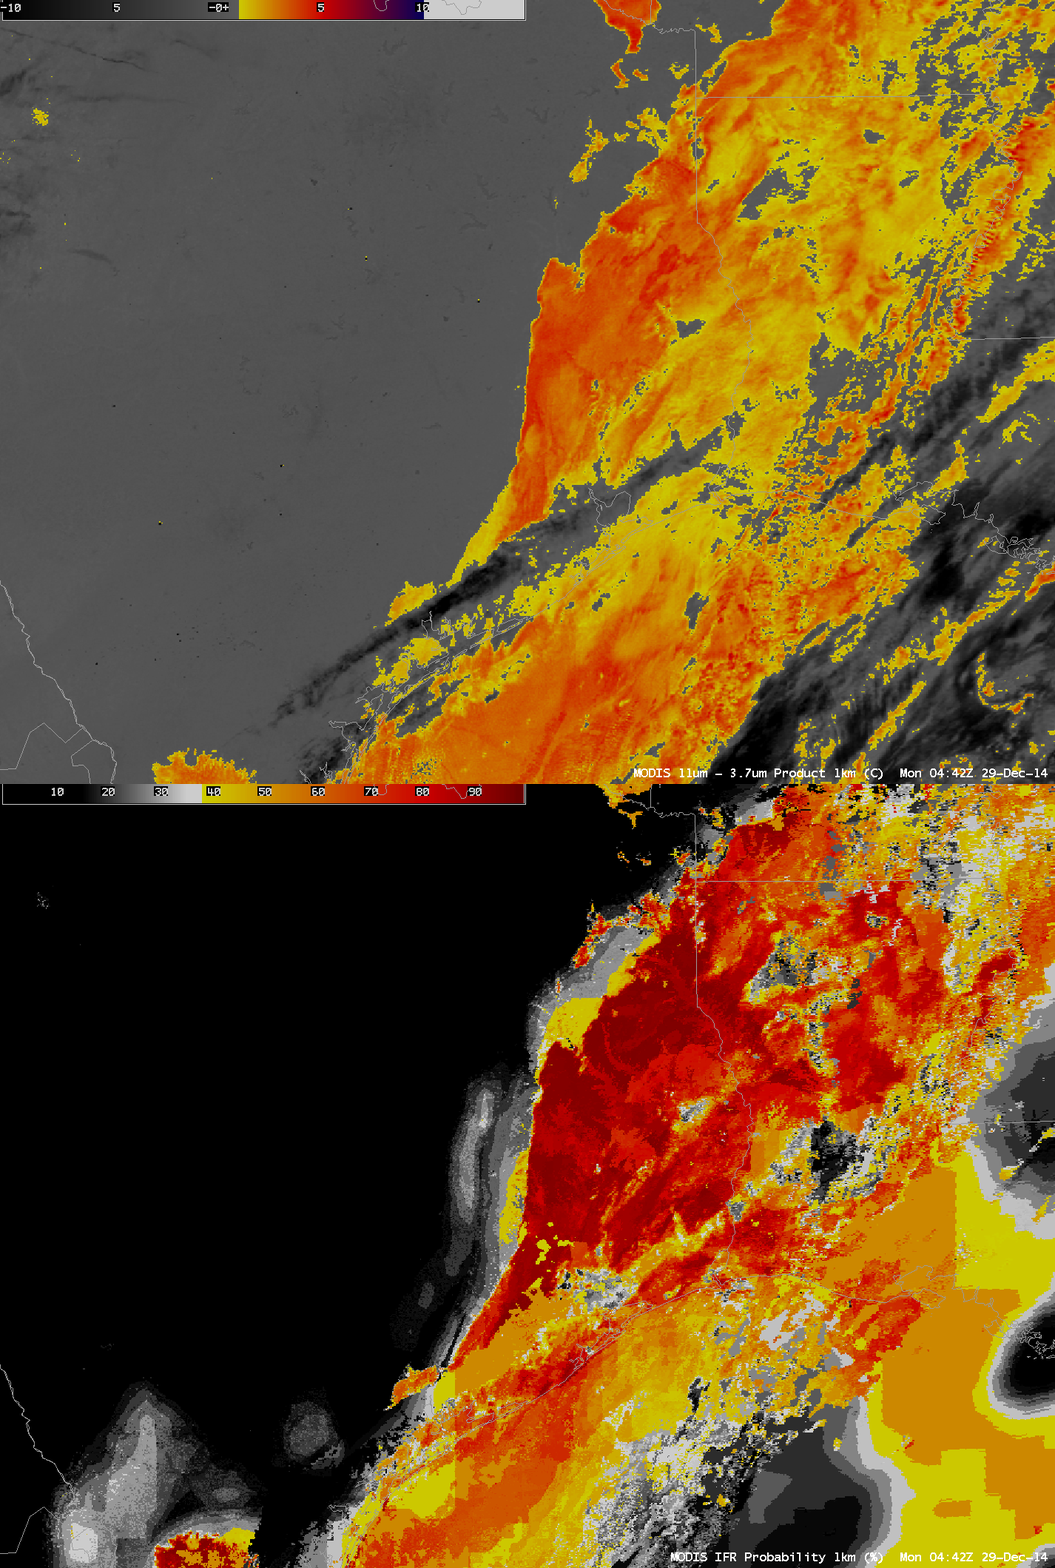
0442 UTC MODIS-based brightness temperature difference and IFR Probability fields (Click to enlarge)
Brightness Temperature Difference fields can also be created from Suomi/NPP data and the orbital geometry on 29 December meant that eastern Texas was viewed on two sequential overpasses. IFR Probabilities are not quite yet computed using Suomi NPP data, but the brightness temperature difference fields can be used to show where water-based clouds exist. They show a very sharp western edge to the clouds.
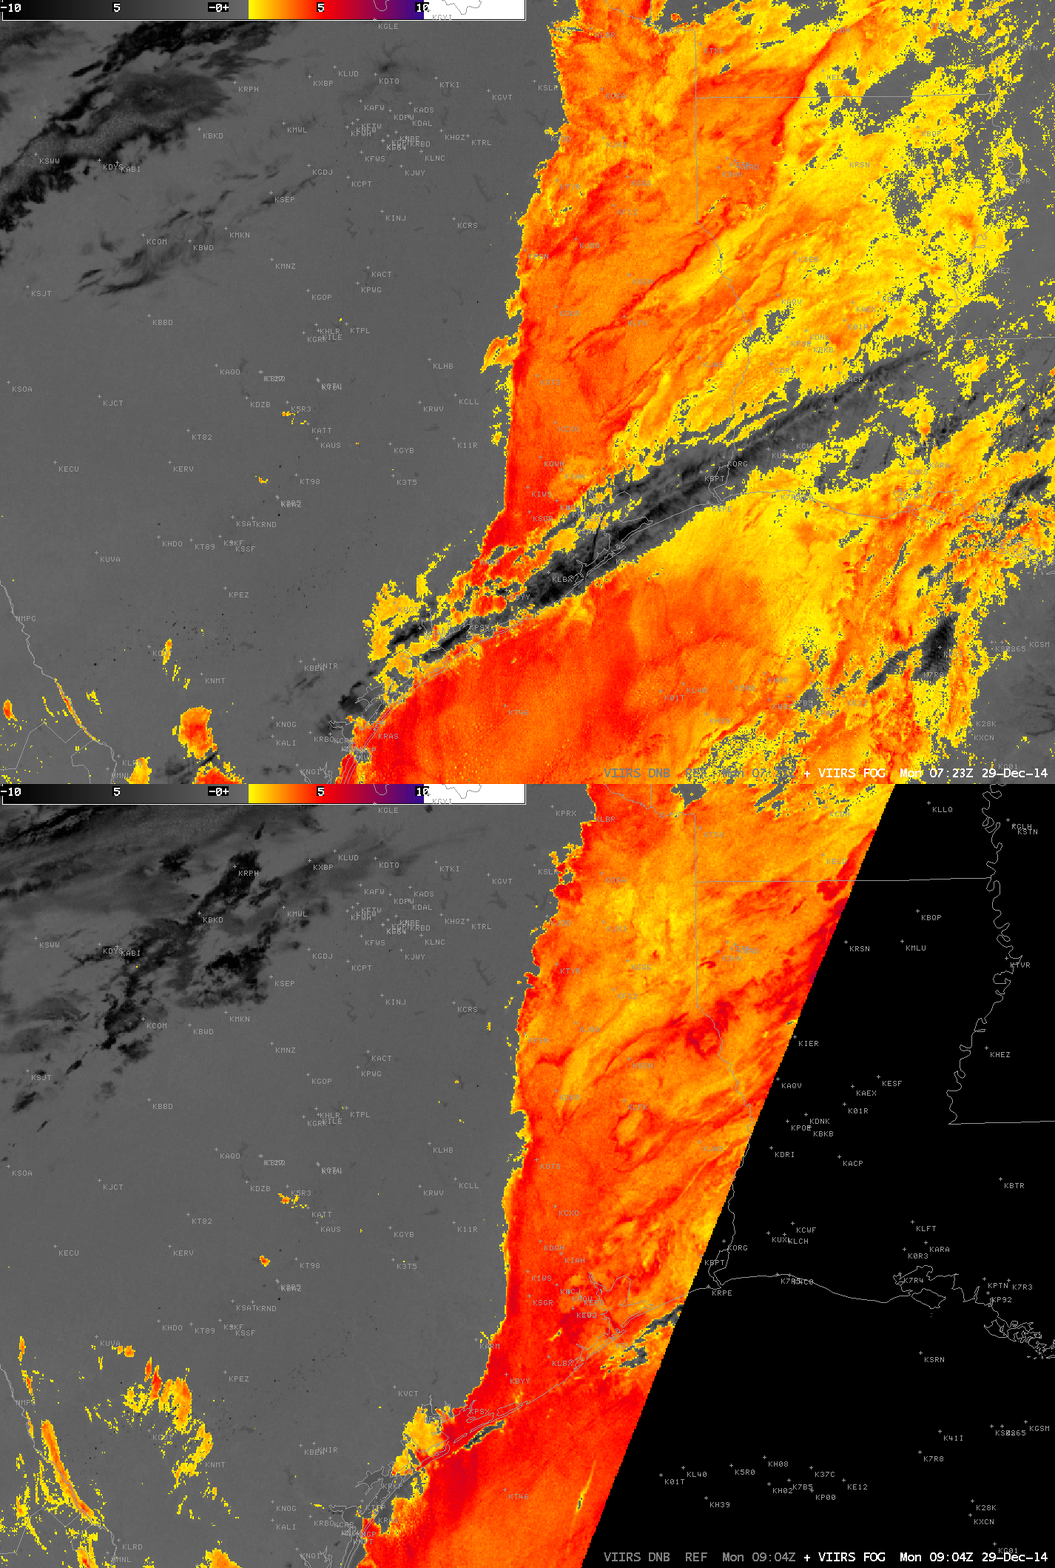
Brightness Temperature Difference Fields (11.35µm – 3.74µm) from Suomi NPP at 0723 and 0904 UTC on 29 December 2014 (Click to enlarge)
The Day Night Band on Suomi NPP produces visible imagery at night. When lunar illumination is strong, it can provide compelling imagery. On 29 December 2014, however, the moon set around 0600 UTC, so no lunar illumination was available, and fog/low clouds are very difficult to discern in the toggle below between the Day Night Band and the brightness temperature difference field at 0723 UTC.
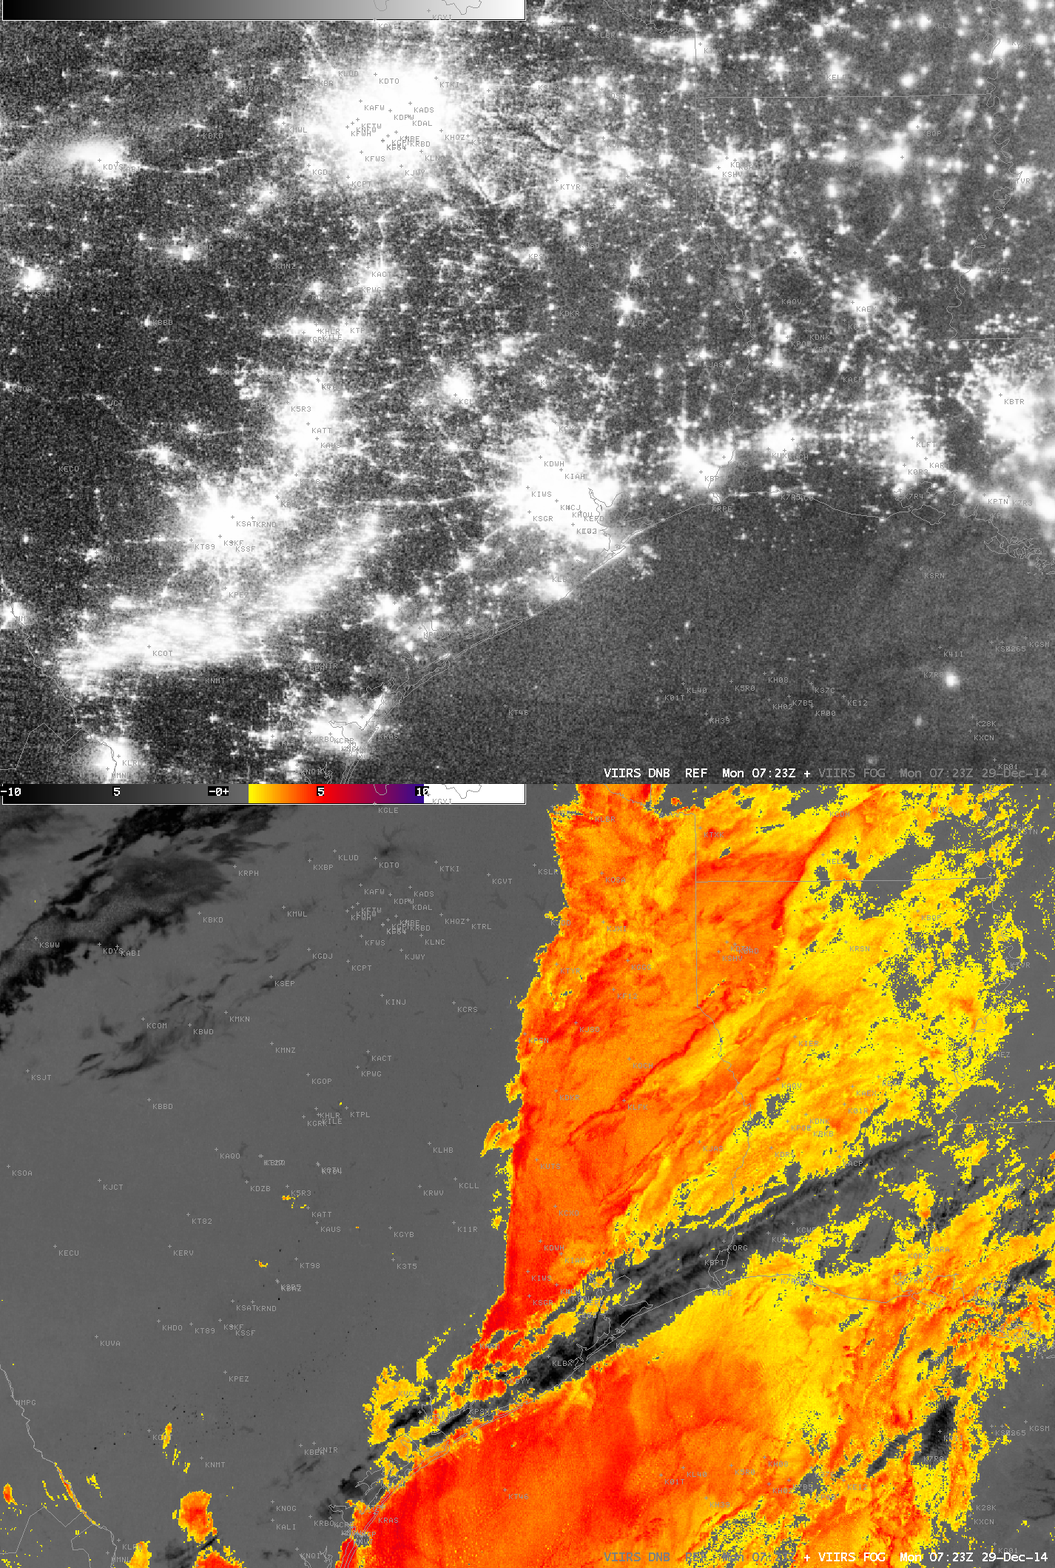
Day Night Band and Brightness Temperature Difference Fields (11.35µm – 3.74µm) from Suomi NPP at 0723 on 29 December 2014 (Click to enlarge)
