Fog developed over Texas, Oklahoma and Arkansas early in the morning of 9 December 2014. Multiple cloud layers made traditional satellite detection (that is, using brightness temperature difference field (10.7µm – 3.9µm)) problematic. How did the fused product, GOES-R IFR Probability perform? The animation below shows the hourly evolution of IFR Probability from 0215 UTC through 1415 UTC.

GOES-R IFR Probabilities, hourly from 0215 through 1415 UTC on 9 December 2014, along with surface plots of ceilings and visibilities (Click to enlarge)
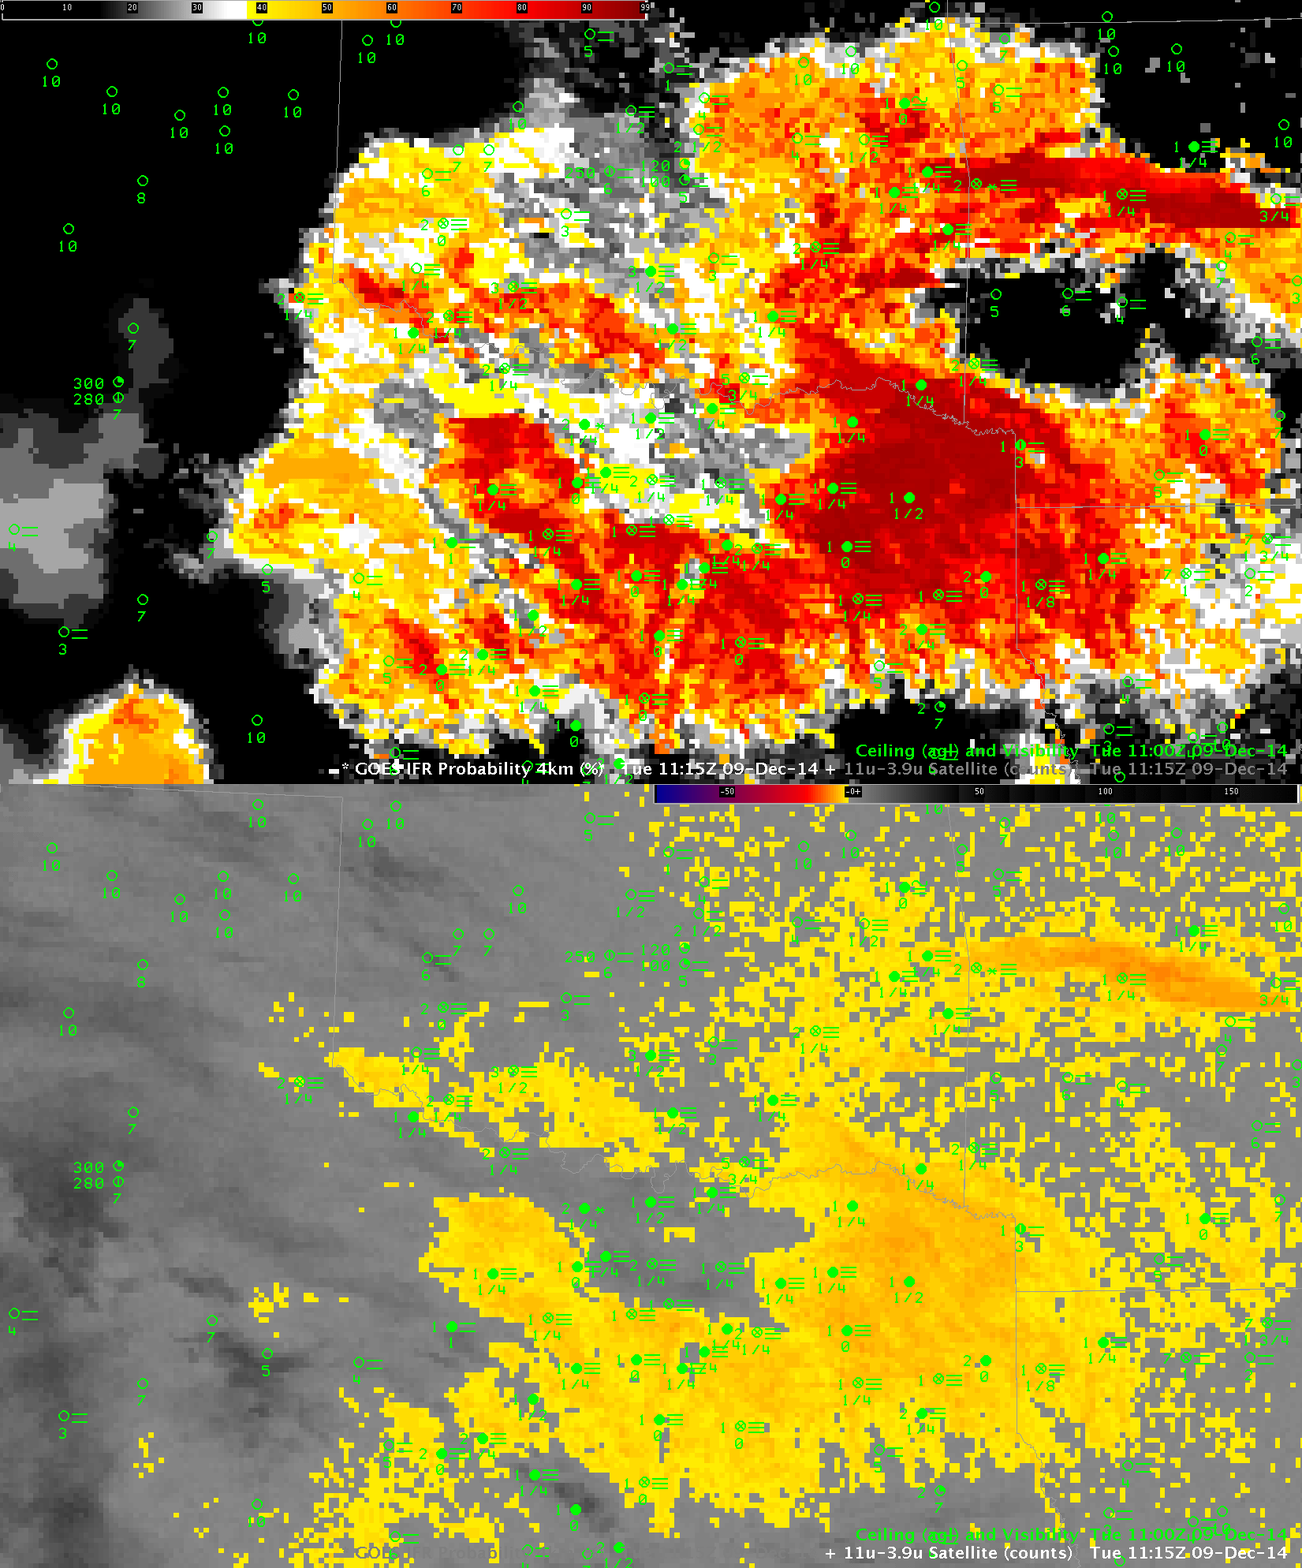
There are widespread reports of IFR conditions over southeast Oklahoma and northern Texas, as well as over Arkansas in the Arkansas River Valley. IFR Probability fields generally overlap the region of reduced ceilings and visibilities.
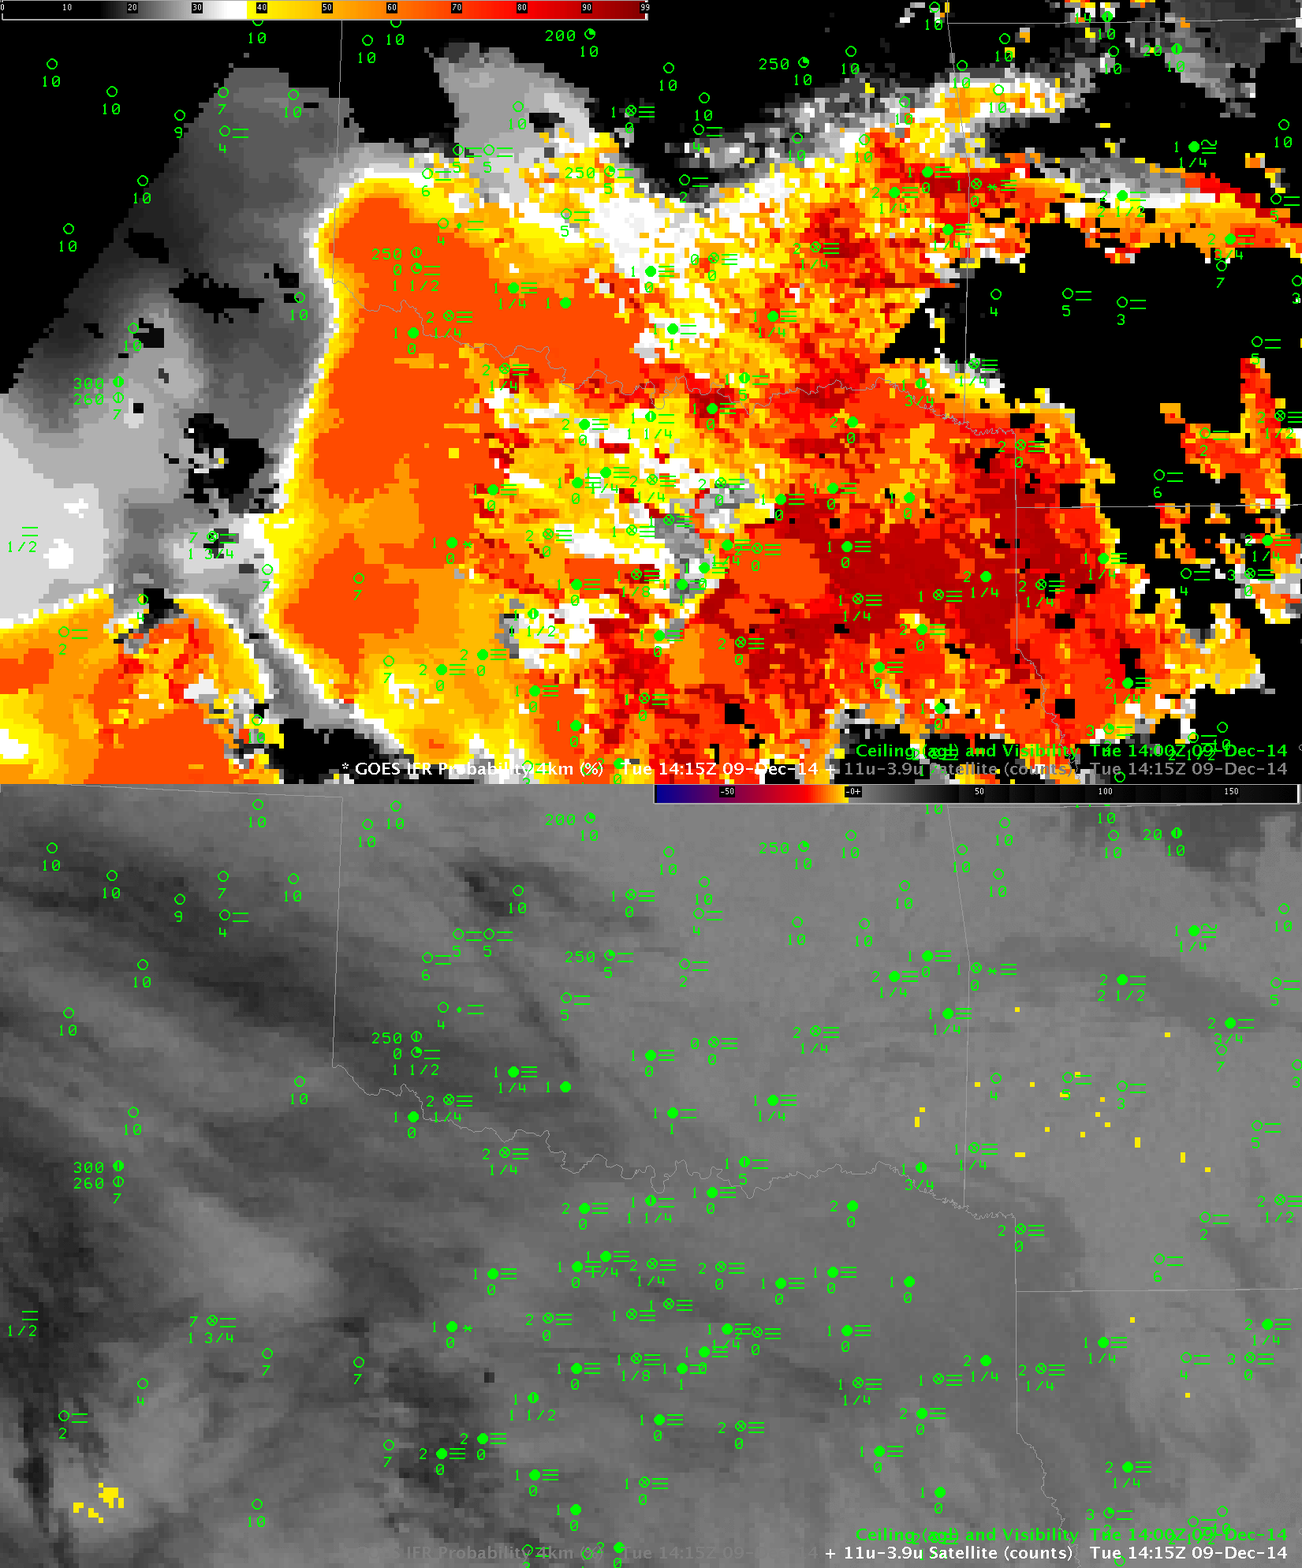
Note that the probabilities increased over west Texas between 1315 and 1415 UTC. The boundary between day and night predictors is also apparent at 1415 UTC as a SW to NE line over the Texas Panhandle. Probabilities change as night switches to day because different combinations of satellite predictors can be used. In particular, the use of visible imagery improves cloud clearing and therefore IFR Probabilities increase in regions where low clouds exist (because the possibility of clouds being present is more easily detected).
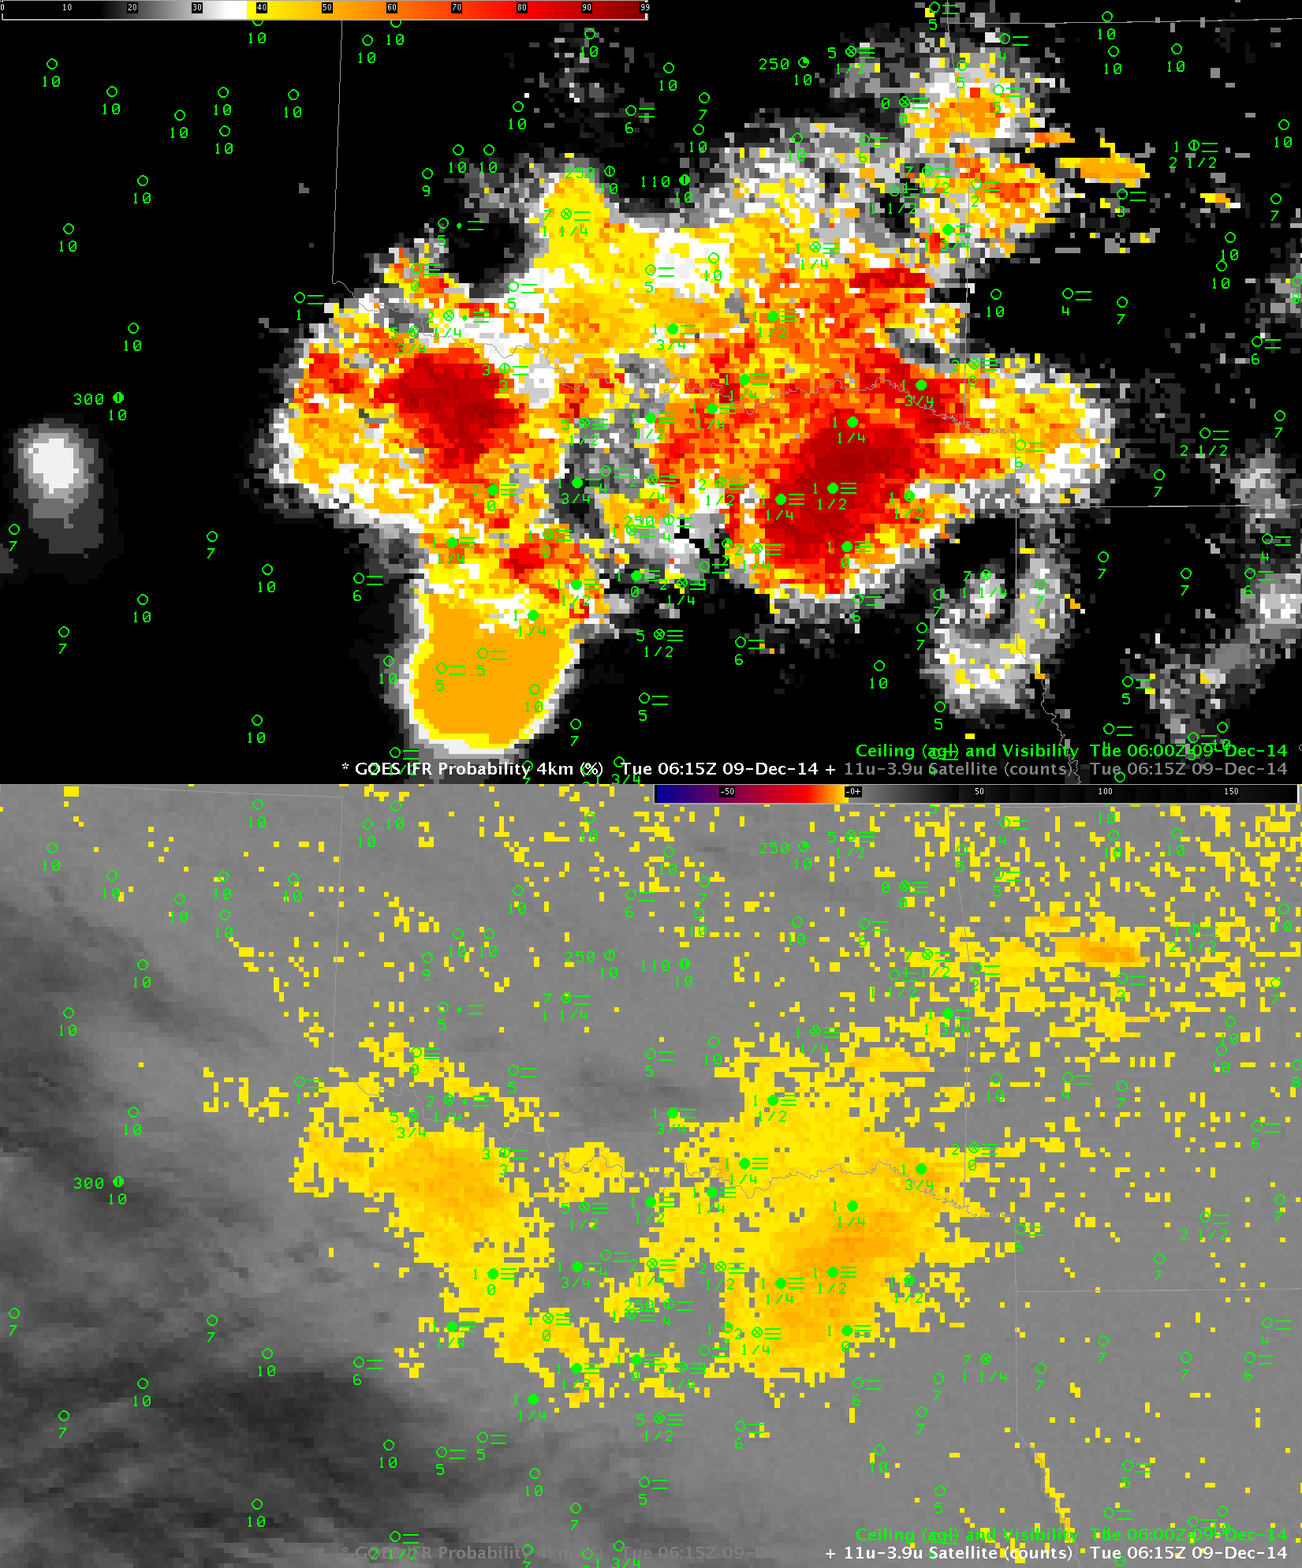
The toggles below show data from 0615, 1115 and 1415 UTC and demonstrate why a fused product can give better information than a satellite-only product. Intermittent high clouds over the southern Plains prevented GOES-13 from identifying regions of low clouds (Cirrus clouds in the enhancement below appear as dark regions). IFR Probabilities can give valid information in these regions because the Rapid Refresh Model gives information about the possibility of low-level saturation. There are large regions at 1415 UTC over west Texas that are covered by cirrus clouds; despite the inability of the satellite to detect low clouds, IFR Probability maintains a strong signal there where IFR Conditions are occurring. The 1415 Brightness Temperature Difference field, in contrast to the IFR Probability field, gives very little information because increasing amounts of solar radiation are changing the relationship between 10.7µm and 3.9µm radiation at 1415 UTC.

GOES-R IFR Probabilities and GOES-13 Brightness Temperature Difference Fields (10.7µm – 3.9µm), 0615 UTC on 9 December 2014, along with surface observations of ceilings and visibilities (Click to enlarge)
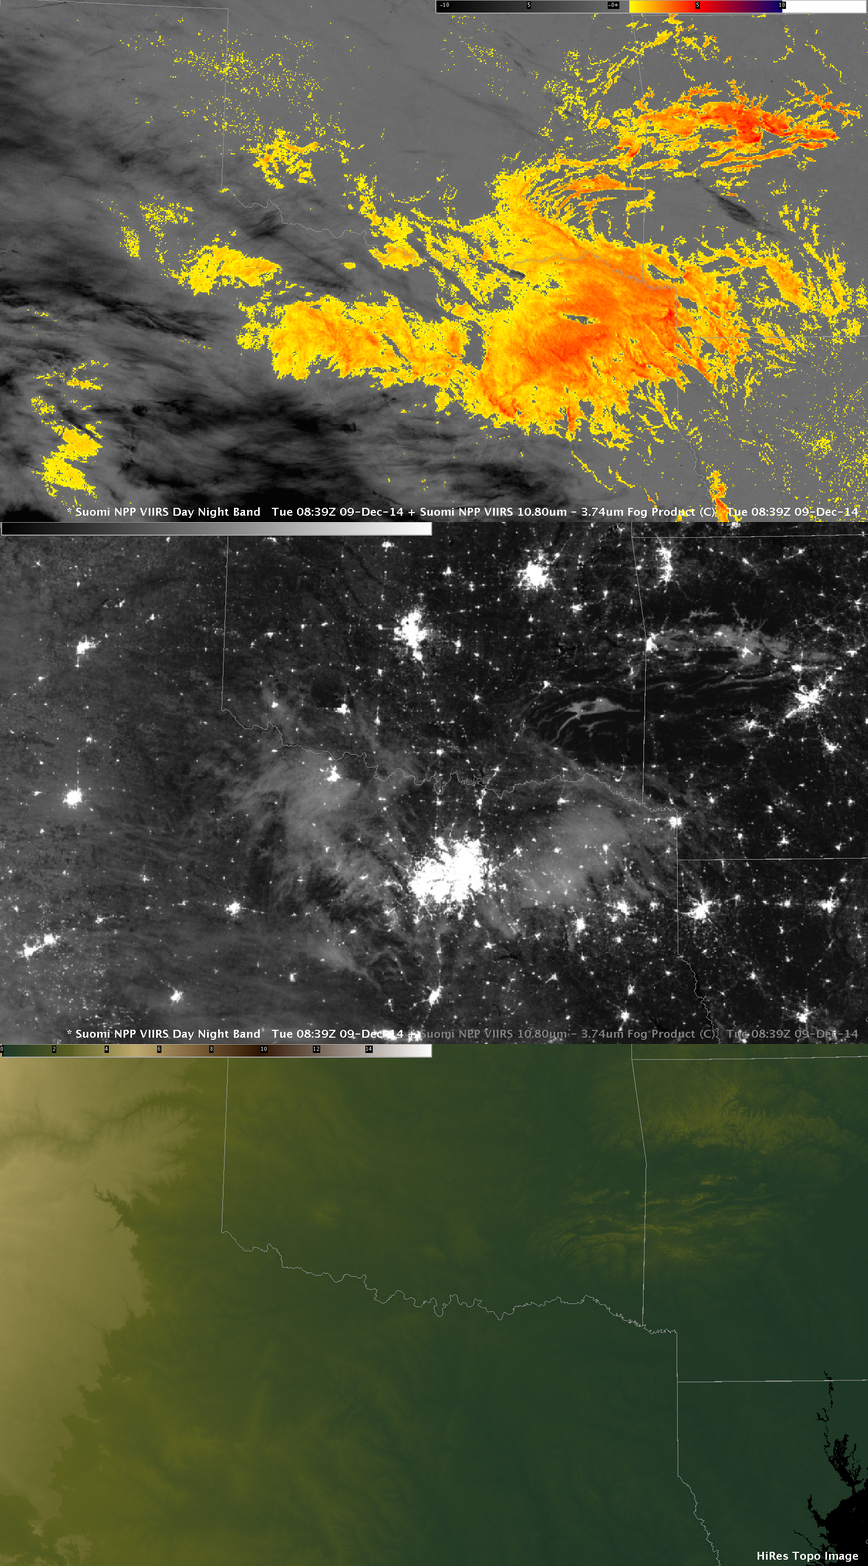
A near-Full Moon on 9 December means that the Day Night Visible imagery from Suomi NPP produced great imagery of the clouds over the southern Plains. The toggle below shows the Day Night band, the brightness temperaure difference field (11.35µm – 3.74µm) and the topography. Very narrow fog banks are apparent over southeast Oklahoma and over Arkansas, nestled into narrow valleys. The Brightness Temperature Difference field distinguishes between water-based clouds (presumably low stratus or fog) in orange and ice clouds (cirrus) in black.

Suomi NPP Brightness Temperature Difference (11.35µm – 3.74µm) fields, Day Night band imagery and Color-shaded topography, 0839 UTC 9 December 2014 (Click to enlarge)
The fog event over Dallas was photographed from the air: Link.


