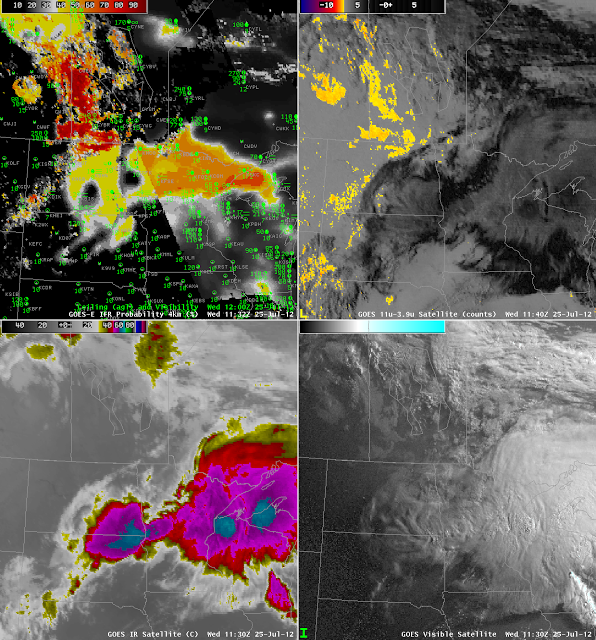
Convection developed over the upper Midwest and northern Plains during the early morning hours of 25 July 2012. Deep convective clouds preclude the ‘traditional’ brightness temperature difference method of fog detection: emissions from the low-level water-based clouds cannot be seen by the satellite because of high-level cirrus clouds associated with thunderstorm anvils. IFR conditions nevertheless can occur and can be predicted using model-based predictors in the fused GOES-R IFR probability product. The case above is an excellent example.
The bottom two images show the tradiational satellite imagery, telling the tale of a departing mesoscale system. It leaves in its wake low clouds over North Dakota and Manitoba that are detected by the traditional product, and notice how the GOES-R IFR probabilities are highest here, because satellite and model predictors both agree. Under the convective cloud canopy, probabilities are lower: around 40% in central North Dakota (where night-time predictor relationships are being used) and around 55% over the Arrowhead of Minnesota (where daytime predictor relationships are being used); the terminator boundary is very obvious in the IFR Probability figure. There is an excellent overlap between the GOES-R IFR Probabilities and reported IFR conditions that is impossible to get in this case with satellite information alone.

