 |
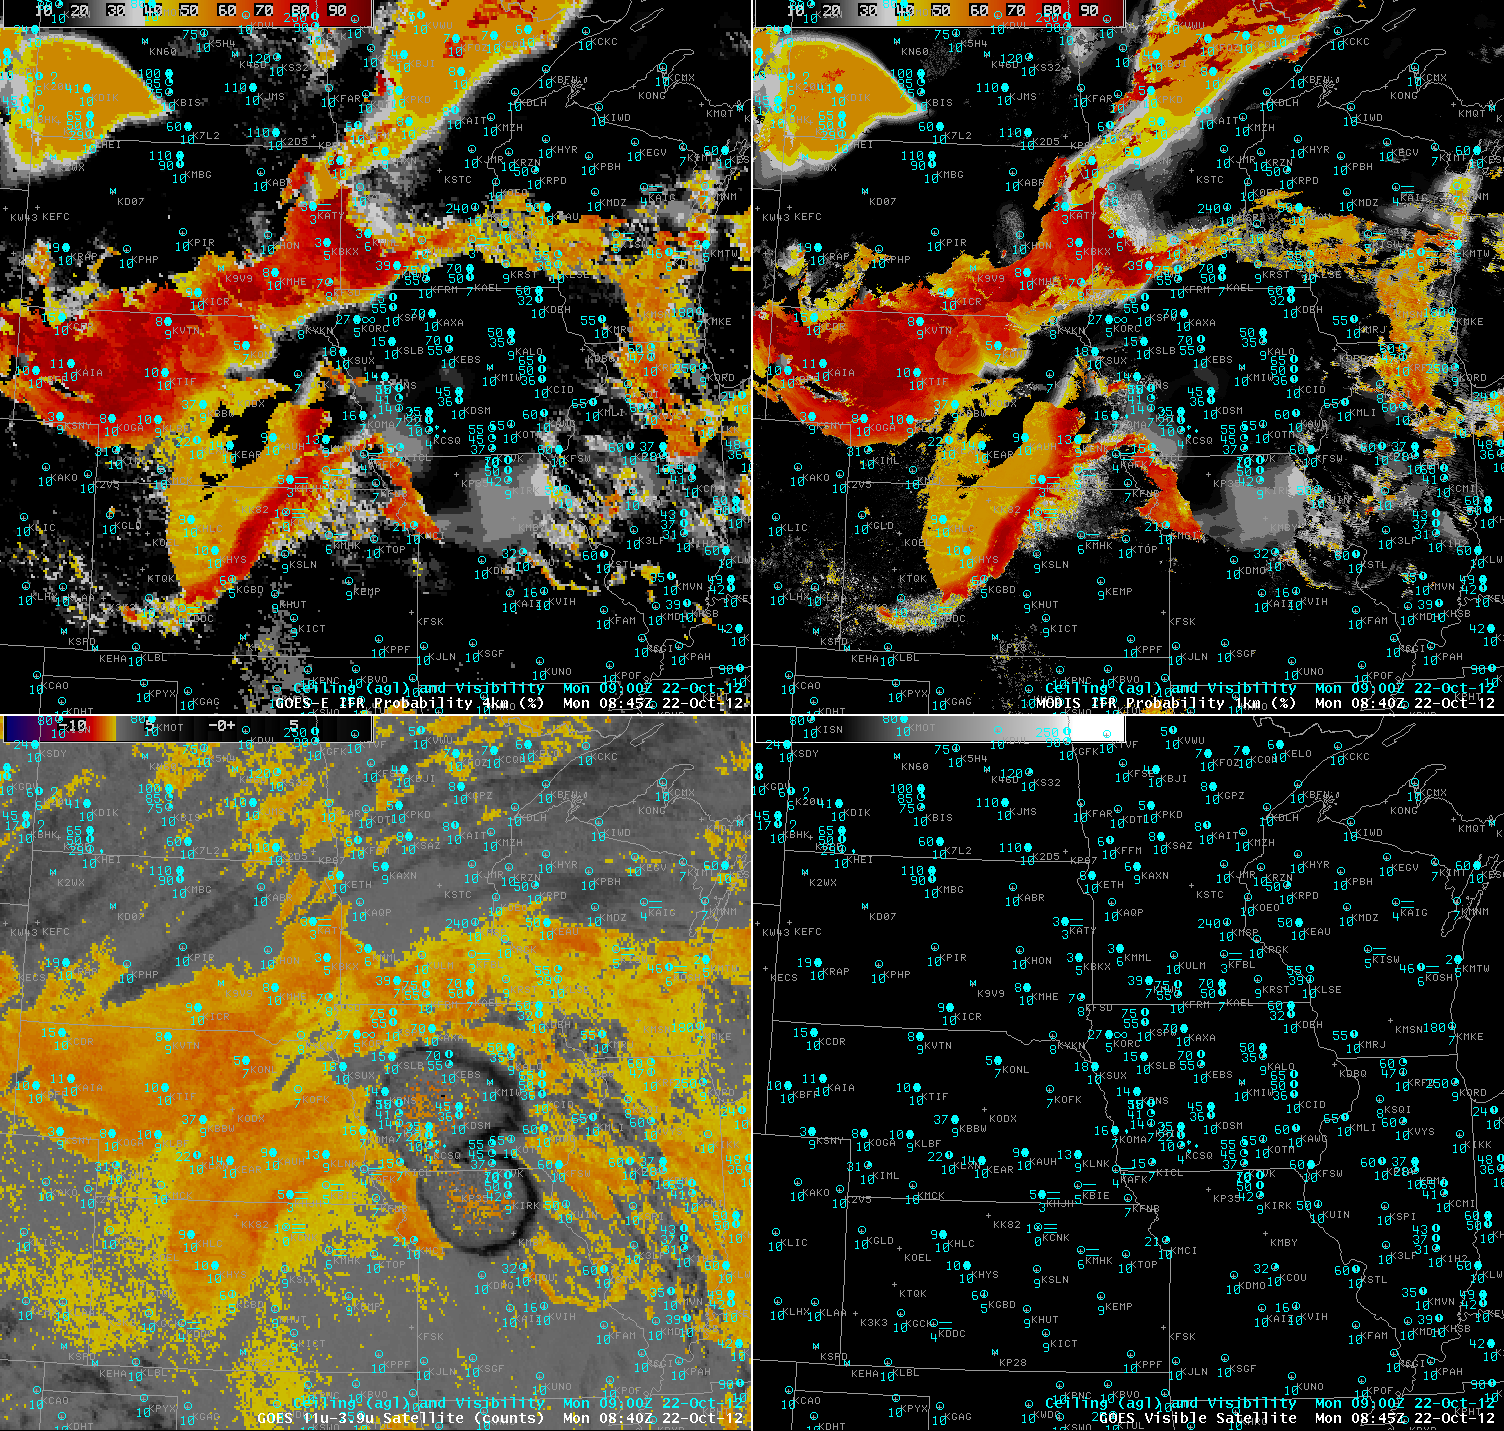
| GOES-R IFR probabilities (upper left), GOES-R LIFR probabilities (upper right), GOES-13 brightness temperature difference (3.9-11 µm) (lower left) and visible satellite image (lower right). Surface observations of visibility and cloud ceiling (above ground level) are overlaid on all 4 panels in blue |
The GOES-R IFR probabilities are useful when monitoring the formation of fog and/or low stratus (FLS) clouds. In this case over the Upper Midwest U.S. FLS started forming over eastern South Dakota and quickly spread to adjacent states eventually becoming widespread over most of the Upper Midwest. Surface observations of IFR conditions correlate very well to the areas of high IFR probabilities denoted by the dark orange to red colors. In the animation above the GOES-R IFR probabilities track the formation of the FLS with high confidence, evidenced by the relatively high IFR probabilities. The traditionally-used 3.9-11 micron BTD product also detects the FLS, but has difficulty detecting the spatial extent of the hazardous areas of the cloud deck. During the initial formation before 10Z Surface observations over Iowa and S. Minnesota indicate that elevated clouds are present, but they do not meet the IFR criteria for surface visibility (< 3 miles) and/or cloud ceiling (<1000 ft) until after a cluster of showers and thunderstorms passes through. This cluster of showers and storms can be seen in the 3.9-11 micron BTD as the gray and black circular area moving east over Iowa. In these types of situations the satellite only approach does not provide any information on what's going on near the surface because the satellite can only view the top most cloud layer. Using a blended approach merging satellite information with modeled forecast data from the Rapid Refresh model the IFR probabilities can still provide useful information on the presence of hazardous low cloud conditions even when multiple cloud layers are present.
The GOES-R LIFR probabilities can be useful for gaining confidence on whether the FLS is near the surface or if the cloud deck is elevated. Areas of relatively higher IFR and LIFR probabilities usually correlate well to lower surface visibility observations while areas of relatively high IFR probabilities and low LIFR probabilities usually correspond to higher surface visibilities but low cloud ceilings.
When the Sun rises, reflected solar radiation makes using the traditional BTD very difficult. The GOES-R IFR probabilities are available both night and day so users will be able to use the products through sunrise and sunset with confidence. During the day the visible satellite image shows the smooth FLS deck over western Nebraska and what appears to be some cumuliform clouds over eastern Nebraska. Surface observations show IFR conditions are present over most of Nebraska and again correlate very well with high IFR probabilities, even in the presence of the overlaying cumuliform cloud deck.
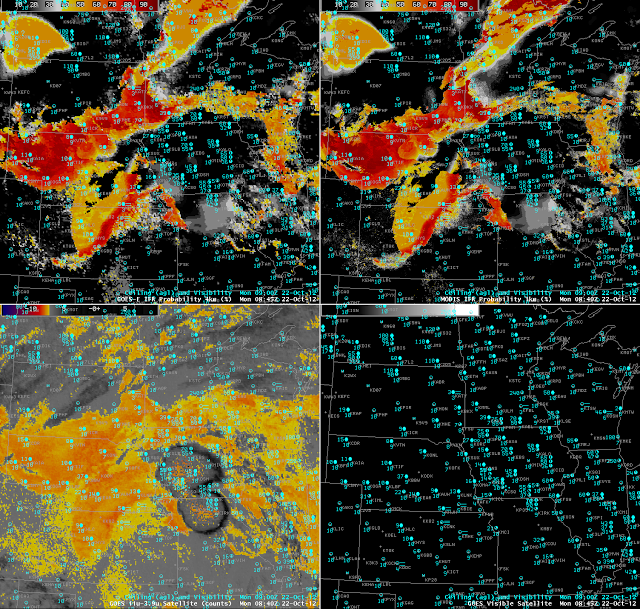 |
| GOES-R IFR probabilities applied to MODIS (upper left), GOES-R LIFR probabilities applied to MODIS (upper right), MODIS brightness temperature difference (3.9-11 µm) (lower left) and visible satellite image (lower right). Surface observations of visibility and cloud ceiling (above ground level) are overlaid on all 4 panels in blue |
The GOES data is available at a high temporal resolution, but only has a spatial resolution of 4km. Applying the GOES-R FLS products to MODIS allows the use of a much high spatial resolution (1km) dataset. The downfall is that since MODIS is on a polar orbiting satellite it is only available a few times per day. However, the higher spatial resolution allows the user to see much more detail than can be obtained using GOES data.