Monthly Archives: October 2020

IFR Conditions over Virginia

GOES-16 Night Fog Brightness Temperature Difference (10.3 µm – 3.9 µm) and IFR Probability at 0901 UTC, along with 0900 UTC plots of surface ceilings and visibility (Click to enlarge)

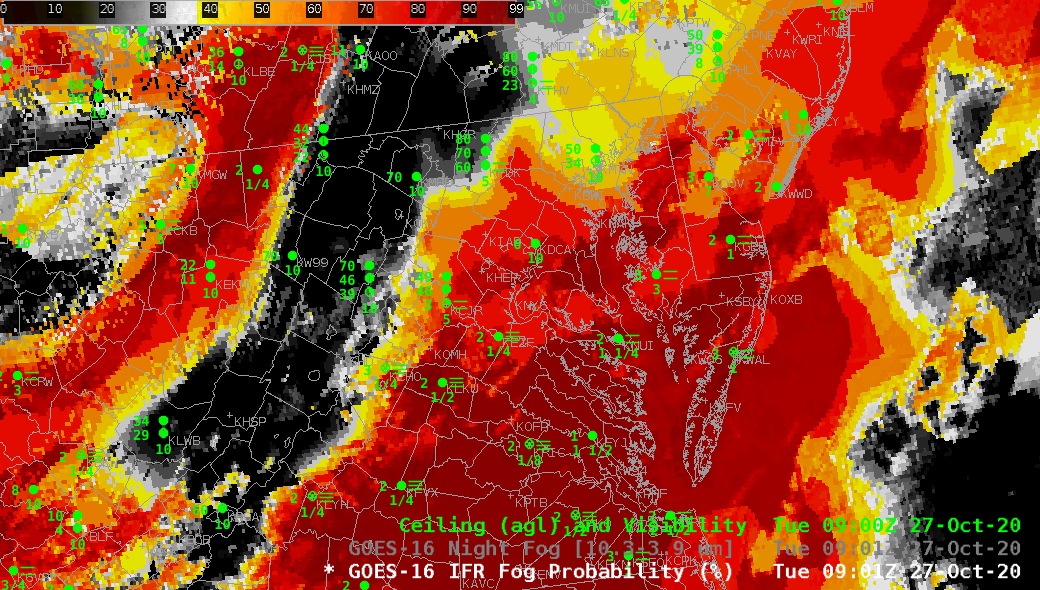
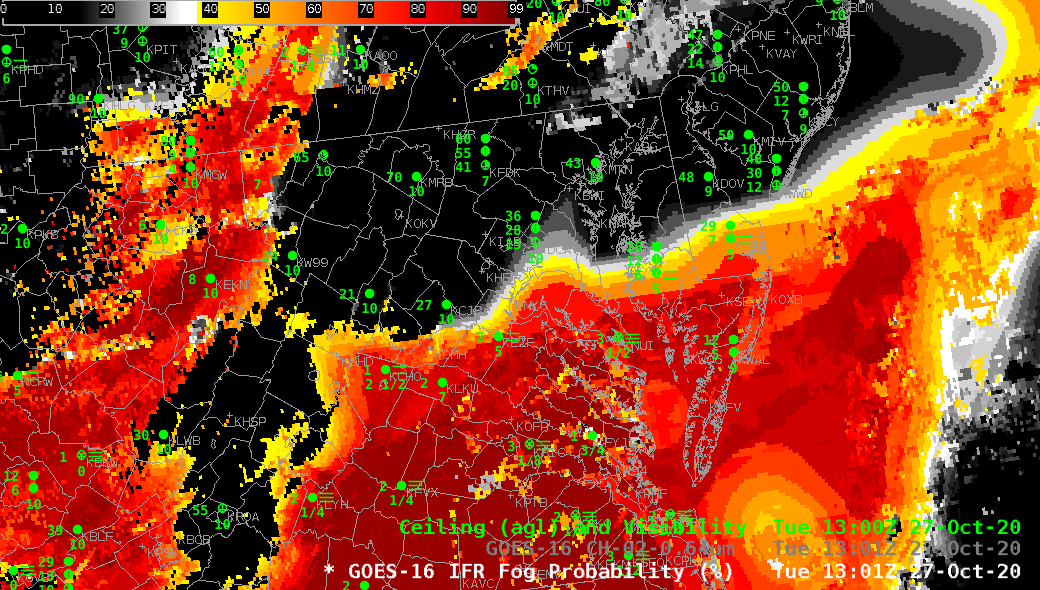
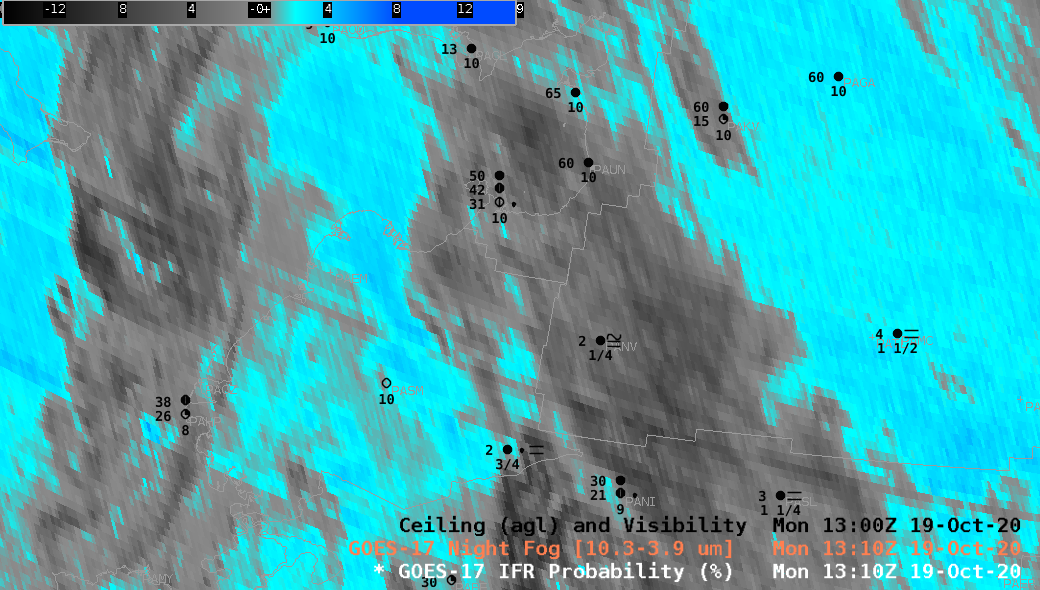
GOES-16 IFR Probability fields, above, from 0901 UTC on 27 October 2020 (in a toggle with the Night Fog Brightness Temperature Difference), outline two regions of likely IFR conditions over Virginia and surrounding states. Southern Virginia shows restricted conditions, as does the high terrain along the spine of the Appalachians, extending up to Johnstown PA. (Surface observations largely agree with IFR Probability fields: IFR Probability is high where ceilings are low and visibilities are restricted; IFR Probability is low in regions where IFR conditions are not occurring).

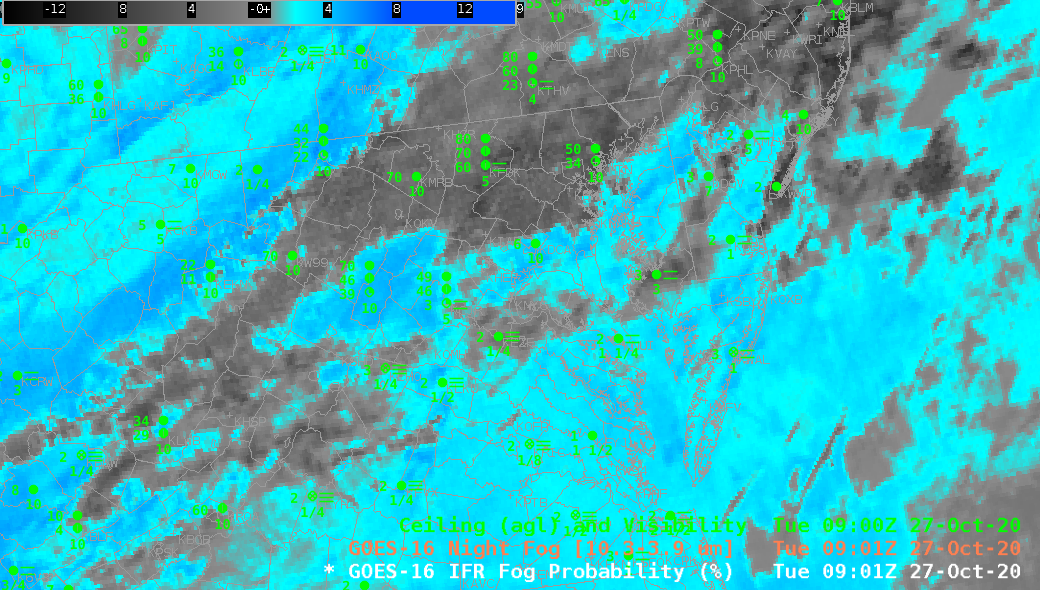
Night Fog Brightness Temperature Difference fields (10.3 µm – 3.9 µm), struggle to identify regions of IFR conditions — elevated stratus (over western Virginia and western Maryland, for example) has a similar signal to fog over southeastern Virginia. There are also regions of high clouds above the low stratus over Maryland and Virginia surrounding middle Chesapeake Bay. In such regions, high IFR Probability is being driven by Rapid Refresh model predictions of low-level saturation.


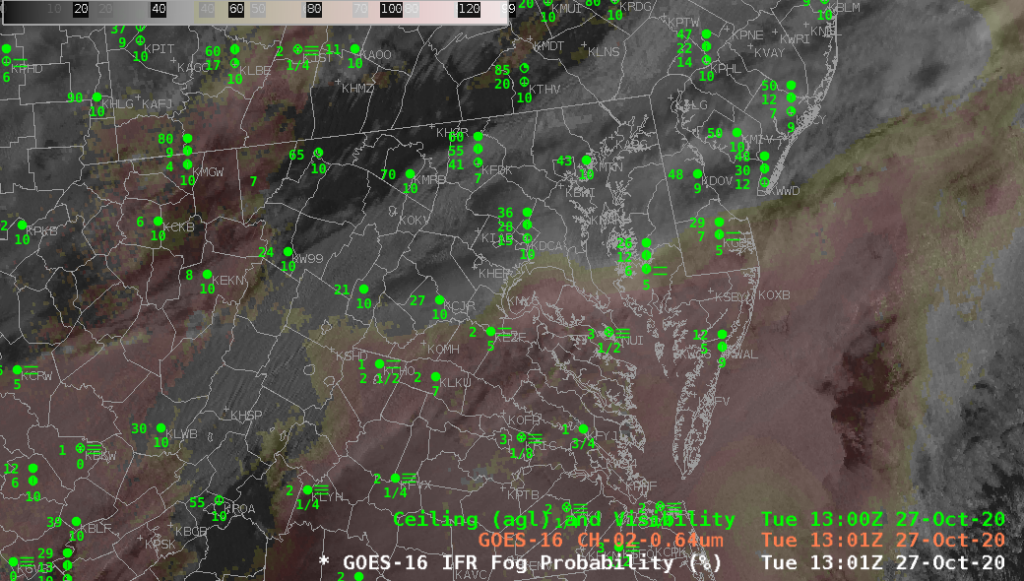
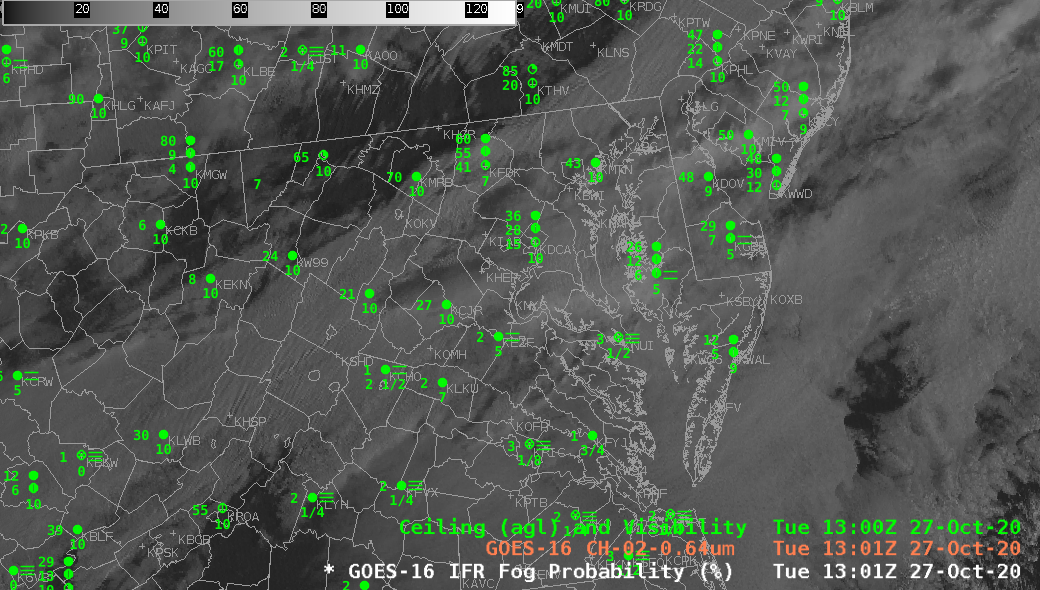
Visible imagery (0.64 µm) toggled with the IFR Probability fields at 1301 UTC, below, show how IFR Probability fields can better discriminate between stratus and fog than visible imagery alone.

GOES-16 Band 2 Visible (0.64 µm) and IFR Probability, 1301 UTC on 27 October 2020 (Click to enlarge)

Use IFR Probability fields to identify regions that have low ceilings and reduced visibilities when Visible imagery (in the day) and Night Fog Brightness Temperature difference (at night). During the day time, this can be achieved by displaying both images at once.

GOES-16 IFR Probability underneath the Visible (0.64 µm) imagery, 1301 UTC, 27 October 2020 (with a transparency alpha of 0.9 applied; click to enlarge)

GOES-17 IFR Probability over western Alaska

GOES-17 IFR Probability fields and GOES-17 Night Fog Brightness Temperature Difference (10.3 µm – 3.9 µm), 1310 UTC on 19 October 2020 (Click to enlarge)

CIMSS is now creating GOES_17 IFR Probability fields for Alaska and will presently be distributing them to the Alaska Region. An example of the utility of the products occurred on 19 October over western Alaska. The toggle above between the Night Fog brightness temperature difference field and the IFR Probability field at 1310 UTC 19 October shows several regions where IFR Probability refines where ceilings and visibilities might restrict aviation — an important piece of information in Alaska.

The default Night Fog Brightness Temperature enhancement is constructed so that stratiform clouds containing water droplets are colored different shades of blue. Higher clouds are various shades of grey.

Consider station PANV — Anvik, AK, near 62.7 N, 160 W. This is a station reporting IFR conditions, and IFR probabilities are near 80%. However, it is also under high clouds; GOES-17 is prevented from viewing low clouds, but the Rapid Refresh model data used in IFR Probability is showing saturation. Model data fills in regions of IFR conditions where high (of mid-level) clouds prevent the satellite from viewing near-surface clouds. Note how IFR Probability is also able to distinguish — correctly — between the IFR conditions at Anvik with the more benign sky conditions to the north at St. Michaels (PAMK), Unalakleet (PAUN) and Shaktoolik (PFSH) along Norton Sound.

In contrast, station PASM — St. Mary’s AK, near 62 N, 163 W — is beneath a strong signal in the Night Fog brightness temperature difference field. However, IFR conditions are not reported, and IFR probabilities are near 40% (and decreasing abruptly to the south). In this region, IFR Probability fields are screening out a region of mid-level stratus.

Station PAMC — McGrath, AK, near 63 N, 155 W — shows near-IFR conditions with a local minimum IFR Probability near 40% and a strong signal of stratus clouds in the Night Fog Brightness Temperature difference. For this station it would be prudent to see how IFR Probabilities were changing with time.

IFR Probability combines the strengths of satellite detection of low clouds with the strength of Rapid Refresh model predictions of low-level saturation to create a product useful in regimes with single or multiple cloud layers.

IFR Probability near a major aviation hub

GOES-16 IFR Probability, 0926 – 1101 UTC on 12 October 2020 (Click to enlarge)

The New York City area has 3 major international hubs for which ceiling/visibility observations and prediction are critical to efficient operations. IFR Probability fields use both satellite data and Rapid Refresh model data and can supply information about low-level conditions even where mid-level or upper-level clouds obscure a satellite’s view of low clouds. The example above shows very slow northeastward progress of an area of potential IFR conditions towards New York.

Satellite-only data, below, in the form of the night fog brightness tempreature difference from GOES-16, does not give a useful signal for the low clouds along the east coast. A conclusion: Use IFR Probability to monitor the progress of low clouds when multiple cloud decks are present.

GOES-16 ‘Night Fog’ Brightness Temperature Difference (10.3 µm – 3.9 µm) field, 1006-1101 UTC, 12 October 2020 with 0900 UTC frontal analysis overlain on first image (Click to enlarge)
GOES-16 IFR Probability and GOES-16 ‘Night Fog’ Brightness Temperature Difference (10.3 µm – 3.9 µm) field, 1101 UTC, 12 October 2020 (Click to enlarge)

The toggle above, between IFR Probability and the Brightness Temperature Difference demonstrates and underscores (1) how IFR Probability can fill in regions under low clouds (in Delmarva and New Jersey, for example), and screen out regions with mid-level stratus (over eastern Lake Ontario the surrounding land, and over eastern Ohio, for example).

IFR Probability fields are supplied to AWIPS (TOWR-S Build 19) via the SBN.

Low Stratus under Cirrus

GOES-16 ‘Night Fog’ Brightness Temperature Difference (10.3 µm – 3.9 µm), 1151 and 1246 UTC on 9 October 2020 (Click to enlarge)

The extensive cirrus shield from Hurricane Delta in the Gulf of Mexico made difficult the satellite-based detection of stratus and low clouds over much of the Deep South on Friday 9 October. The Night Fog Brightness Temperature Difference is also affected by increased solar reflectivity at 1246 UTC in the imagery above. The low clouds over southern Illinois are no longer detected, for example, and the high cirrus of Delta becomes much darker — in both cases because of increased reflectivity of 3.9 µm solar radiation.

The toggle below between the Night Fog Brightness tempreature difference and the Band 4 near-infrared “Cirrus” channel just after sunrise (1246 UTC) shows the extensive cirrus signal in both images. Widespread cirrus is not uncommon, thus the difficulty in detection is not uncommon

GOES-16 Night Fog Brightness Temperature Difference (10.3 µm – 3.9 µm) and near-infrared 1.38 µm “Cirrus” Band 4, 1246 UTC on 9 OCtober 2020 (Click to enlarge)

GOES-R IFR Probability fields, below, compared to the Night Fog Brightness Temperature fields highlight how IFR Probability, which fields include information about low-level saturation in the Rapid Refresh model, capably fills in regions of fog/low stratus underneath high clouds. It is useful for situational awareness in fog detection when satellite imagery is showing only upper-level clouds. For example, note the large values of IFR Probability in western Kentucky, under the high cirrus, or in northeast Texas! There is good spatial correlation between high IFR Probabilities and reduced ceilings/visibilities. The correlation between the Night Fog Brightness Temperature difference field and reduced ceilings/visibilities is smaller because of low visibility under cirrus (as occurring over northwestern TN and much of LA, for example). Note that IFR Probability fields also give information where IFR conditions are not occurring under cirrus: central Mississippi, for example.

GOES-16 IFR Probability and Night Fog Brightness Temperature Difference (10.3 µm – 3.9 µm) at 1151 UTC on 9 October 2020 (Click to enlarge)

IFR Probability fields through sunrise (below) show a consistent signal, in part because of the Rapid Refresh model information on saturation.

GOES-16 IFR Probability fields, 1151 and 1246 UTC on 9 October 2020 (Click to enlarge)

The CIMSS-driven LDM feed that has supplied GOES-16 IFR Probability fields (and before GOES-R’s launch, GOES-13 and GOES-15 IFR Probability fields) to NWS offices will be terminated on or about 20 October. Operational creation of GOES-16 IFR Probability fields has shifted to NOAA/NESDIS, and the fields are now sent over the SBN to forecast offices. TOWR-S Build 19 is required to access and display these fields in AWIPS.