Monthly Archives: April 2018

Fog over the mid-South

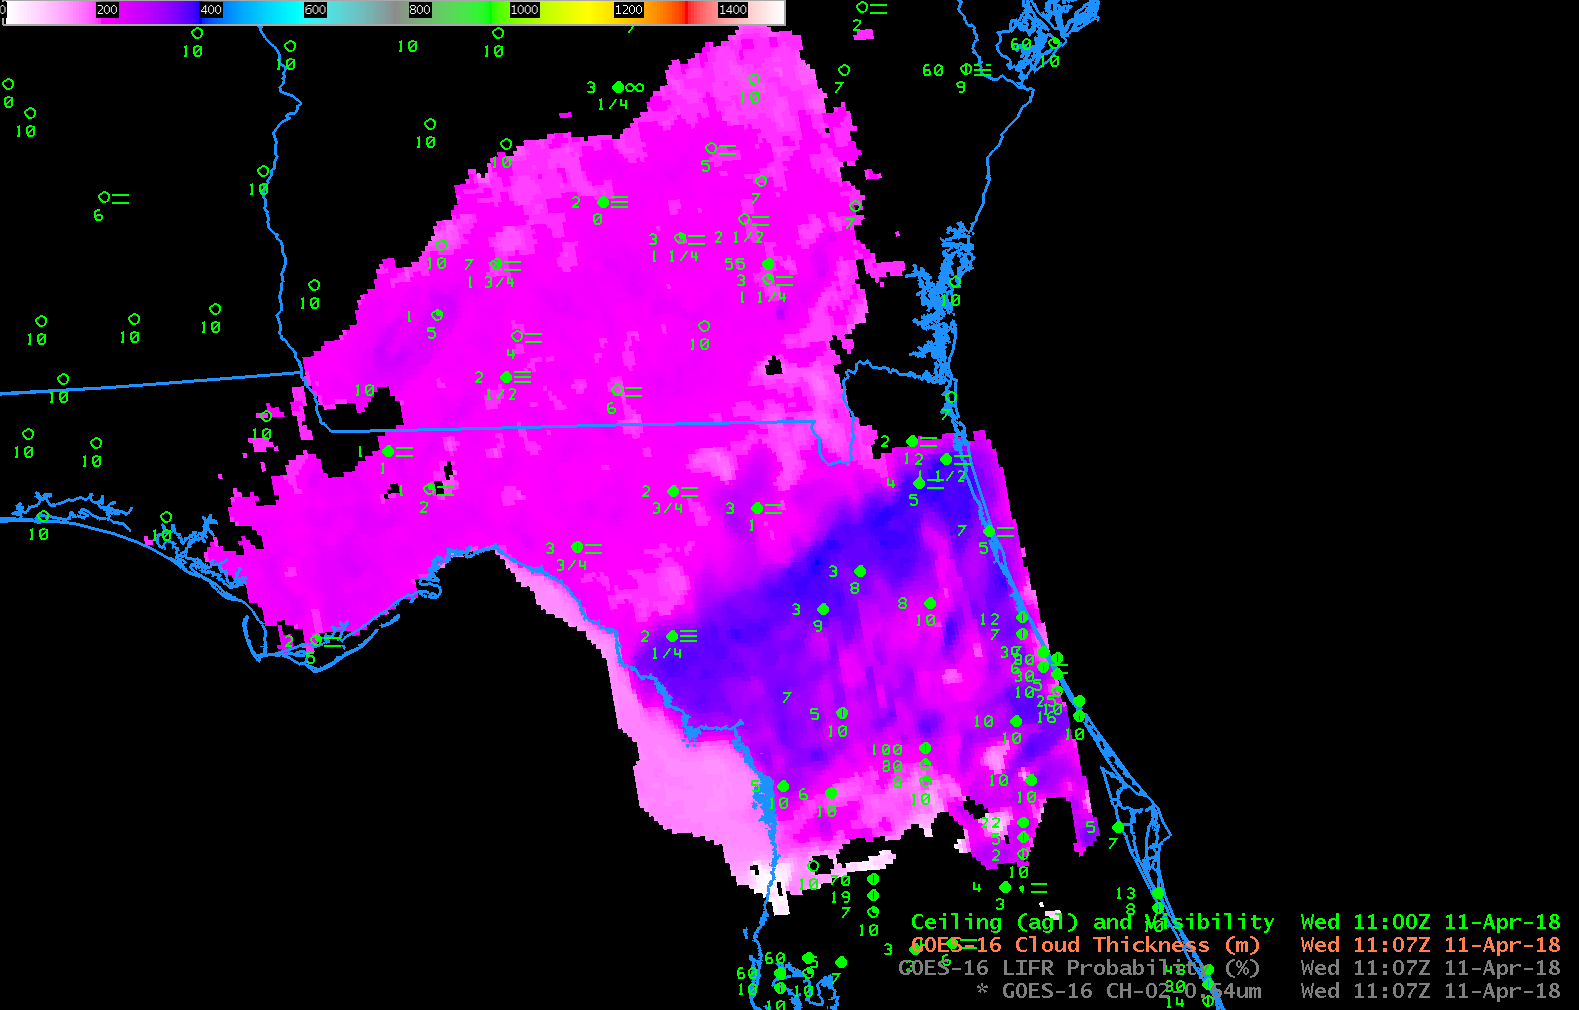
GOES-16 IFR Probability fields with a 10-minute time step from 0752-1422 UTC on 25 April 2018 (Click to enlarge)

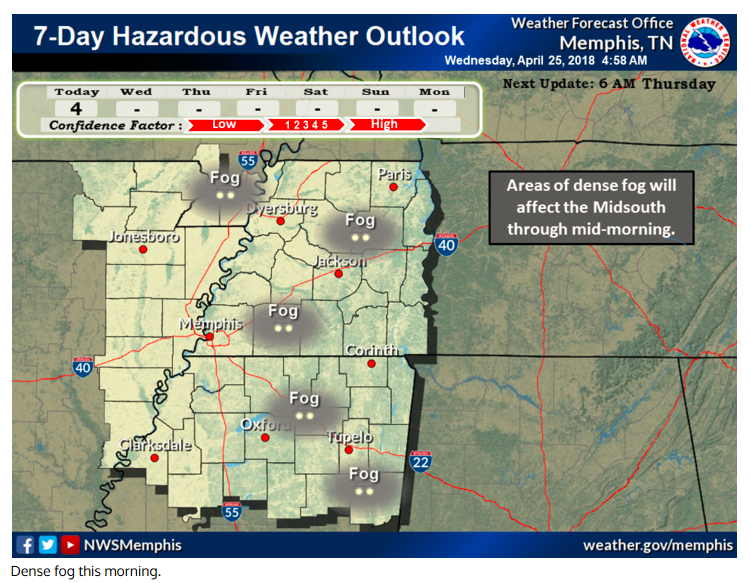
Dense Fog developed over the mid-south on April 25th, and Dense Fog Advisories were issued by the National Weather Service Forecast Office in Memphis for portions of western Tennessee and northern Mississippi.  GOES-16 IFR Probability fields above, show the development of strong signal in IFR Probability over western Tennessee starting after 0900 UTC.  The satellite signal for this event was weak (see below); the sudden appearance of an IFR Probability signal at 0900 UTC suggests that the Rapid Refresh model simulation quickly changed from insufficient saturation for a strong signal to a better signal of fog when the model simulation valid at 0900 UTC was used.  When IFR Probabilities suddenly change absent a big change in satellite signal, the cause is likely a change in the Rapid Refresh model output.

Night fog Brightness temperature difference, below, shows a weak signal over river valleys of western Tennessee and northwestern Mississippi.

GOES-16 Night Fog Brightness Temperature Difference (10.3 µm – 3.9µm) 0822-1452 UTC on 25 April 2018 (Click to enlarge)

Because the signal in the brighntess temperature difference field is weak, the signal for fog in the Nighttime Microphysics RGB (which has as its green component the Night Fog Brightness Temperature Difference) is also weak. The toggle below shows the Night Fog Brightness Temperature Difference, the RGB, and the IFR Probability fields, all at 0952 UTC on 25 April.

GOES-16 Night Fog Brightness Temperature Difference (10.3 µm – 3.9µm), NIghttime Microphysics RGB and GOES-16 IFR Probability fields, all at 0952 UTC on 25 April 2018 (Click to enlarge)

Cloud Thickness as a Fog Dissipation Predictor

GOES-R Cloud Thickness, 0922-1107 UTC on 11 April 2018 (Click to enlarge)

GOES-R Cloud Thickness can be used (along with this scatterplot) to estimate when fog or low clouds in a region will burn off. This look-up table is most appropriate when used with Radiation Fogs. GOES-R Cloud Thickness is created from a look-up table that was developed using SODAR observations of low clouds off the west coast of the USA and GOES-West (Legacy GOES) observations of 3.9 µm emissivity. These thickness values just before sunrise were then compared to subsequent imagery to determine when the observed fog/low clouds dissipated and the scatterplot was created.

In the case above, the final GOES-R Cloud Thickness field before sunrise conditions occurred at 1107 UTC (Note in the image how low clouds have vanished just off the coast of northeast Florida)   Values over southern Georgia and most of northeast Florida were in the 200-m range:  Very thin!  The scatterplot suggests that such a thickness (equal to about 700 m) will dissipate within an hour. A small strip of somewhat thicker clouds (blue enhancement, suggesting a thickness of 350-400 m) stretched southwestward from Jacksonville to the Gulf of Mexico.

IFR Probabilities during this time before sunrise show enhanced values where IFR and near-IFR conditions are present.  Note that that region of thicker clouds (thicker as diagnosed by the GOES-R Cloud Thickness product) shows higher IFR Probabilities.

GOES-16 IFR Probabilities, 0922 UTC to 1412 UTC on 11 April 2018 (Click to enlarge)

The GOES-16 ‘Night Fog’ Brightness Temperature Difference product, below, shows a small signal over southern Georgia where IFR Conditions are present, and where Cloud Thickness is small.  There is a stronger signal southwest of Jacksonville, which may be one reason that the IFR Probability value there are somewhat stronger than over southern Georgia and extreme northern Florida.  Note also : (1) the sign of the Brightness Temperature Difference flips when the sun rises as increasing amounts of reflected solar 3.9 µm radiation overwhelm the emissivity-driven differences and (2)  the Brightness Temperature Difference field gives little surface information under the cirrus shield over central Florida (or over the Atlantic Ocean).

GOES-16 ‘Night Fog’ Brightness Temperature Difference (10.3 µm – 3.9 µm) from 0922 through 1412 UTC on 11 April 2018 (Click to enlarge)

Visible imagery, below, shows a quick dissipation to the fog and low clouds as expected given their diagnosed thin nature by the Cloud Thickness product.

GOES-16 ABI Visible (0.64 µm) imagery, 1112-1412 UTC on 11 April 2018 (Click to enlarge)