Monthly Archives: March 2017

Fast-moving Fog over northeast Montana

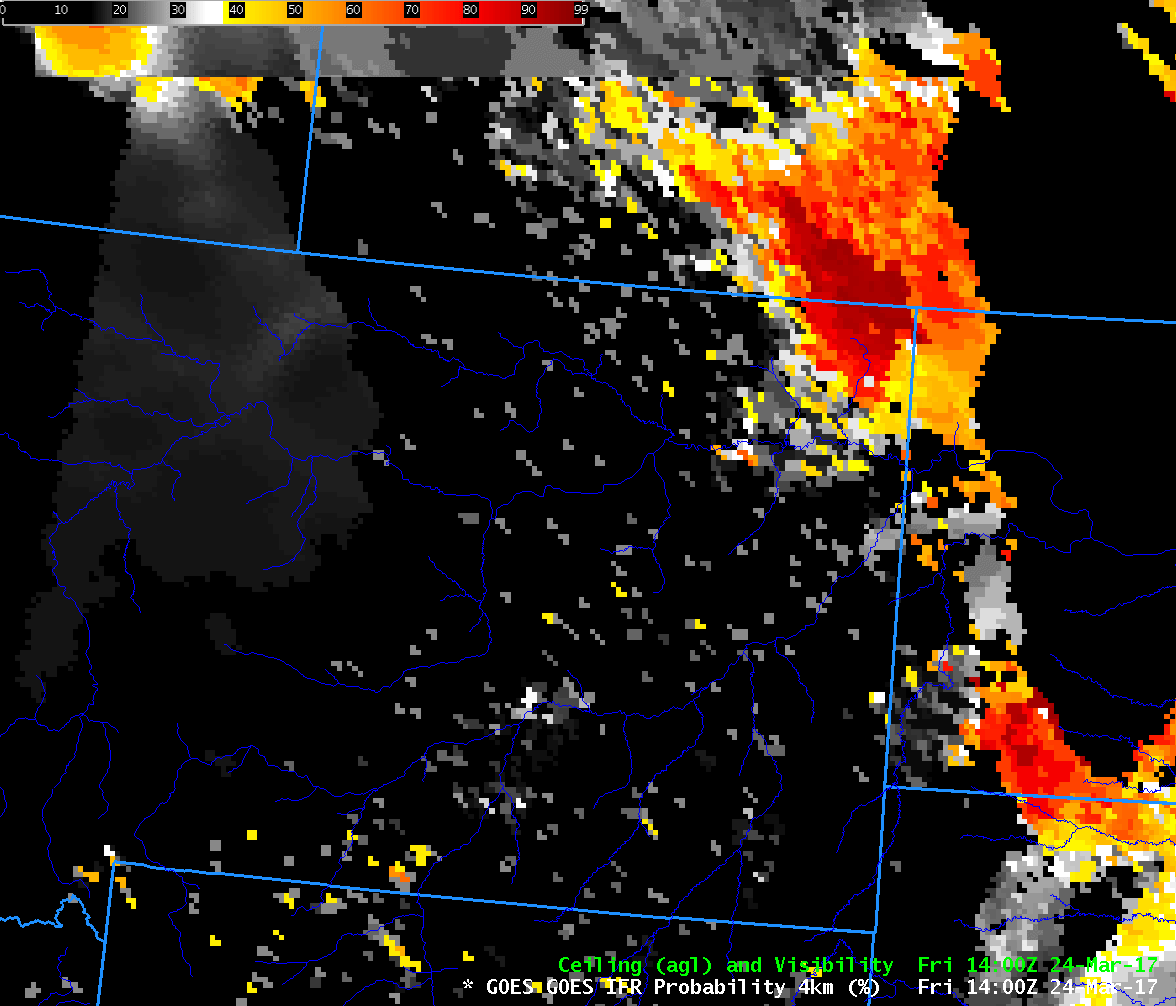
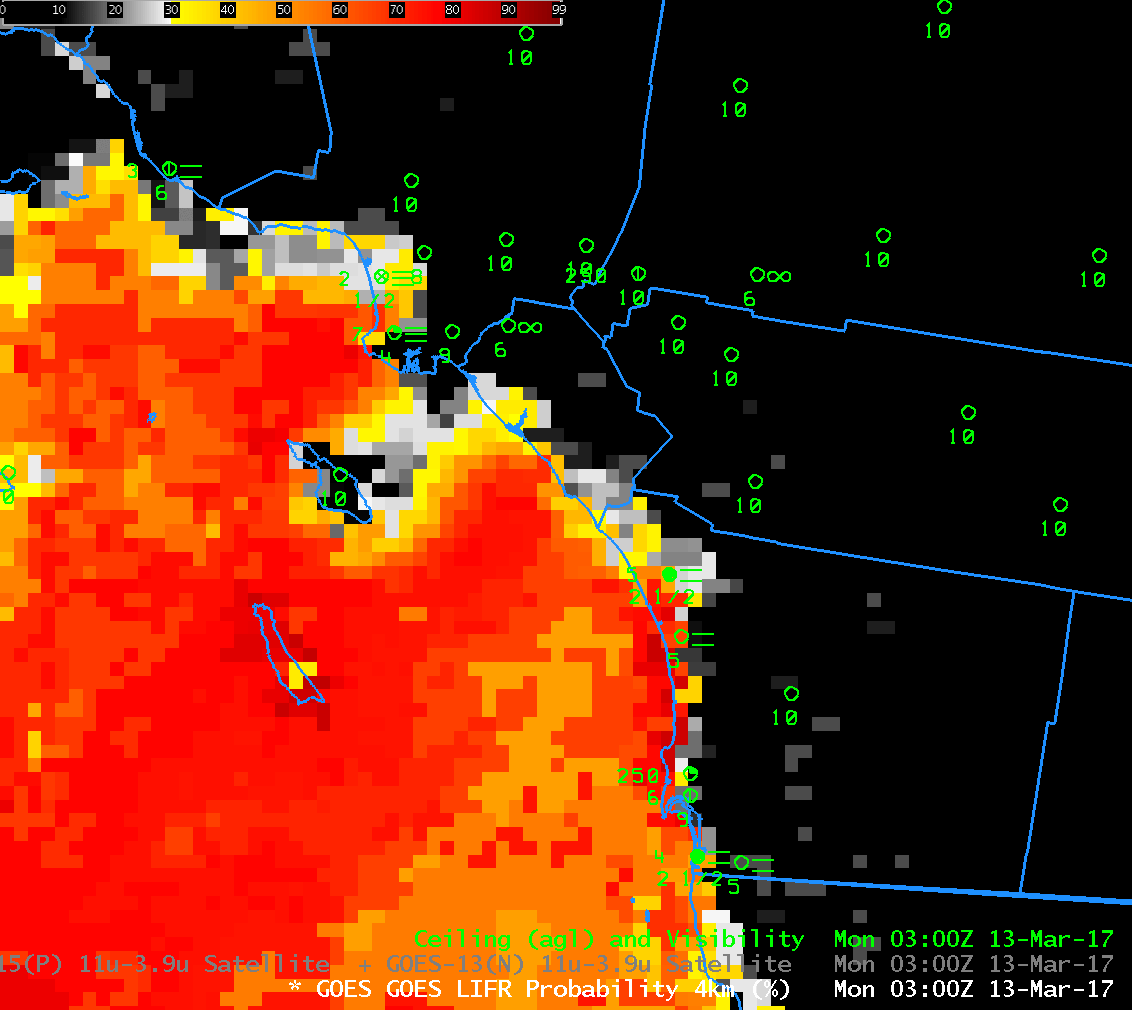
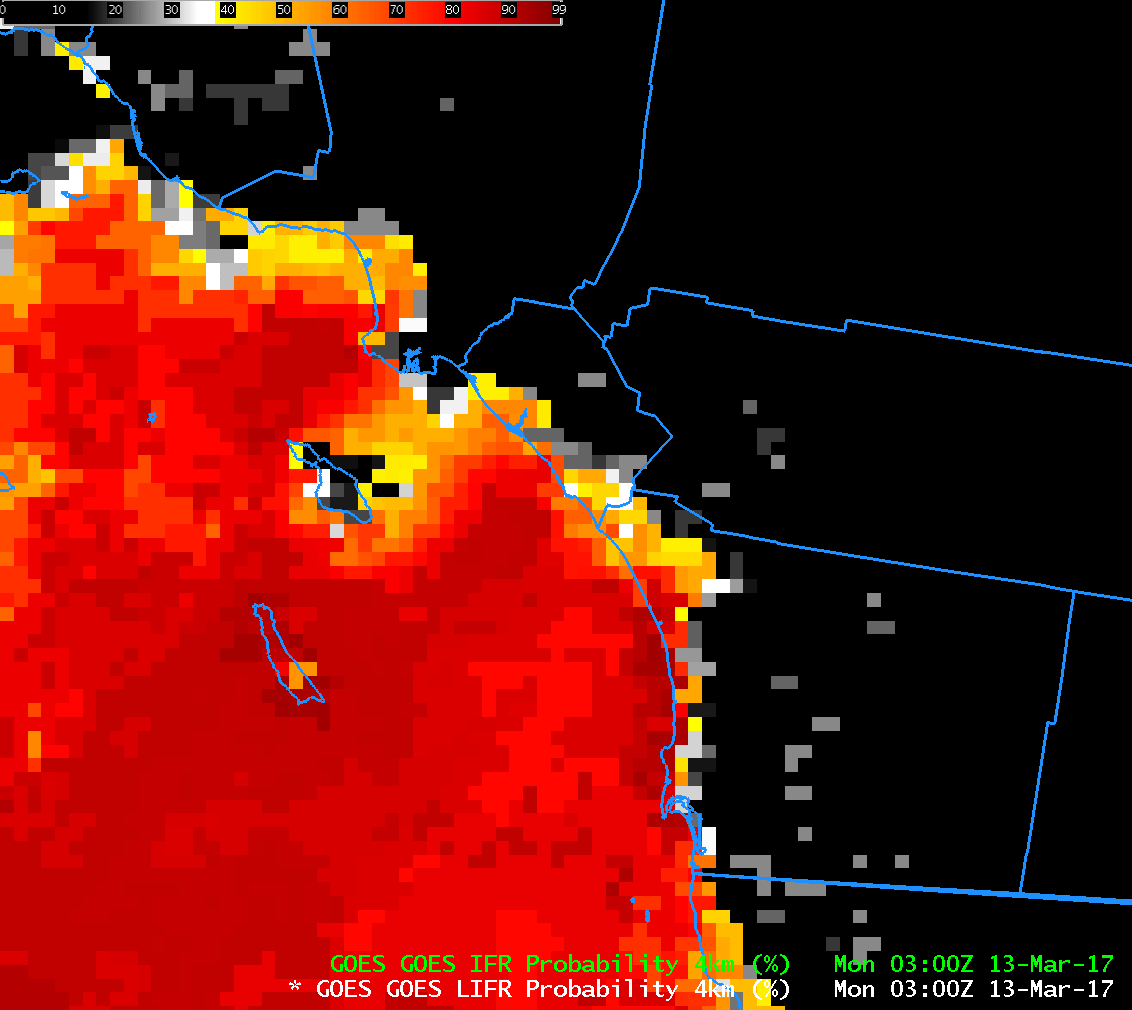
GOES-R IFR Probability fields computed with GOES-13 and Rapid Refresh Data, 1400-1500 UTC on 24 March 2017 (Click to enlarge)

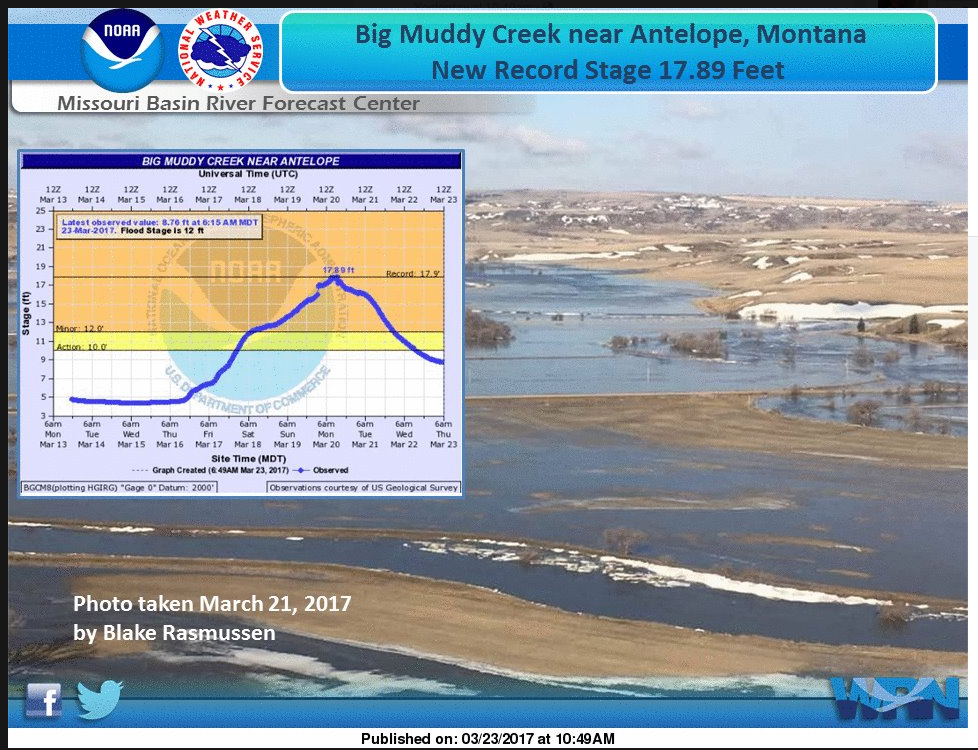
Rains over Montana earlier this month (data from this site) (along with snowmelt) caused substantial flooding on Big Muddy Creek in the extreme northeast part of the state. Saturated soils in that region have increased the likelihood of fog, and fog was indicated by IFR Probability in that region on the morning of 24 March as shown above.

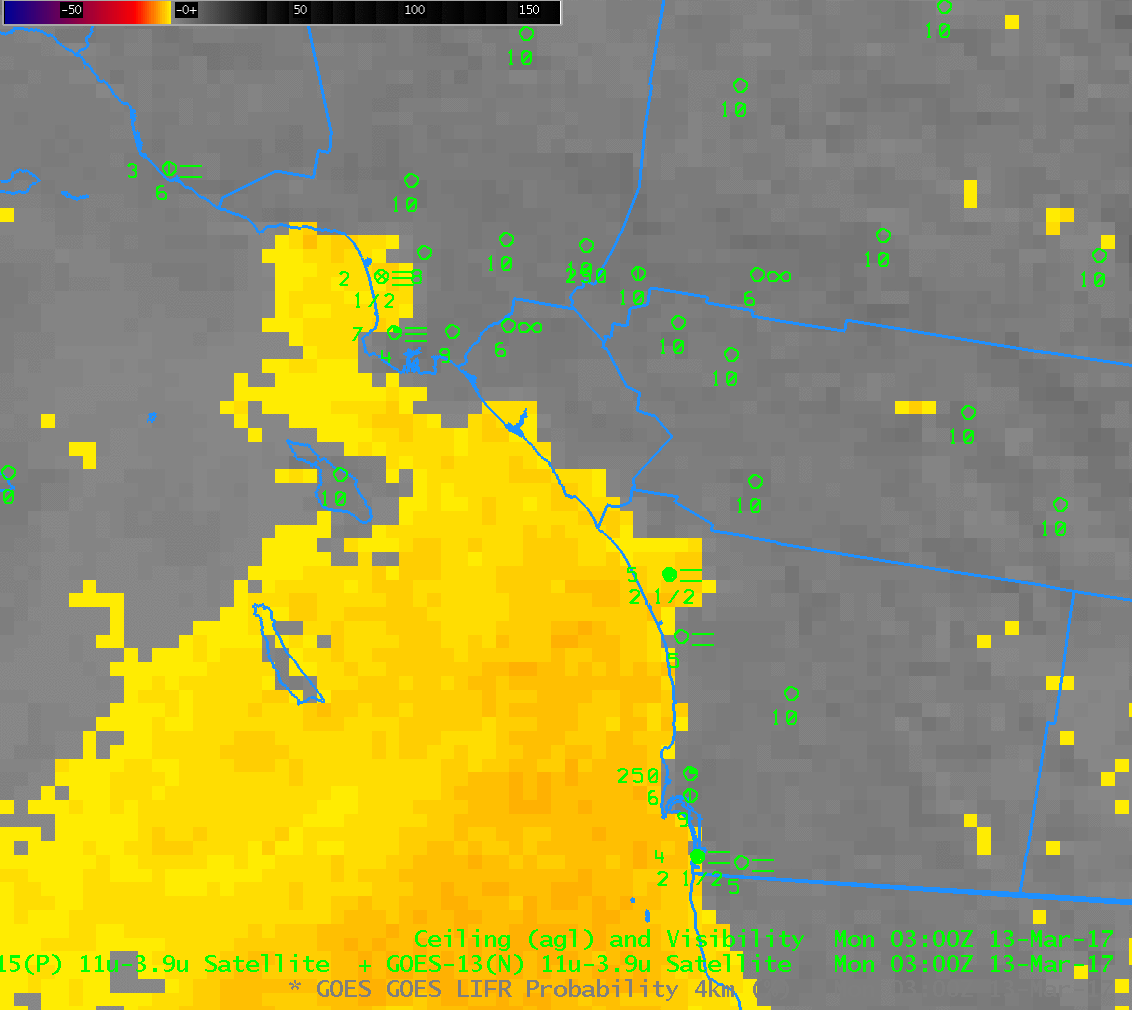
GOES-16 Visible Imagery showed the fog speedily moving down Big Muddy Creek. An animation using GOES-13 Visible imagery (0.64 µm) is shown below. The GOES-16 CONUS cadence is every five minutes; it is every 15 minutes with GOES-13, except when Full Disks are being scanned (14:45 UTC) or when housekeeping is occurring (15:30 UTC).

GOES-13 and GOES-16 visible data both show quick movement of the fog. For this case, it was harder to judge motion from the IFR Probability fields. This could be related to Infrared and model resolution; the creek valley might be too narrow for the satellite infrared data and for the model.

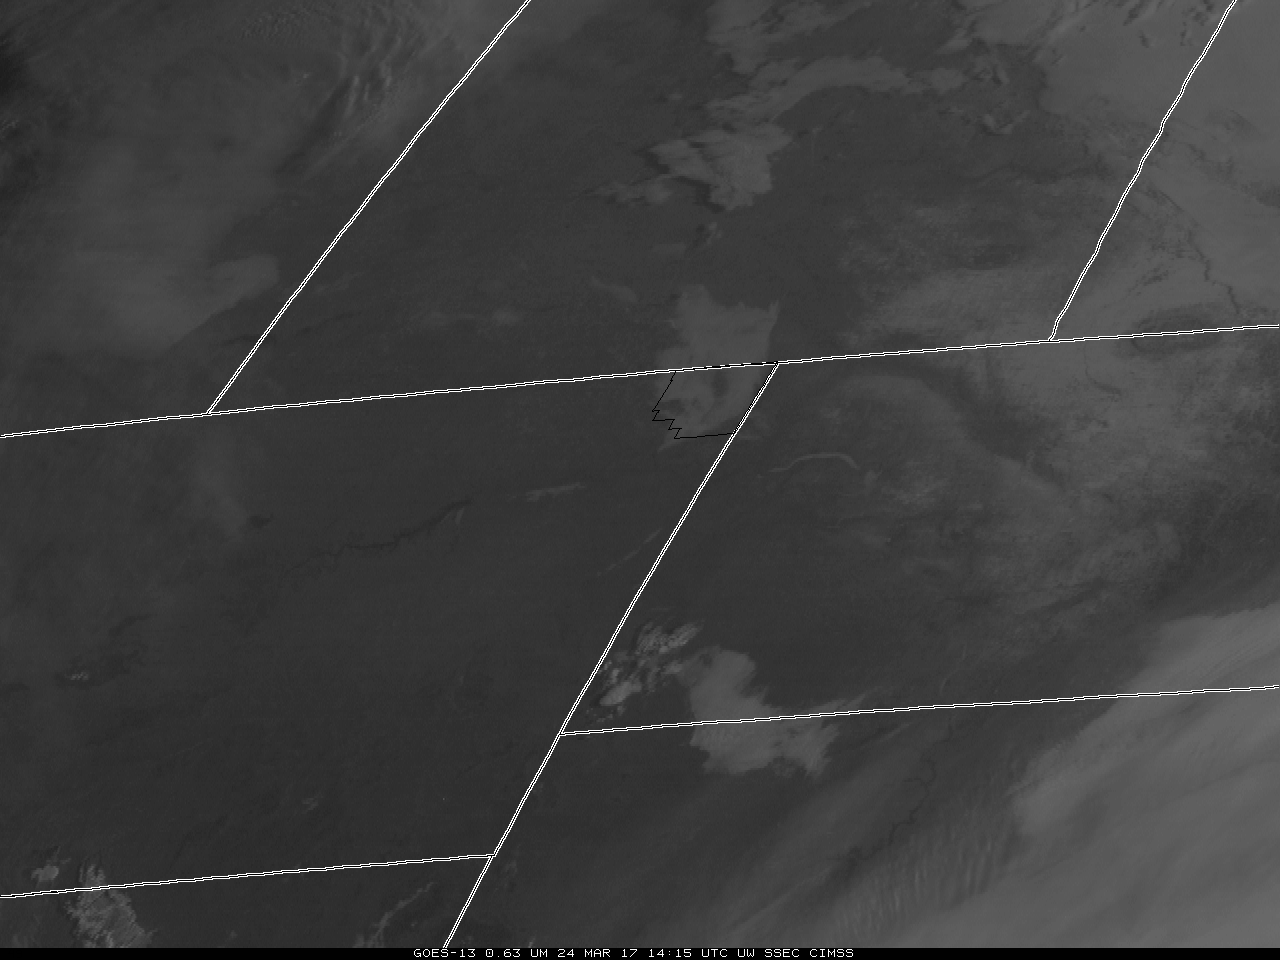
GOES-13 VIsible (0.64 µm) imagery, 1415-1615 UTC. Sheridan County Montana is outlined in the first image. Fog advancing down Big Muddy Creek is apparent

Dense Fog in Louisiana

GOES-R IFR Probabilities computed using GOES-13 and Rapid Refresh Data, 0400-1000 UTC on 20 March 2017 (Click to enlarge)

Note: GOES-R FLS products are currently derived from GOES-13 and GOES-15 data. A GOES-16 version of the GOES-R FLS products will not be available until later in 2017.

Dense Fog advisories were issued for much of central and southern Louisiana (screenshot taken from this site) on Monday morning, 20 March 2017;  IFR and Low IFR conditions were widespread (screenshot from this site).  The animation above shows the development of IFR Probabilities in concert with the development of IFR conditions. A strength of the IFR Probability field on this day was that it indicated the possibility of fog development some time before satellite brightness temperature difference fields. Low-level saturation was (correctly) occurring in the Rapid Refresh model, and that helped increase IFR Probability values.

Consider the toggle below, showing, the IFR Probability and Brightness Temperature Difference fields at 0500 UTC. The Brightness Temperature Difference field over coastal Louisiana at 0500 shows little indication of fog development. An animation brightness temperature difference fields that matches the 0400-1000 UTC timeframe shown above for IFR Probabilities is below. Although a strong brightness temperature difference signal is present in Texas, it does take some time for the signal to develop over Louisiana. IFR Probabilities were more helpful for situational awareness on this day.

IFR Probabilities and GOES-13 Brightness Temperature Difference Fields (3.9 µm – 10.7 µm), 0500 UTC on 20 March 2017 (Click to enlarge)

GOES-13 Brightness Temperature Difference (3.9 µm – 10.7 µm), 0400-1000 UTC on 20 March 2017 (Click to enlarge)

Marine Stratus over southern California

GOES-R IFR Probability, hourly from 0300 to 1300 UTC, 13 March 2017 (Click to enlarge)

Note:  GOES-R FLS products are currently derived from GOES-13 and GOES-15 data.  A GOES-16 version of the GOES-R FLS products will not be available until later in 2017.

IFR Conditions developed early on March 13th 2017 as Marine Stratus moved over the southern California. This is a typical occurrence that nevertheless requires timely monitoring because of the impact of fog on transportation. The Brightness Temperature Difference fields, below, show the tops of the clouds. Water clouds do not emit 3.9 µm radiation as a blackbody, but they do emit 10.7 µm radiation nearly as a blackbody. Result: Inferred brightness temperatures (a computation that assumes blackbody emission from the source) are cooler and 3.9 µm than at 10.7 µm, and a difference field will highlight clouds made up of water droplets, i.e., stratus. If the stratus is at the surface, fog is a result. Low IFR Probability fields, above, include surface information in the form of low-level relative humidity fields from the Rapid Refresh model. Only where saturation near the surface is indicated by the model will Low IFR Probabilities be large.

In the animation above, IFR conditions develop along the coast and penetrate inland as Low IFR Probabilities increase.  Probabilities are decreasing by 1300 UTC.

IFR and Low IFR Conditions are shown in this plot from the Aviation Weather CenterThis toggle, from 0300 UTC, shows both Low IFR Probability and IFR Probability.  As might be expected, IFR Probabilities exceed Low IFR Probabilities

GOES-15 Brightness Temperature Difference (3.9 µm – 10.7 µm) Fields, hourly from 0300 to 1300 UTC on 13 March 2017 (Click to enlarge)

GOES-16 Data are Flowing

GOES-R IFR Probability that uses present GOES (GOES-13 and GOES-15) data in the computation of GOES-R IFR Probability fields was designed in anticipation of GOES-16 data that are now flowing to National Weather Service Forecast offices. Click here for a description of the Brightness Temperature Difference field values that are available now in AWIPS from GOES-16.

GOES-R FLS products are currently derived from GOES-13 and GOES-15 data.  A GOES-16 version of the GOES-R FLS products will not be available until later in 2017.